C
C
I
I
R
R
E
E
D
D 17
th International Conference on Electricity Distribution Barcelona, 12-15 May 2003SUPPLY RELIABILITY CONTROL IN THE BUENOS AIRES METROPOLITAN AREA -
STATISTICAL METHODS RESULTS AND EVALUATION
Pedro E. ISSOURIBEHERE, Juan C. BARBERO Jorge L. MARTÍNEZ, Luis D. MAZZEO, Gabriel A. INGANI
Universidad Nacional de la Plata – Argentina Ente Nacional Regulador de la Electricidad - Argentina
[email protected] [email protected]
INTRODUCTION
At present (Stage 2) the control of the Technical Service Quality - rate and duration of the interruptions - in the Metropolitan Area of Buenos Aires takes place at user level, according to that established in [1]-[3], by means of the pursuit of two semester indicators: frequency and total time of interruption.
When some of the limits (which depend on the different effective tariffs) of such indicators is exceeded, the Utilities are subject to penalties. The amount of the penalty is function of the deviation corresponding to each user and of the valuation of the non supplied energy (NSE), and is credited in the account of the affected user (bonus). According to the regulation in Argentina, only interruptions longer than 3 minutes are penalized.
The Distribution Utilities must report periodically to the Regulatory Agency the tables containing information of the occurred contingencies. This information is prepared to be tied with the network topology data and with the commercial information of the users, being able thus to obtain indicators of interruptions at level of each provision.
On the other hand, the control of the supply reliability –or
technical service quality as named in Argentina– implemented by the Utilities is audited by the National Regulatory Agency (ENRE) by means of measurements in field, devoted to detect deviations in the information sent by the Utilities [4].
Field measurements are carried out with Voltage Event Recorders (VER) which are single-phase devices that collect information about events originating from the network (interruptions and microinterruptions, and high/low level voltage). The VER installation, operation and basic data processing are carried out by the IITREE of La Plata National University (UNLP).
In this work the results of the statistical processing of the interruptions longer than 3 minutes - amount of interruptions and total time of interruption - are presented.
These determinations were made with the information arising from two different sources: on the one hand, the field information collected with VER over more than four years until February 2002; and on the other hand, the information corresponding to the total interruptions reported to the Regulatory Agency by the three Utilities of the Buenos Aires Metropolitan Area (hereinafter named A, B and C).
DEFINITIONS
Statistical indicators used in Electrical Services are the same used to define equipment and system Reliability.
To evaluate those indicators, for each monitored location the following magnitudes were obtained.
Interruption rate:
Mi
N
tot6
=
λ
(1)Restoration time:
Mi D r
10
= (2)
Unavailability:
Mi
D
Q
tot10
=
(3)where:
∑
==
Ntot ii
tot
D
D
1
∑
== Ntot
i i tot
D N
D
1
1
Being for each customer:
• Di: Interruption duration [min].
• Ntot: Total number of recorded interruptions.
• Mi: Number of months that the location was monitored.
• λ: Interruption rate expressed in [interruption/semester]
• r: Restoration time expressed in [hour/interruption].
• Q: Unavailability [hour/semester]
Average values of indicators given by expressions (1) to (3), extended to the corresponding network level, are respectively the System Average Interruption Frequency Index (SAIFI),
Customer Average Interruption Duration Index (CAIDI) and the System Average Interruption Duration Index (SAIDI). These index are industry standard of electrical outages and are extensively used by Distribution Utilities.
QUALITY INDICATORS FROM OFFICIAL DATA
[image:1.595.312.504.262.440.2]Here some results obtained from the information reported to the National Regulatory Agency by the Utilities are presented.
Figure 1 summarizes the statistical results obtained by computing the interruptions for all the customers of the Metropolitan Area of Buenos Aires.
The relative frequency of occurrence of each class of
-C
C
I
I
R
R
E
E
D
D 17
th International Conference on Electricity Distribution Barcelona, 12-15 May 2003interruption per semester and the accumulated frequency are indicated. The average value of the rate, the SAIFI resulted 3.0 interruptions per semester.
0 2 4 6 8 10 12 14 16 18 20
0 2 4 6 8
10 12 14
>1
5
Interruptions per semester [SAIFI: 3.0]
C u st om er s [ % ] 0 10 20 30 40 50 60 70 80 90 100 C u m u la ti v e F re q . [ % ] Customers [%]% Cumulative Freq, [%]
Figure 1. Interruption Rate in Buenos Aires.
[image:2.595.326.525.120.237.2]Three year results.
Figure 2 shows the statistical results of the unavailability suffered by the customers of the Metropolitan Area of Buenos Aires.
The relative frequency of occurrence of each class of unavailability and the accumulated frequency are indicated. The average value, the SAIDI, resulted 5.5 hours per semester. 0 15 30 45 60 N / I 0 5 5 10 10 15 15 20 20 25 25 30 30 35 35 40 40 45 45 50 M a
s de 50
Interruption rate [hours/semester] [SAIDI: 5.5]
C u st om er s [ % ] 0 25 50 75 100 C um ul at iv e F req. [ % ] Customers [%]
[image:2.595.70.273.120.241.2] [image:2.595.328.525.310.425.2]Cumulative Freq. [%]
Figure 2. Unavailability in Buenos Aires. Three year
[image:2.595.71.273.391.529.2]results.
Figure 3 shows the evolution of the average indicators during the period under study.
0 1 2 3 4 5 Semester SA IF I 0 2 4 6 8 10 SA ID I
SAIFI 3,41 4,52 3,98 4,51 4,57 SAIDI 4,09 6,08 4,39 3,95 8,78
[image:2.595.73.266.618.733.2]1 2 3 4 5
Figure 3. Evolution of Service Quality Indicators in
Buenos Aires.
Figure 4 compares the statistics of rates of interruptions between the three Utilities (A, B and C) of the Metropolitan Area of Buenos Aires.
0 5 10 15 20 25
0 1 2 3 4 5 6 7 8 9
10 11 12 13 14 15
>1
5
Interruptions / semester
C u st o m e rs [ % ]
A. SAIFI = 3.24 B. SAIFI = 2.59 C. SAIFI = 3.85
Figure 4. Interruption rates per Utility. Three year results.
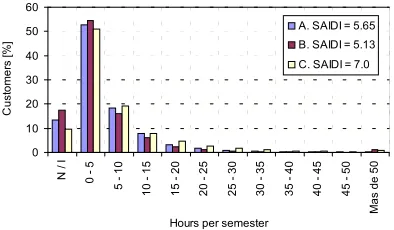
In a similar way, Figure 5 compares the statistics of rates of unavailability between the three Utilities.
0 10 20 30 40 50 60 N / I 0 5 5 10 10 15 15 20 20 25 25 30 30 35 35 40 40 45 45 50 M as de 50
Hours per semester
C us tom er s [ % ]
A. SAIDI = 5.65
B. SAIDI = 5.13
C. SAIDI = 7.0
Figure 5. Unavailability per Utility. Three year results.
QUALITY INDICATORS FROM SAMPLING
Obtaining the field information
The VER are installed in customer addresses, selected from the Customer-Network connectivity data bases, sent each semester to the Regulatory Agency by the Utilities.
The installation strategy of the VER intends to discard recorded events not arising from the network.
To this end, the supply points are selected in couples according to the facilities that are desired to audit. For example, at LV level network (supplies connected to the same LV feeder or transformer MV/LV) or at MV level network (supplies originating from different MV/LV transformers, but tied to the same MV feeder).
In this way, networks of different voltage levels can be controlled, according to the implemented case.
The normal use of the data obtained with VER is to detect errors or omissions in Utility reports as it is explained in [4].
Information processing
Processed information for the three Utilities of Buenos Aires Metropolitan Area comprises the period from October 1997 to
-C
C
I
I
R
R
E
E
D
D 17
th International Conference on Electricity Distribution Barcelona, 12-15 May 2003February 2002.
In order to obtain the indicators of technical quality service for users, the data obtained in field are processed to validate the events detected by the equipment.
All the events registered by the VER over the networks of the three Utilities are considered. Each event is associated to a semester of control, based on the hour of beginning.
Determination of indicators of Technical Service Quality
The processing that is described was carried out for the three Utilities, calculating the defined indicators.
The statistical processing of the amounts of interruptions registered per user and per semester, for all Buenos Aires, produced the results indicated in Figures 6 and 7.
0 2 4 6 8 10 12 14 16 18 20
0 2 4 6 8
10 12 14
>1
5
Interruptions / semester
C
us
tom
er
s
[
%
]
[image:3.595.317.531.158.296.2]Sampling: SAIFI = 4.2 Administr.: SAIFI = 3.0
Figure 6. SAIFI. Comparison results.
[image:3.595.63.281.274.419.2]Both figures compare the results of the interruption rates informed by the Utilities (Figure 1) with the obtained ones by the sampling method. It is observed that the reported rates are lower than the obtained ones by the direct sampling.
Figure 7 shows that the number of customers whose service quality is worse than, for example, 6 interruptions per semester is 10%, according to the information to control. On the other hand, data obtained from the sampled locations, indicate that the users with such bad quality are 25% of the total.
0 10 20 30 40 50 60 70 80 90 100
0 2 4 6 8
10 12 14
> 1
5
Interruptions / Semester
C
u
st
o
m
er
s
[
%
] Sampling
[image:3.595.313.532.454.592.2]Administr.
Figure 7. SAIFI. Comparison results.
Figure 8 shows the ratio between SAIFI obtained from the official data reported by Utility B, and SAIFI obtained by sampling measurements. It can be observed that both evaluations adjust within acceptable margins in the successive periods. This indicates that, at least, both sources are coherent.
0,0 1,0 2,0 3,0 4,0 5,0
1 2 3 4 5 Semester
Ra
te
0,0 0,5 1,0 1,5 2,0 2,5
Ra
ti
o
SAIFI (sampling) SAIFI Ratio
Figure 8. Utility B. Evaluation of SAIFI.
An example of the pursuit of SAIDI obtained as statistic average values, for Utility A is indicated in Figure 9.
In this case the ratio between SAIDI values obtained by sampling measurements and the official data reported by Utility A is not constant along the successive periods of control. Such pattern indicates that the sample is not representative of the universe, which would be expected due to both, the size of the sample (100 items in this case) and the errors of the interruption reports made by the Utility.
0 2 4 6 8 10 12 14 16
1 2 3 4 5 Semester
H
o
u
rs /
sem
e
st
e
r
0,0 0,2 0,4 0,6 0,8 1,0 1,2 1,4 1,6
Ra
ti
o
[image:3.595.65.272.595.731.2]SAIDI (Sampling) SAIDI Ratio
Figure 9. Utility A. Evaluation of SAIDI.
COMMENTS AND CONCLUSIONS
The work presented here to evaluate indices of technical service quality can be considered as an advance in the use of techniques of control of Technical Service Quality by sampling measurements.
The objective of the sampling is to offer direct and representative information of the quality to the Authority, in order to judge the results reported by the Utilities, evaluated by themselves over the universe of their users.
-C
C
I
I
R
R
E
E
D
D 17
th International Conference on Electricity Distribution Barcelona, 12-15 May 2003From the sampling measurements global indicators, that would be representative of indicators evaluated over the universe of users, can be obtained.
A greater experience is necessary to suitably correlate the results of the sampling with those obtained by the conventional method of administration of the interruptions occurred in the network and their assignment to the users taking into account the electrical connectivity.
The sample size does not have to be lower than 300 items per layer (being this one either all the network, or a voltage level, or a geographic zone, etc).
The control by sampling measurements has an immediate application in the verification carried out by the Authority of the interruption reports made by Utilities.
At present the procedure of control in the Metropolitan Area of Buenos Aires consists of the verification that each measured interruption longer than three minutes have been reported [5].
The statistical treatment - the approach of this article - is a complementary application and it can be useful to sustain decisions of the Authority, based on numerical calculations, in front of apartments in the results. The case presented above in which it was inferred that the percentage of users with bad quality was 25% and not 10%, is an example of that.
REFERENCES
[1] Ente Nacional Regulador de la Electricidad (ENRE).
Contratos de Concesión de los Servicios de Distribución Eléctrica del Área Metropolitana de Buenos Aires, Argentina. Subanexo 4. Normas de Calidad del Servicio Público y Sanciones.
[2] Ente Nacional Regulador de la Electricidad (ENRE).
“Resolución ENRE 0527/1996”. Boletín Oficial N°
28.480, 17 de septiembre de 1996, p. 22.
[3] Ente Nacional Regulador de la Electricidad (ENRE).
“Resolución ENRE 0002/1998”. 7 de enero de 1998.
[4] J. Martínez, A. Galinski , P.E. Issouribehere y J.C.
Barbero. “Interrupciones breves en los Servicios de Distribución en el Área Metropolitana de Buenos Aires”.
Congreso CIER 2000 organizado por la Comisión de Integración Eléctrica Regional (CIER), Buenos Aires, 27-29 de Noviembre de 2000.
[5] J.L. Martínez, L.D. Mazzeo, G.A. Ingani, P.E.
Issouribehere, J.C. Barbero. “Control procedure of electrical service quality (supply continuity) provided by Buenos Aires Metropolitan Area Utilities with event
recorders”. Congreso Internacional de Distribución
Eléctrica, CIDEL 2002. Buenos Aires, Argentina, 3-5 Diciembre 2002.