1
First European Conference on Earthquake Engineering and Seismology
(a joint event of the 13th ECEE & 30th General Assembly of the ESC)
Geneva, Switzerland, 3-8 September 2006 Paper Number: 1036
DAMAGE DETECTION IN BUILDINGS WITHOUT BASELINE MODAL
INFORMATION
Ramsés RODRÍGUEZ1, J. Alberto ESCOBAR2 and Roberto GÓMEZ3
SUMMARY
In this paper, the Enhanced Stiffness-Mass Ratios Method, ES-MRM, used to calculate the undamaged state of buildings with shear or flexural-beam behaviour is presented. This method utilizes modal information from the damaged state of the structure and the first storey lateral stiffness value of the structure without damage to determine its baseline modal information. In order to localize and calculate damage magnitude, the determined undamaged or baseline state of the structure is compared with the damaged one. Damage is defined in terms of loss of stiffness. It is demonstrated that the ES-MRM produces exact results for shear buildings with constant stiffness-mass ratios distribution at every storey. Several case studies are presented and discussed and the feasibility of the method to detect damage in buildings, when baseline modal parameters are not available, is corroborated.
1. INTRODUCTION
In order to detect damage in buildings, both, undamaged and damaged states are needed to be compared. These states can be obtained through the dynamic response of the system. However, it is very common that only information from the damaged structure is known or available. Therefore, a baseline state is needed using only information from the building with damage.
Stubbs and Kim [Stubbs and Kim, 1996] presented an iterative sensitivity based method to calculate baseline modal parameters from a structure, however, based on initial conditions, the algorithm may or may not converge. Kharrazi et al. [Kharrazi, Ventura, Brincker and Dascotte, 2000]applied sensitivity techniques to adjust a mathematical model using experimental measurements. On the other hand, the Stiffness-Mass Ratios Method, S-MRM, [Barroso and Rodríguez, 2004], can be utilized to obtain the baseline state of shear buildings using modal information from the damaged structure. A disadvantage of this method is that only can determine damage per storey and not in every structural element. Consequently, damage magnitude is not calculated.
In this paper, the proposed Enhanced Stiffness-Mass Ratios Method, ES-MRM, is presented. This method identifies the baseline state of buildings using information from the damaged structure and the first storey lateral stiffness value of the structure without damage. The identified undamaged state is compared with the damaged one in order to localize damage in every structural element and its corresponding magnitude applying the Damage Submatrices Method, DSM, [Rodríguez and Escobar, 2005].
1
Instituto de Ingeniería, UNAM, Ciudad Universitaria, Coyoacan 04510, México, D. F.
Tel: 5623 8408, Email:rrodriguezro@iingen.unam.mx 2
Instituto de Ingeniería, UNAM, Ciudad Universitaria, Coyoacan 04510, México, D. F.
Tel: 5623 3612, Fax: 5622 3468, Email:jess@pumas.iingen.unam.mx 3
Instituto de Ingeniería, UNAM, Ciudad Universitaria, Coyoacan 04510, México, D. F.
The ES-MRM is exact for shear buildings with constant stiffness-mass ratios distribution at every storey. In this work, the damage detection methodology is applied to plane frames of buildings with and without shear beam behaviour and to a two-storey three-dimensional structure.
2. ENHANCED STIFFNESS-MASS RATIOS METHOD
In order to obtain the undamaged state of buildings with shear or flexural-beam behaviour, without baseline modal parameters, the Enhanced Stiffness-Mass Ratios Method, ES-MRM, is presented. The original version of the method, called Stiffness-Mass Ratios Method, S-MRM, [Barroso and Rodríguez, 2004] determines a baseline or reference (without damage) state of shear buildings only using frequencies and mode shapes from the damaged structure and the lateral stiffness of any storey. This baseline state of the structure is compared against the damaged state of the structure in order to localize and determine magnitude of damage at every storey of the shear building. The proposed ES-MRM localizes and determines magnitude of damage for every structural element of buildings with shear or flexural behaviour. Similarly to the S-MRM, the proposed method herein utilizes frequencies and mode shapes from the damaged building and the lateral stiffness of the first storey.
The S-MRM utilizes modal parameters of shear buildings withsnumber of storeys and inumber of mode shapes (i=1,2,...,s). Natural frequencies ωand their corresponding mode shapes
[ ]
φ can be extracted from dynamic measurements via signal processing. Lateral stiffness[ ]
K and mass[ ]
M matrices are unknown and of the sizesxs
, this is:[ ]
sxs s 3 2+ 2 2 1 k symmetric 0 k k k 0 0 k +k k K ⎥ ⎥ ⎥ ⎥ ⎦ ⎤ ⎢ ⎢ ⎢ ⎢ ⎣ ⎡ − − = M O 3 (1)[ ]
sxs s m symmetric m m M ⎥ ⎥ ⎥ ⎥ ⎦ ⎤ ⎢ ⎢ ⎢ ⎢ ⎣ ⎡ = M O 0 0 0 0 0 2 1 (2)The eigen value problem equation, whose solution yields modal parameters of the system, is:
[ ] [ ]
[
K −ω
2 M]
[ ] [ ]
φ
= 0 (3)Substituting eqs. (1), (2) and modal parameters ω12and
[ ]
φs1 of the structure in eq. (3), havingksandmsas unknown, a system of linear equations is obtained:⎥ ⎥ ⎥ ⎥ ⎦ ⎤ ⎢ ⎢ ⎢ ⎢ ⎣ ⎡ = ⎥ ⎥ ⎥ ⎥ ⎦ ⎤ ⎢ ⎢ ⎢ ⎢ ⎣ ⎡ ⎥ ⎥ ⎥ ⎥ ⎥ ⎦ ⎤ ⎢ ⎢ ⎢ ⎢ ⎢ ⎣ ⎡ ⎥ ⎥ ⎥ ⎥ ⎦ ⎤ ⎢ ⎢ ⎢ ⎢ ⎣ ⎡ − ⎥ ⎥ ⎥ ⎥ ⎦ ⎤ ⎢ ⎢ ⎢ ⎢ ⎣ ⎡ − − 0 0 0 0 0 0 0 0 1 21 11 2 1 2 1 3 M M M O M O s s s 3 2+ 2 2 1 m symmetric m m k symmetric 0 k k k 0 0 k +k k φ φ φ
ω (4)
Performing matrix operations, eq. (4) is explicitly written as:
(5)
(
)
(
)
(
)
00 0 0 1 1 1 1 2 1 1 1 1 31 3 21 2 2 1 3 2 11 2 21 2 11 1 2 1 2 1 = − − + + − = = − − + + − = − − + + + +
−, i i i i i i ,
i
i k k m k
3
Dividing each linear equation (eq. 5) by mi andφi1, a system of equations in terms of unknown stiffness-mass ratios,
i i
m k
, is obtained. Factoring these ratios, the system of equations can be expressed as:
[ ][ ] [ ]
A1 u = b1 (6)where matrix
[ ]
A1 contains coefficients in terms of the first mode shape of the structure,[ ]
u is a vector ofunknown ratios, and
[ ]
b1 is a vector with squared natural frequencies for the first mode. This is,[ ]
(
2 1)
1 1 1 1 1 1 1 1 1 21 31 21 11 11 21 1 1 0 1 1 0 0 0 0 0 0 0 1 1 0 0 0 0 0 0 1 1 − − + − ⎥ ⎥ ⎥ ⎥ ⎥ ⎥ ⎥ ⎥ ⎥ ⎥ ⎥ ⎥ ⎥ ⎥ ⎦ ⎤ ⎢ ⎢ ⎢ ⎢ ⎢ ⎢ ⎢ ⎢ ⎢ ⎢ ⎢ ⎢ ⎢ ⎢ ⎣ ⎡ ⎟ ⎟ ⎠ ⎞ ⎜ ⎜ ⎝ ⎛ − ⎟ ⎟ ⎠ ⎞ ⎜ ⎜ ⎝ ⎛ − ⎟ ⎟ ⎠ ⎞ ⎜ ⎜ ⎝ ⎛ − ⎟⎟ ⎠ ⎞ ⎜⎜ ⎝ ⎛ − ⎟⎟ ⎠ ⎞ ⎜⎜ ⎝ ⎛ − ⎟⎟ ⎠ ⎞ ⎜⎜ ⎝ ⎛ − = s sx , s , s , i , i , i , i symmetric A φ φ φ φ φ φ φ φ φ φ φ φ M O K K O K K (7)
[ ]
(
2 1)
1 1 2 2 1 2 1 1 x s T s s i i i i m k m k m k m k m k m k u − + ⎥ ⎥ ⎦ ⎤ ⎢ ⎢ ⎣ ⎡ ⎟⎟ ⎠ ⎞ ⎜⎜ ⎝ ⎛ ⎟⎟ ⎠ ⎞ ⎜⎜ ⎝ ⎛ ⎟⎟ ⎠ ⎞ ⎜⎜ ⎝ ⎛ ⎟⎟ ⎠ ⎞ ⎜⎜ ⎝ ⎛ ⎟⎟ ⎠ ⎞ ⎜⎜ ⎝ ⎛ ⎟⎟ ⎠ ⎞ ⎜⎜ ⎝ ⎛= K K (8)
[ ]
[
]
1 2 1 2 1 2 2 1 2 1 1 1 sx T s , i , , ,b = ω ω L ω L ω (9)
Repeating the substitution process forω and
[ ]
φ , an overdetermined system of equations is obtained whose size iss2xs:
[ ][ ] [ ]
A u = b (10)Eq. (10) can be solved as:
[ ] [ ] [ ]
u =[
AT A]
−1[ ] [ ]
AT b (11)where
[ ]
A contains submatrices[ ]
Ai corresponding to the i-th mode shape. Similarly,[ ]
b contains submatrices[ ]
bi with squared natural frequencies values.Once the solution vector
[ ]
u is calculated, it is equated with eq. (8) and the lateral stiffness value of the first storey,k1, is substituted in the same equation. The remaining kiandmiare calculated using back substitution. These parameters correspond to the baseline or reference state of the shear structure.However, using the baseline state identified by the S-MRM, just damage location per storey is determined. In addition, this method is just applicable to shear buildings and estimation of damage at every structural element is not obtained. In order to solve these limitations, the ES-MRM is developed herein.
=∑
3 1
1 1 12
h EI
k (12)
Substituting k1into eq. (13), some parameters pi are obtained using back substitution in eq. (8) as: p1=k1
(
)
(
)
3 2 1
5 4 2 1
5 4 1
u u p k
u u p p
u u p
p
i i
i i
j j ) j ( i j i
− − −
+ + + − −
= = =
M M
(13)
For j=2,3,...,(i−2)
Once every kiis known, the lateral stiffness matrix of the structure without damage,
[ ]
K , is calculated using eq. (1). In order to calculatemi, m1is utilized in eq. (13) instead of usingk1. These miare substituted in eq. (2) to obtain the mass matrix of the structure[ ]
M .The former approach was applied to buildings without shear beam behaviour and it was observed that an approximated mass matrix
[ ]
Ma is obtained which differs in magnitude to[ ]
M . The difference is null ifk1isc k1
, where cis a coefficient that adjust shear to flexural behaviour and it was found to correspond to the greatest eigenvalue of
[ ][ ]
M Ma−1. Thus, when the adjustment byc k1
, for structures without shear beam behaviour, is performed, the ES-MRM provides its undamaged state
[ ]
K .Simultaneously, a mathematical model of the structure is created considering connectivity and geometry of its structural elements and a unit elasticity modulus. Thus, approximated stiffness matrices
[ ]
kai for each element are obtained. The global approximated stiffness matrix of the structure is:(14)
According to Escobar et al. [Escobar, Sosa and Gómez, 2005],
[ ]
Ka can be condensed to obtain[ ]
Ka using the transformation matrix[ ]
T as:[ ]
Ka =[ ] [ ][ ]
TT Ka T (15) where[ ]
[ ]
[
] [
]
⎥⎥ ⎥⎦ ⎤
⎢ ⎢ ⎢
⎣ ⎡
− =
−
21 1 22 Ka
Ka I
T
For: (16)
[ ]
Ka =∑[ ]
kai[ ] [
[
] [
] [
]
]
⎥ ⎦ ⎤ ⎢⎣ ⎡ =
22 21
12 11
Ka Ka
Ka Ka
5
For a shear beam building, eqs. (1) and (15) just differ on material properties, specifically, on the magnitude of the elasticity modulus that can be represented using the matrix
[ ]
P as:[ ]
K =[ ]
P[ ]
Ka (17)Solving
[ ]
P from eq. (17):[ ]
=[ ][ ]
−1a K K
P (18)
On the other hand, stiffness matrices for each structural element of the undamaged state of the structure are calculated as:
[ ] [ ]
ki =Pkai (19)wherePis a scalar that adjusts the material properties of the structure from the proposed model. This scalar is obtained as the average of the eigenvalues of the matrix
[ ]
P , eq. (18). Eigenvalue computations are performed because are useful to obtain characteristic scalar values of a matrix, in this case of[ ]
P . It was found that the average of these eigenvalues is preciselyP.Once the undamaged state of the structure, represented by
[ ]
ki , is identified, it is compared against the stiffness matrix of the damaged structure,[ ]
Kd , using the Damage Submatrices Method, DSM, [Rodríguez and Escobar, 2005]. This method is applied to locate and determine magnitude of damage, in terms of loss of stiffness, in percentage,x, at every structural element.3. EXAMPLES
Applications of the proposed ES-MRM to several structures are presented for the case when baseline modal parameters are unknown. The studied structures are plane frames of buildings with and without shear beam behaviour and a two-storey three-dimensional structure.
3.1 Two-storey plane frame with shear beam behavior
A simplified configuration of a two-storey plane frame with shear beam behavior is presented in Figure 1.
m2 k2
m1 k1
Figure 1: Model of a two-storey plane frame with shear beam behavior
The proposed ES-MRM was applied to this structure in order to calculate its undamaged state using information of the damaged structure. Damage was simulated at the second storey with percentages of degradation of stiffness from 10% to 90% at intervals of 10%. The DSM was utilized to calculate damage magnitude.
Figure 2 shows the relative error values between k2(baseline state), calculated with the ES-MRM, and simulated for different relationships
1 2
s s
, where,
2 2 2
m k s = and
1 1 1
m k s= .
1 2
s s
It can be observed in Figure 2, that whens2=s1the ES-MRM is exact, in other words, when stiffness-mass ratios are constant in elevation. Also, when
1 2
s s
varies from 0.9 to 1.1 (10% of variation between stiffness-mass relationships per storey) k2was calculated, using the proposed method, with relative error values smaller than 10%.
Figure 2: Relative error values between calculated and simulated undamaged state (k2), using the ES-MRM. Two-storey plane frame with shear beam behavior
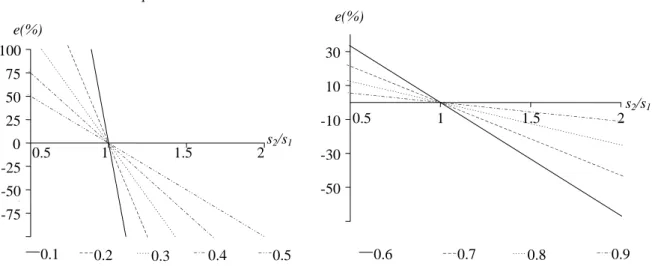
Figure 3 shows the relative error values between calculated and simulated damage magnitude,x2, using the
DSM, with respect to
1 2
s s
.
Figure 3: Relative error values between calculated and simulated damage magnitude,x2, using the DSM.
Two-storey plane frame with shear beam behavior -60
-40 -20 0 20 40 60 80 100 120
0.5 1 1.5 2 2.5
s2/s1
e(%)
-75 -50 -25 0 25 50 75 100
0.5 1 1.5 2
-50 -30 -10 10 30
0.5 1 1.5 2
e(%)
s2/s1
0.1 0.2 0.3 0.4 0.5 0.6 0.7 0.8 0.9
e(%)
7
It can be observed in Figure 3 that for constant stiffness-mass relationships
(
s2=s1)
, degradation of damage was calculated exactly using the DSM. In addition, the slope of the curves decreases as the magnitude of damage increases. This means, that damage was calculated more exactly for degradations of stiffness greater than 50% than for degradations smaller than 50%. Figure 3 also gives information about maximum and minimum variation of1 2
s s
to obtain relative error values, between calculated and simulated damage magnitude, smaller than 10%.
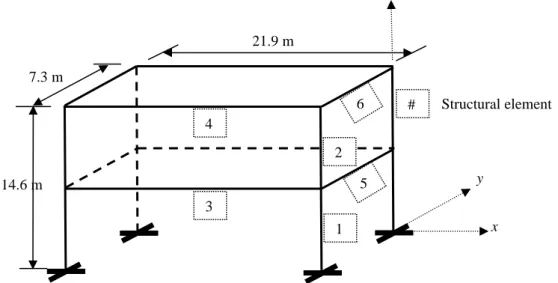
3.2 Two-storey three-dimensional structure
The proposed model of Sohn and Law [Sohn and Law, 1997] presented in Figure 4, was studied with the purpose of evaluating the ES-MRM to determine baseline states of three-dimensional structures. Structural element properties are:E=20.7 GPa, I=8324cm4, J=4140.2 cm4, A=161.3 cm2[Sohn and Law, 1997]. Number of structural elements are also shown in Figure 4. Four damage cases were studied (Table 1) reducing stiffnesses of the three-dimensional structure elements. The DSM was applied to calculate damage magnitudes whose results are also presented in Table 1.
Figure 4: Two-storey three-dimensional structure
It can be observed in Table 1 that the greatest relative error value (3.6%), between calculated and simulated damage magnitudes, correspond to the smaller damage magnitude analyzed (20%). In general, these relative error values decreased as the damage magnitude increased. The proposed methodology identified damage magnitudes with relative error values smaller than 4% for all studied damage cases. Finally, it can be observed that all relative error values are positive, this means that damage was overestimated. This is convenient in terms of safety of the structure.
Table 1: Calculated damage magnitudes and relative error values. Two-storey three-dimensional structure Damage
case
Damaged element
Simulated damage
(%)
Calculated damage
(%)
Relative error value (%)
1 2 60 60.3 0.5
2 4 20 20.7 3.6
3 1 40 40.5 1.3
4 20 20.7 3.6
4 1 50 50.4 0.8
2 45 45.4 1.0
3 60 60.3 0.5
4 55 55.3 0.7
5 40 40.5 1.3
6 30 30.6 2.0
z
y
x
14.6 m
21.9 m 7.3 m
1 2
3 4
5
8 @ 3750 mm
4150 mm
3420 mm
3000 mm
4 @ 9000 mm
10 9 8 7 6
5 4 3 2
1 G
1 3 5
22 23 24
36 37 38 39 40
46 48 50
7 8 9 55 56 57 58
4950 mm
3.3 Ten-storey plane frame
The ES-MRM was applied to a ten-storey plane frame, Figure 5, which belonged to the STC (Mass Transportation System Authority) in Mexico City. This concrete building was stroked by the September 19, 1985, Mexico City earthquake, and demolished afterwards. An interior plane frame shown in Figure 5a was analyzed. The structural element properties are: beams 400x900mm; columns axes A and E, all storeys, 500x900mm; along axes B, C and D, storeys 1 and 2, 500x900mm; storeys 3 and 4, 500x800mm; storeys 5 and 6, 500x700mm; storeys 7 to 10, 500x600mm. Weights: floors 1 to 9, 1451kN; floor 10, 1161kN. Elasticity modulus: E=14.7GPa. Figure 5b shows the number of structural elements.
A B C D E
a) Configuration b) Number of structural elements Figure 5: Ten-storey plane frame
Simulated damage cases are presented in Table 2 [Escobar Sosa and Gómez, 2005] and analyzed using the proposed ES-MRM and the DSM to detect damage. Damage cases 1 and 2 involve stiffness degradation in the first and tenth storeys, respectively. Damage case 3 studies damage in beams and columns at different storeys. Table 2 presents calculated damage magnitudes and relative error values with respect to simulated ones.
It can be observed in Table 2, that damage magnitudes calculated using the proposed methodology with relative error values smaller than 7%. Similarly to the two-storey three-dimensional structure, damage magnitude was overestimated. In addition, the ES-MRM is more exact when degradation of stiffness approximates to 100% and less exact when approximates to 0%.
Table 2: Calculated damage magnitudes and relative error values. Ten-storey plane frame Damage
case Damaged element
Simulated damage
(%)
Calculated damage
(%)
Relative error value (%)
1 1 80 85.4 6.8
3 85 89.1 4.8
5 90 92.7 3.0
2 46 80 85.2 6.5
48 85 88.9 4.5
50 90 92.6 2.9
3 1, 5 60 63.4 5.6
7, 8, 9 80 81.9 2.4
22, 23, 24 90 90.8 0.9
36, 37, 38, 39, 40 85 86.3 1.5
9
4. CONCLUSIONS
The enhanced stiffness-mass ratios method, ES-MRM, was presented. This method calculates the baseline or reference state of buildings using modal information of the structure with damage and the lateral stiffness value of the first storey of the structure without damage. This identified undamaged state was compared with the damaged one using the Damage Submatrices Method, DSM, to locate and determine magnitude of damage at every structural element. The described methodology was applied to a two-storey plane frame with shear beam behaviour, two-storey three-dimensional structure and to a ten-storey plane frame.
The ES-MRM provided exact results for shear beam plane frames when the stiffness-mass relationships are constant in elevation. When these relationships per storey vary from 0% to 10%, the proposed method determines the baseline of the building with relative error values smaller than 10%.
For the ten-storey plane frame and the two-storey three-dimensional structure, the presented methodology identified damage magnitudes with small relative error values as the degradation of stiffness increased. For these two structures in particular, relative error values for damage detection were smaller than 7%.
5. REFERENCES
Barroso, L. and Rodríguez, R. (2004), Damage Detection of a Benchmark Structure without Baseline Information, ASCE Journal of Engineering Mechanics, 130, n° 2, 142-151.
Escobar, J.A., Sosa, J.J. and Gómez, R. (2005), Structural Damage Detection Using the Transformation Matrix,
Computers and Structures, 83, 357-368.
Kharrazi, M.H.K., Ventura, C.E., Brincker, R. and Dascotte, E. (2000), A Study on Damage Detection Using Output-Only Modal Data, Proceedings of the 20th International Modal Analysis Conference, Los Angeles, California.
Rodríguez, R. and Escobar, J.A. (2005), Detección de Daño en Edificios Utilizando Submatrices de Daño, XV Congreso Nacional de Ingeniería Sísmica,Ciudad de México, México.
Sohn, H. and Law, K.H. (1997), A Bayesian Probabilistic Approach for Structure Damage Detection,
Earthquake Engineering and Structural Dynamics, 26, 1259-1281.
Stubbs, N. and Kim, J. (1996), Damage Localization in Structures Without Baseline Modal Parameters,