Transient Elastography vs. Aspartate Aminotransferase
to Platelet Ratio Index in Hepatitis C: A Meta-Analysis
Ângelo Zambam de Mattos,*,** Angelo Alves de Mattos***
* Pontifical Catholic University of Rio Grande do Sul, Brazil. ** Municipal Health Department of Porto Alegre, Brazil. *** Post-Graduation Course of Hepatology of the Federal University of Health Sciences of Porto Alegre, Brazil.
May-June, Vol. 16 No. 3, 2017: 349-357
INTRODUCTION
Chronic hepatitis C (CHC) is a major public health is-sue, affecting over 174 million people worldwide, leading to cirrhosis and hepatocellular carcinoma and being the most frequent cause of liver transplantation in many coun-tries.1 Recently, direct-acting antiviral drugs have
revolu-tionized the treatment of CHC, allowing patients to reach sustained virological response in around 90% of cases. Nevertheless, these treatments are extremely expensive, which has caused widespread concern.1-4
Currently, treatment is recommended for all patients with CHC, but, if resources limit the possibility of treat-ing everyone, patients with advanced fibrosis or cirrhosis (METAVIR stages F3 and F4) should be prioritized.5,6 Yet,
when the cost-effectiveness of treating patients with early stages of fibrosis was specifically evaluated, one study
de-mostrated that treatment was cost-effective mainly for pa-tients with METAVIR stage F2 or worse,4 and the other
showed that treating patients with METAVIR stage F2 or greater was highly cost-effective and that treating patients with METAVIR stage F1 was borderline cost-effective.3
The above mentioned demonstrates the importance of staging liver fibrosis in patients with CHC.
Liver biopsy is the reference standard for staging fibro-sis. Even though, it has several limitations: it is an invasive procedure, carrying a risk of rare, but severe complica-tions; there could be sampling error and interobserver variability; it is costly; it is poorly accepted by many pa-tients, especially when it is recommended for long term follow-up. These limitations have led to the development of invasive methods for staging fibrosis. Many non-invasive methods have been studied with this purpose, and liver stiffness measurement through transient elastography The Official Journal of the Mexican Association of Hepatology,
the Latin-American Association for Study of the Liver and the Canadian Association for the Study of the Liver
Manuscript received: Manuscript received:Manuscript received:
Manuscript received:Manuscript received: July 08, 2016. Manuscript accepted:Manuscript accepted:Manuscript accepted:Manuscript accepted:Manuscript accepted: October 04, 2016.
DOI:10.5604/16652681.1235477
A B S T R A C T A B S T R A C T A B S T R A C T A B S T R A C T A B S T R A C T
Background and rationale. Background and rationale.Background and rationale. Background and rationale.
Background and rationale. Many different non-invasive methods have been studied with the purpose of staging liver fibrosis. The objective of this study was verifying if transient elastography is superior to aspartate aminotransferase to platelet ratio index for staging fibrosis in patients with chronic hepatitis C. Material and methods.Material and methods.Material and methods.Material and methods.Material and methods. A systematic review with meta-analysis of studies which evaluated both non-invasive tests and used biopsy as the reference standard was performed. A random-effects model was used, anticipating heterogeneity among studies. Diagnostic odds ratio was the main effect measure, and summary receiver operating characteristic curves were created. A sensitivity analysis was planned, in which the meta-analysis would be repeated excluding each study at a time. Results.Results.Results.Results.Results. Eight studies were included in the meta-analysis. Regarding the prediction of significant fibrosis, transient elastography and aspartate aminotransferase to platelet ratio index had diagnostic odds ratios of 11.70 (95% confidence interval = 7.13-19.21) and 8.56 (95% confidence interval = 4.90-14.94) respectively. Concerning the prediction of cirrhosis, transient elastogra-phy and aspartate aminotransferase to platelet ratio index had diagnostic odds ratios of 66.49 (95% confidence interval = 23.71-186.48) and 7.47 (95% confidence interval = 4.88-11.43) respectively. Conclusion.Conclusion.Conclusion.Conclusion. In conclusion, there was no evidence ofConclusion. significant superiority of transient elastography over aspartate aminotransferase to platelet ratio index regarding the prediction of sig-nificant fibrosis, but the former proved to be better than the latter concerning prediction of cirrhosis.
Key words. Key words.Key words. Key words.
(TE) and aspartate aminotransferase (AST) to platelet ratio index (APRI) are probably two of the most frequently used.7
Performing TE requires an expensive equipment, which is not widely available, especially in developing countries. On the other hand, calculating APRI is easy and it involves parameters which are already part of the rou-tine workup of CHC patients, thus not implying new costs to the management of such patients. Therefore, the objective of the present study is to verify if TE is superior to APRI for staging liver fibrosis in patients with CHC through a systematic review with meta-analysis.
MATERIAL AND METHODS
In order to evaluate if TE is superior to APRI for stag-ing liver fibrosis in patients with CHC, a systematic re-view and meta-analysis of studies was performed. MEDLINE, EMBASE and Cochrane Database of System-atic Reviews databases were searched by two independent researchers (AZM and AAM) between August 25th and September 8th, 2015. The search strategy used in MEDLINE was the following: "Hepatitis C" or "HCV" and "Elasticity Imaging Techniques" or "Elastography" or "Fibroscan" and "AST to Platelet Ratio Index" or "APRI" and "Liver Biopsy". Similar search strategies were used in the other databases. Reference lists of the retrieved studies were hand searched.
Retrieved studies were evaluated based on their titles and abstracts, and those identified as relevant for the present systematic review were analyzed based on their full-text. Studies were considered eligible if they evaluat-ed adult patients with CHC and comparevaluat-ed staging of liver fibrosis determined by TE and by APRI to the results ob-tained by liver biopsy (reference standard). Exclusion cri-teria were the following: studies with patients younger than 18 years of age; studies in which data on patients with CHC were not provided separately from data on patients coinfected with HIV or HBV or from data on patients with liver diseases other than CHC; studies on specific populations of CHC patients (for instance, transplanted patients, patients on dialysis, patients with hemoglobin-opathies or bleeding disorders); studies that did not pro-vide data on all three diagnostic methods (TE, APRI and liver biopsy). Besides, studies written in languages other than English, Portuguese and Spanish were excluded, as well as those published only as abstracts (with no full-text available).
Data extraction was performed by two independent in-vestigators (AZM, AAM), and a predefined data collection sheet was used. Disagreements were resolved by consen-sus. Authors were contacted for clarification of their stud-ies whenever necessary. Quality of evidence was evaluated
according to Quality Assessment of Diagnostic Accuracy Studies-2 (QUADAS-2).8
Regarding the meta-analysis, a random-effects model was used, anticipating a possible heterogeneity among studies. Diagnostic odds ratio (DOR) (with a 95% confi-dence interval - 95% CI) was chosen as the main effect measure, and the DerSimonian-Laird method was used in the analysis. Summary receiver operating characteristic (SROC) curves were created, according to Moses' meth-od. Besides, summary sensitivity, specificity, positive like-lihood ratio (PLR) and negative likelike-lihood ratio (NLR) were also pooled. Statistical significance was set at p < 0.05. Heterogeneity was assessed by the I2 statistic and by
the heterogeneity χ2 test (p < 0.05), as well as by a visual analysis of the forest plots. After data extraction, if any study had a cell with the value of zero, 0.5 was added to every cell of that study in order to make the meta-analysis possible. A sensitivity analysis was planned, in which the meta-analysis would be repeated excluding each study at a time. MetaDiSc 1.4 (Unit of Clinical Biostatistics of the Ramón y Cajal Hospital, Madrid, Spain) and Review Man-ager 5.3 (The Nordic Cochrane Centre, The Cochrane Collaboration, Copenhagen, Denmark) software were used in the analysis. The study protocol was registered in PROSPERO database (CRD42015029838).
RESULTS
The search strategy retrieved 205 references. After analyzing titles and abstracts, 15 studies were excluded for being reviews (not providing original data), 37 for not providing data on at least one of the three required diagnostic methods (TE, APRI and liver biopsy), 67 for addressing a different subject or a different population of patients, 29 for not being published as a full-text pa-per (studies published only as abstracts), two for being published in other languages than those prespecified and 27 for being identical duplicates. Therefore, 28 ref-erences were selected for full-text analysis.9-36 After
full-text evaluation, one study was excluded for ad-dressing a different population of patients than the pre-specified one,9 seven articles were excluded for not
providing data for patients with CHC separately from data for patients with other causes of liver diseases10-16
and 11 studies were excluded for not providing data on at least one of the three required diagnostic methods. 17-27 One study28 was suspected of being a non-identical
duplicate of another.32 An attempt to contact an author
by electronic mail was made in order to clarify this, but there was no answer, and the study with the smaller sample was excluded.28 Finally, eight studies were
in-cluded in the meta-analysis.29-36 The flowchart for the
Table 1. Characteristics of the included studies.
Study (reference) Country Analyzed sample Cut-off for Metavir ≥ F2 Cut-off for Metavir F4
Obara, 200829 Japan 51 APRI ≥ 0.70
-TE ≥ 9.50KPa
Castéra, 200930 France 298 - APRI ≥ 2.00
TE ≥ 12.50KPa
Cobbold, 201031 England 67 APRI ≥ 0.66
-TE ≥ 8.00KPa
Bota, 201132 Romania 212 APRI ≥ 0.50 APRI ≥ 1.00
TE ≥ 6.80KPa TE ≥ 13.30KPa
Crisan, 201233 Romania 446 APRI ≥ 0.44
-TE ≥ 7.90KPa
Zarski, 201234 France 382 APRI ≥ 0.50 APRI ≥ 2.00
TE ≥ 5.20KPa TE ≥ 12.90KPa
Gara, 201335 United States 109 APRI ≥ 0.80
-TE ≥ 8.90KPa
Bonnard, 201536 Egypt 312 APRI ≥ 0.50 APRI ≥ 0.76
TE ≥ 7.80KPa TE ≥ 10.40KPa
Figure 1. Figure 1. Figure 1.
Figure 1. Figure 1. Flowchart for the search strategy. The number of studies re-trieved from each database is shown, as well as the number of included and excluded studies, with the reason for exclusion.
205 studies retrieved MEDLINE - 62 EMBASE - 141 Cochrane - 1 Manual search - 1
20 studies excluded Absent data on any of the tests - 11
Different subject/population - 1 Data of patients with hepatitis C
not provided separately - 7 Non-identical duplicates -1 28 studies evaluated as
full-text for eligibility
8 studies included
177 studies excluded Reviews - 15
Absent data on any of the tests - 37 Different subject/population -67
Not published as full-text - 29 Other languages - 2 Identical duplicates - 27 Seven of the included studies presented data on predic-tion of significant liver fibrosis (METAVIR stages
F2-4).29,31-36 Only one of the included studies presented data
on prediction of advanced liver fibrosis (METAVIR stages F3-4),33 and, therefore, this outcome was not evaluated in
the meta-analysis. According to this study, TE at a cut-off of 9.00KPa had a sensitivity of 69.57%, a specificity of
Figure 2. Figure 2. Figure 2. Figure 2.
Figure 2. Methodological quality summary according to Quality Assess-ment of Diagnostic Accuracy Studies-2 (QUADAS-2).
Risk of Bias Applicability Concerns
Bonnard 2015
Bota 2011 Castera 2009
Cobbold 2010 Crisan 2012 Gara 2013
Obara 2008 Zarski 2012
Patien selection Index test Reference standard Flow and timing Patient selection Index test Reference standard
84.73%, a PLR of 4.56, a NLR of 0.36 and an accuracy of 79.66% for the prediction of advanced liver fibrosis. On the other hand, these values for APRI at a cut-off of 1.69 were 61.40%, 77.47%, 2.73, 0.50 and 72.38% respectively.33
Prediction of liver cirrhosis (METAVIR stage F4) was evaluated by four studies.30,32,34,36 Two studies evaluated the
prediction of Ishak stages 5-6 of fibrosis,31,35 but they were
not pooled together with the other four which evaluated prediction of METAVIR stage F4 in the main analysis be-cause Ishak stage 5 of fibrosis still cannot be considered as established cirrhosis. Table 1 shows the characteristics of the included studies.
Regarding to the evaluation of the quality of the evi-dence according to QUADAS-2, there were high risk of bias and low applicability concerns. Overall, the quality of the evidence was considered to be low. Figure 2 summa-rizes the evaluation of the quality of the evidence.
Concerning prediction of significant liver fibrosis as the outcome, the meta-analysis assessed data on 1,579
pa-tients. The pooled DOR for TE was 11.70 (95%CI = 7.13-19.21), without significant heterogeneity among studies (heterogeneity 2 = 11.92, p = 0.064, I2 = 49.70%). Figure
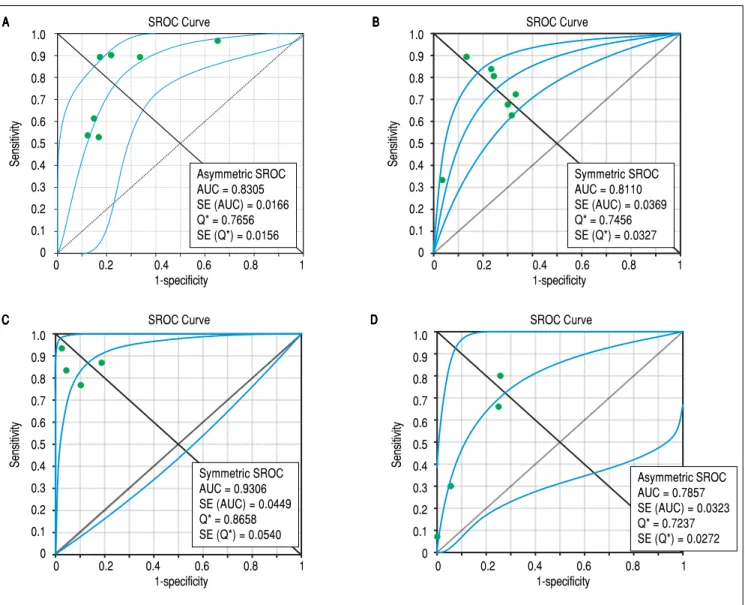
3A presents the forest plot for this analysis. Pooled sensi-tivity, specificity, PLR and NLR are shown in table 2. The analysis of diagnostic threshold suggested a threshold ef-fect (Spearman correlation coefficient = 0.786, p = 0.036). Figure 4A presents the SROC curve for this analysis (area under the curve of 0.83).
Still considering significant fibrosis as the outcome, the pooled DOR for APRI was 8.56 (95%CI = 4.90-14.94), with significant heterogeneity among studies (heterogene-ity χ2=20.07, p=0.003, I2 = 70.10%). Figure 3B presents
the forest plot for this analysis. Pooled sensitivity, specifi-city, PLR and NLR are shown in table 2. The analysis of diagnostic threshold did not demonstrate a threshold ef-fect (Spearman correlation coefficient = -0.143, p = 0.760). Figure 4B presents the SROC curve for this analy-sis (area under the curve of 0.81).
Figure 3. Figure 3. Figure 3. Figure 3.
Figure 3. Forest plots of the random-effects model meta-analyses for the diagnostic odds ratio of transient elastography and aspartate aminotransferase to platelet ratio index, in comparison to liver biopsy, for the prediction of significant liver fibrosis and cirrhosis. A. A. A. A. A. Transient elastography for the prediction of sig-nificant fibrosis. B. B. B. B. Aspartate aminotransferase to platelet ratio index for the prediction of significant fibrosis. C. B. C. C. C. C. Transient elastography for the prediction of cirrhosis. D. D. D. D. D. Aspartate aminotransferase to platelet ratio index for the prediction of cirrhosis. Each study is identified by the name of the first author and year of publication. Circles indicate the diagnostic odds ratios, and their sizes are proportional to the weights of the studies. The horizontal bars refer to the 95% confidence interval (CI) of the diagnostic odds ratios. The vertical line is the equivalence line, where the diagnostic odds ratio is 1. The diamond represents the 95% CI of the pooled diagnostic odds ratio. OR: Odds Ratio. CI: Confidence Interval.
39.58 (7.90-198,31) 16.50 ( 4.56-59.68) 9.04 (2.56-31.90) 8.30 (4.92-14.00) 15.30 (6.45-36.29) 33.49 (9.07-123.67) 5.63 (3.16-10.01) Obara 2008
Cobbold 2010 Bota 2011 Crisan 2012 Zarski 2012 Gara 2013 Bonnard 2015
Random Effects Model Random Effects ModelRandom Effects Model Random Effects Model Random Effects Model
Pooled Diagnostic Odds Ratio = 11.70 (7.13 to 19.21) Cochran-Q = 11.92, df = 6 (p = 0.0638) Inconsistency (I-square) = 49.7% Tau-squared = 0.1996
Diasgnostic OR (95% CI) Diasgnostic OR (95% CI) Diasgnostic OR (95% CI) Diasgnostic OR (95% CI) Diasgnostic OR (95% CI)
A A A A A
0.01 1 100.0
Diagnostic Odds Ratio
Obara 2008 Cobbold 2010 Bota 2011 Crisan 2012 Zarski 2012 Gara 2013 Bonnard 2015
55.56 (10.10-305.61) 16.98 (5.03-57.30) 4.89 (1.79-13.34) 5.21 (3.44-7.91) 13.95 (6.17-31.55) 12.94 (4.62-36.25) 3.67 (2.23-6.02)
Random Effects Model Random Effects Model Random Effects Model Random Effects Model Random Effects Model
Pooled Diagnostic Odds Ratio = 8.56 (4.90 to 14.94) Cochran-Q = 20.07, df = 6 (p = 0.0027) Inconsistency (I-square) = 70.1% Tau-squared = 0.3495
0.01 1 100.0
Diagnostic Odds Ratio
Diasgnostic OR (95% CI) Diasgnostic OR (95% CI)Diasgnostic OR (95% CI) Diasgnostic OR (95% CI)Diasgnostic OR (95% CI)
Castéra 2009 Bota 2011 Zarski 2012 Bonnard 2015
106.00 (42.83-262.36) 495.60 (91.67-2.679.41) 28.41 (13.90-58.06) 28.16 (11.99-66.14)
Random Effects Model Random Effects Model Random Effects Model Random Effects Model Random Effects Model
Pooled Diagnostic Odds Ratio = 66.49 (23.71 to 186.48) Cochran-Q = 13.86, df = 3 (p = 0.0031)
Inconsistency (I-square) = 78.4% Tau-squared = 0.8305
0.01 1 100.0
Diagnostic Odds Ratio
Diagnostic OR (95% CI) Diagnostic OR (95% CI) Diagnostic OR (95% CI) Diagnostic OR (95% CI) Diagnostic OR (95% CI)
0.01 1 100.0
Diagnostic Odds Ratio
Random Effects Model Random Effects ModelRandom Effects Model Random Effects Model Random Effects Model
Pooled Diagnostic Odds Ratio = 7.47 (4.88 to 11.43) Cochran-Q = 2.56, df = 3 (p = 0.4647) Inconsistency (I-square) = 0.0% Tau-squared = 0.0000
Castéra 2009 Bota 2011 Zarski 2012 Bonnard 2015
7.09 (3.32-15.13) 11.49 (4.42-29.83) 25.00 (2.74-228.07) 5.80 (3.08-10.94)
Diasgnostic OR (95% CI) Diasgnostic OR (95% CI) Diasgnostic OR (95% CI) Diasgnostic OR (95% CI) Diasgnostic OR (95% CI)
B B B B B
C C C C
For the prediction of significant fibrosis, there was no evidence of significant difference between TE and APRI for DOR, sensitivity, PLR and NLR. On the other hand, APRI had significantly greater specificity than TE. Both tests had good accuracy, and the area under the SROC curve seemed to be similar between them.
Regarding prediction of cirrhosis as the outcome, the meta-analysis assessed data on 1,204 patients. The pooled DOR for TE was 66.49 (95% CI = 23.71 - 186.48), with significant heterogeneity among studies (heterogeneity
χ2 = 13.86, p = 0.003, I2 = 78.40%). Figure 3C presents the
forest plot for this analysis. Pooled sensitivity, specificity, PLR and NLR are shown in table 2. The analysis of diag-nostic threshold did not show a threshold effect (Spear-man correlation coefficient = -0.400, p = 0.600). Figure 4C presents the SROC curve for this analysis (area under the curve of 0.93).
Still regarding cirrhosis as the outcome, the pooled DOR for APRI was 7.47 (95%CI = 4.88-11.43), without significant heterogeneity among studies (heterogeneity
χ2 = 2.56, p = 0.465, I2 = 0%). Figure 3D presents the
forest plot for this analysis. Pooled sensitivity, specificity, PLR and NLR are shown in table 2. The analysis of diag-nostic threshold suggested a threshold effect (Spearman correlation coefficient = 1.000, p < 0.001). Figure 4D presents the SROC curve for this analysis (area under the curve of 0.78).
For the prediction of cirrhosis, there was no evidence of significant difference between TE and APRI for specif-icity and PLR. On the other hand, TE had significantly better DOR, sensitivity and NLR than APRI. The area un-der the SROC curve was greater for TE, which showed excellent accuracy for the prediction of cirrhosis, while the accuracy of APRI was only fair.
A sensitivity analysis was performed, excluding each study at a time from the meta-analysis. Regarding predic-tion of significant fibrosis as the outcome, only the exclu-sion of the study of Zarski, et al.34 would significantly
change results. Concerning TE, sensitivity would de-crease to 0.60 (95%CI = 0.56-0.63), and specificity would increase to 0.83 (95%CI = 0.79-0.86), while DOR, PLR and NLR would not suffer significant changes. In relation to APRI, sensitivity would increase to 0.70 (95%CI = 0.67-0.73), and specificity would decrease to 0.71 (95%CI = 0.66-0.75), while DOR, PLR and NLR would not suffer significant changes.
Regarding prediction of cirrhosis, the exclusion of nei-ther of the studies would significantly change characteris-tics of TE. On the other hand, concerning APRI, the exclusion of the study by Zarski, et al.34 would decrease
specificity to 0.81 (95%CI = 0.78-0.84), and the exclusion of the study by Bonnard, et al.36 would increase specificity
to 0.92 (95%CI = 0.90-0.94), while the other aspects of the
Table 2.
Pooled diagnostic odds ratio, sensitivity, specificity and positive and negative likelihood ratios of transient elastography a
nd aspartate aminotransferase to platelet
ratio index for the prediction of significant liver fibrosis and cirrhosis.
Test
DOR (95% CI)
Sensitivity (95% CI)
Specificity (95% CI)
PLR (95% CI)
NLR (95% CI)
TE for Metavir
≥ F 2 11.70 (7.13-19.21) 0.67 (0.64-0.70) 0 .67 (0.63-0.71) 3.26 (1.74-6.12) 0.30 (0.20-0.45) Heterogeneity Heterogeneity Heterogeneity Heterogeneity Heterogeneity χ
2 = 11.92, p = 0.064,2
χ
2= 166.81, p < 0.001,
χ
2 = 151.25, p < 0.001,
χ
2 = 99.51, p < 0.001,
χ
2 = 53.10, p < 0.001,
I
2 = 49.70%
I
2 = 96.40%
I
2 = 96.00%
I
2 = 94.00%
I
2 = 88.70%
APRI for Metavir
≥ F 2 8.56 (4.90-14.94) 0.63 (0.60-0.66) 0 .79 (0.76-0.82) 3.15 (2.21-4.50) 0.40 (0.30-0.56) Heterogeneity Heterogeneity Heterogeneity Heterogeneity Heterogeneity χ
2 = 20.07, p = 0.003,
χ
2 = 99.67, p < 0.001,
χ
2 = 75.58, p < 0.001,
χ
2 = 23.08, p = 0.001,
χ
2 = 51.81, p < 0.001,
I
2 = 70.10%
I
2 = 94.00%
I
2 = 92.10%
I
2 = 74.00%
I
2 = 88.40%
TE for Metavir F4
66.49 (23.71-186.48) 0.84 (0.78-0.89) 0 .90 (0.8 8-0.92) 11.17 (5.08-24.59) 0.18 (0.12-0.27) Heterogeneity Heterogeneity Heterogeneity Heterogeneity Heterogeneity χ
2 = 13.86, p = 0.003,
χ
2 = 4.70, p = 0.195,
χ
2 = 42.41, p < 0.001,
χ
2 = 36.99, p < 0.001,
χ
2 = 4.39, p = 0.223,
I
2 = 78.40%
I
2 = 36.10%
I
2 = 92.90%
I
2 = 91.90%
I
2 = 31.60%
APRI for Metavir
F4 7.47 (4.88-11.43) 0.40 (0.34-0.47) 0 .87 (0.85-0.89) 3.46 (2.34-5.12) 0.58 (0.34-0.99) Heterogeneity Heterogeneity Heterogeneity Heterogeneity Heterogeneity χ
2 = 2.56, p = 0.465,
χ
2 = 69.35, p < 0.001,
χ
2 = 143.03, p < 0.001,
χ
2 = 7.78, p = 0.051,
χ
2 = 84.22, p < 0.001,
I
2 = 0.00%
I
2 = 95.70%
I
2 = 97.90%
I
2 = 61.50%
I
test would not suffer significant changes. A sensitivity analysis pooling both studies which evaluated the predic-tion of Ishak stages 5-6 of fibrosis31,35 together with the
studies which evaluated the prediction of Metavir stage F4 did not significantly change the performances of neither TE nor APRI.
DISCUSSION
CHC is a common disease, which can lead to serious complications and death. Recently, very effective new treatments for CHC have been developed, but their costs prevent that every patient is treated in most countries, and it is recommended that those with more severe fibrosis are
Figure 4. Figure 4. Figure 4.
Figure 4. Figure 4. Summary receiver operating characteristic curves on the diagnostic accuracy of transient elastography and aspartate aminotransferase to platelet ratio index for the prediction of significant liver fibrosis and cirrhosis. A. A. A. A. A. Transient elastography for the prediction of significant fibrosis. B. B. B. B. B. Aspartate ami-notransferase to platelet ratio index for the prediction of significant fibrosis. C. C. C. C. C. Transient elastography for the prediction of cirrhosis. D. D. D. D. Aspartate aminotrans-D. ferase to platelet ratio index for the prediction of cirrhosis. SROC: Summary receiver operating characteristic. AUC: area under the curve. SE: standard error.
B B B B B
Sensitivity
SROC Curve
0 0.2 0.4 0.6 0.8 1
1-specificity 1.0
0.9 0.8 0.7 0.6 0.5 0.4 0.3 0.2 0.1 0
Symmetric SROC AUC = 0.8110 SE (AUC) = 0.0369 Q* = 0.7456 SE (Q*) = 0.0327 Asymmetric SROC
AUC = 0.8305 SE (AUC) = 0.0166 Q* = 0.7656 SE (Q*) = 0.0156
Asymmetric SROC AUC = 0.7857 SE (AUC) = 0.0323 Q* = 0.7237 SE (Q*) = 0.0272 Symmetric SROC
AUC = 0.9306 SE (AUC) = 0.0449 Q* = 0.8658 SE (Q*) = 0.0540
Sensitivity
SROC Curve
0 0.2 0.4 0.6 0.8 1
1-specificity 1.0
0.9 0.8 0.7 0.6 0.5 0.4 0.3 0.2 0.1 0
Sensitivity
SROC Curve
0 0.2 0.4 0.6 0.8 1
1-specificity 1.0
0.9 0.8 0.7 0.6 0.5 0.4 0.3 0.2 0.1 0
Sensitivity
SROC Curve
0 0.2 0.4 0.6 0.8 1
1-specificity 1.0
0.9 0.8 0.7 0.6 0.5 0.4 0.3 0.2 0.1 0 A
A A A A
D D D D D C
C C C C
prioritized.5,6 Therefore, staging liver fibrosis remains
We are unaware of other meta-analyses which had eval-uated both these non-invasive methods, including only studies that had compared them head-to-head and that had used liver biopsy as the reference standard. This is impor-tant in order to reduce heterogeneity. Besides, we only considered data on patients with CHC, since it is known that the performance of these methods is different accord-ing to the kind of liver disease. Moreover, this study pre-sented robust results, since most of them were not subject to changes in the sensitivity analyses.
Prediction of significant liver fibrosis probably is the most important outcome to be considered when the objective of the non-invasive tests is defining which pa-tients should be treated for CHC. Even though treat-ment could be recommended for all patients with CHC,5,6 the costs of treatments limit the applicability
of such recommendation, and there are evidences that treating patients with METAVIR stage F2 or worse is highly cost-effective, which certainly should be taken into consideration when deciding what groups of pa-tients will be actually treated.3,4 In this context, the
present study showed that, despite having a good accu-racy, both TE and APRI have sensitivities that seem in-sufficient for them to be used as substitutes for liver biopsy. Yet, if they are used, there is no evidence that TE is superior to APRI, which does not add costs to the routine workup of patients with CHC and is much more widely available than TE.
In a previous systematic review, despite not perform-ing a meta-analysis, authors came to a similar conclusion. They suggested that, in order to differentiate between minimal and significant fibrosis, readily available non-in-vasive tests, such as APRI, could be used for initial evalua-tion, since more sophisticated methods, such as TE, had failed to demonstrate an increased diagnostic perform-ance. These authors also suggested that using multiple non-invasive tests could be beneficial.37
The evaluation of the diagnostic performance of TE and APRI for the prediction of advanced liver fibrosis would also have been interesting since it is recommended for pri-oritizing patients for treatment.5,6 Nevertheless, as there
was only one study which analyzed this outcome,33 it was
not possible to evaluate it in the meta-analysis. On the other hand, considering that recent evidence suggested that treating patients with significant fibrosis probably is the most cost-effective strategy,3,4 we understand that the
fact of not being possible to perform a meta-analysis on ad-vance fibrosis is only a minor limitation of the present study.
Another interesting outcome for the non-invasive tests is the prediction of cirrhosis, because, besides receiving treatment for CHC, cirrhotic patients need to be screened for hepatocellular carcinoma and esophageal varices. With
this aim, TE presented good sensitivity, which is of the ut-most importance in order to reduce the risk of missing pa-tients who should be screened for these complications. Besides, TE had an excellent accuracy for the prediction of cirrhosis. On the other hand, APRI had only a fair accu-racy and, more importantly, it had low sensitivity, which would not allow it to be used to rule out cirrhosis. This might be explained by the findings of a previous meta-analysis, which evaluated exclusively APRI.38 The study
described an area under the SROC curve quite similar to ours (area under the curve of 0.82 - 95%CI = 0.79-0.86), but it evaluated two different cut-off points for cirrhosis separately, showing that the summary sensitivity was 76% for a cut-off point of 1.0 and only 49% for a cut-off point of 2.0.38 Our study verified the presence of a threshold effect
for APRI in the prediction of cirrhosis, which reflects the variation of the performance of the test according to dif-ferent cut-off points.
Many of the analyses performed in the present study demonstrated evidence of heterogeneity among includ-ed studies. As previously mentioninclud-ed, at least in part, this can be associated to the variability of cut-off points used in the different studies for both tests and to the presence of a threshold effect. This variability of cut-off points and the associated variability in the performanc-es of the tperformanc-ests had already been suggperformanc-ested by a previous systematic review, in spite of the absence of a proper meta-analysis in that study.37 In order to better
under-stand the heterogeneity among studies, we performed sensitivity analyses. Nevertheless, these sensitivity anal-yses led only to minor and probably irrelevant changes in the results.
An important limitation of the present study relates to the quality of the available evidence. We chose to include in the meta-analysis only studies which evaluated both tests, TE and APRI, in the same population of patients, comparing them to liver biopsy as the reference standard, in order to decrease risk of heterogeneity among studies and to increase the quality of the evidence. However, stud-ies were considered to have a high risk of bias in many of the evaluated domains. Therefore, according to QUAD-AS-2, the quality of the evidence was considered to be low, and this should be kept in mind when interpreting our findings.
ABBREVIATIONS
• APRI: Aspartate aminotransferase to platelet ratio
in-dex.
• AST: Aspartate aminotransferase.
• AUC: Area under the curve.
• CHC: Chronic hepatitis C.
• CI: Confidence interval.
• DOR: Diagnostic odds ratio.
• NLR: Negative likelihood ratio.
• PLR: Positive likelihood ratio.
• QUADAS-2: Quality Assessment of Diagnostic
Accu-racy Studies-2.
• SROC: Summary receiver operating characteristic.
• TE: Transient elastography.
AUTHORS' CONTRIBUTIONS
Ângelo Z. de Mattos contributed for the study concept and design, acquisition of data, analysis and interpretation of data, drafting of the manuscript, statistical analysis, and approval of the final version of the manuscript. Angelo A. de Mattos contributed for the study design, acquisition of data, analysis and interpretation of data, critical revision of the manuscript for important intellectual content, and ap-proval of the final version of the manuscript.
The present manuscript does not contain previously published material.
CONFLICTS OF INTEREST
None.
GRANTS AND FINANCIAL SUPPORT
None.
REFERENCES
1. Chidi AP, Rogal S, Bryce CL, Fine MJ, Good CB, Myaskovsky
L, Rustgi VK, et al. Cost-effectiveness of new antiviral regi-mens for treatment-naïve U.S. veterans with hepatitis C. Hepatology 2016; 63: 428-36.
2. Najafzadeh M, Andersson K, Shrank WH, Krumme AA,
Mat-lin OS, Brennan T, Avorn J, et al. Cost-effectiveness of
nov-el regimens for the treatment of hepatitis C virus. Ann Intern
Med 2015; 162: 407-19.
3. Chahal HS, Marseille EA, Tice JA, Pearson SD, Ollendorf DA,
Fox RK, Kahn JG. Cost-effectiveness of Early Treatment of Hepatitis C Virus Genotype 1 by Stage of Liver Fibrosis in a
US Treatment-Naive Population. JAMA Intern Med 2016; 176:
65-73.
4. Leidner AJ, Chesson HW, Xu F, Ward JW, Spradling PR,
Hol-mberg SD. Cost-effectiveness of hepatitis C treatment for
patients in early stages of liver disease. Hepatology 2015;
61: 1860-9.
5. European Association for the Sudy of the Liver. EASL
Rec-ommendations on Treatment of Hepatitis C 2015. J Hepatol
2015; 63: 199-236.
6. AASLD/IDSA HCV Guidance Panel. Hepatitis C guidance:
AASLD-IDSA recommendations for testing, managing, and
treating adults infected with hepatitis C virus. Hepatology
2015; 62: 932-54.
7. European Association for the Study of the Liver, Asociación
Latinoamericana para el Estudio del Hígado. EASL-ALEH Clinical Practice Guidelines: Non-invasive tests for evaluation
of liver disease severity and prognosis. J Hepatol 2015; 63:
237-64.
8. Whiting PF, Rutjes AW, Westwood ME, Mallett S, Deeks JJ,
Reitsma JB, Leeflang MM, et al. QUADAS-2: a revised tool for the quality assessment of diagnostic accuracy studies. Ann Intern Med 2011; 155: 529-36.
9. Liu CH, Liang CC, Huang KW, Liu CJ, Chen SI, Lin JW, Hung
PH, et al. Transient elastography to assess hepatic fibrosis
in hemodialysis chronic hepatitis C patients. Clin J Am Soc
Nephrol 2011; 6: 1057-65.
10. Malik R, Lai M, Sadiq A, Farnan R, Mehta S, Nasser I, Challies T, et al. Comparison of transient elastography, serum mark-ers and clinical signs for the diagnosis of compensated
cir-rhosis. J Gastroenterol Hepatol 2010; 25: 1562-8.
11. Chang PE, Liu HF, Chau YP, Lim KH, Yap WM, Tan CK, Chow WC. Prospective evaluation of transient elastography for the diagnosis of hepatic fibrosis in Asians: comparison with
liv-er biopsy and aspartate transaminase platelet ratio index.
Al-iment Pharmacol Ther 2008; 28: 51-61.
12. Coco B, Oliveri F, Maina AM, Ciccorossi P, Sacco R, Colom-batto P, Bonino F, et al. Transient elastography: a new sur-rogate marker of liver fibrosis influenced by major changes
of transaminases. J Viral Hepat 2007; 14: 360-9.
13. Fransen van de Putte D, Blom R, van Soest H, Mundt M, Verveer C, Arends J, de Knegt RE, et al. Impact of Fibroscan on management of chronic viral hepatitis in clinical practice. Ann Hepatol 2001; 10: 469-76.
14. González Guilabert MI, Hinojosa Mana-Bernal C, del Pozo González J, del Pozo Pérez MA. Retrospective study of Fi-broScan, APRI, FIB-4 and FORNS indexes compared with liv-er biopsy in the evaluation of livliv-er fibrosis in patients with
chronic hepatitis C monoinfection and HIV coinfection.
Gas-troenterol Hepatol 2010; 425-32.
15. Degos F, Perez P, Roche B, Mahmoudi A, Asselineau J, Voi-tot H, Bedossa P, et al. Diagnostic accuracy of FibroScan and comparison to liver fibrosis biomarkers in chronic viral hepatitis: a multicenter prospective study (the FIBROSTIC
study). J Hepatol 2010; 53: 1013-21.
16. Sharma P, Dhawan S, Bansal R, Tyagi P, Bansal N, Singla V, Kumar A, et al. Usefulness of transient elastography by
Fi-broScan for the evaluation of liver fibrosis. Indian J
Gastro-enterol 2014; 33: 445-51.
17. Isgro G, Calvaruso V, Andreana L, Luong TV, Garcovich M, Manousou P, Alibrandi A, et al. The relationship between transient elastography and histological collagen
proportion-ate area for assessing fibrosis in chronic viral hepatitis. J
Gastroenterol 2013; 48: 921-9.
18. Castéra L, Vergniol L, Foucher J, Le Bail B, Chanteloup E, Haaser M, Darriet M, et al. Prospective comparison of tran-sient elastography, Fibrotest, APRI, and liver biopsy for the
assessment of fibrosis in chronic hepatitis C.
Gastroenter-ology 2005; 128: 343-50.
19. Castéra L, Sebastiani G, Le Bail B, de Lédinghen V, Couzig-ou P, Alberti A. Prospective comparison of two algorithms combining non-invasive methods for staging liver fibrosis in
20. Saito H, Tada S, Nakamoto N, Kitamura K, Horikawa H, Kurita S, Saito Y, et al. Efficacy of non-invasive elastometry on
staging of hepatic fibrosis. Hepatol Res 2004; 29: 97-103.
21. Kim SU, Jang HW, Cheong JY, Kim JK, Lee MH, Kim DJ, Yang JM, et al. The usefulness of liver stiffness measurement us-ing FibroScan in chronic hepatitis C in South Korea: a
multi-center, prospective study. J Gastroenterol Hepatol 2011;
26: 171-8.
22. Boursier J, de Ledinghen V, Zarski JP, Rousselet MC, Sturm N, Foucher J, Leroy V, et al. A new combination of blood test and fibroscan for accurate non-invasive diagnosis of liver
fi-brosis stages in chronic hepatitis C. Am J Gastroenterol
2011; 106: 1255-63.
23. Stibbe KJM, Verveer C, Francke J, Hansen BE, Zondervan PE, Kuipers EJ, de Knegt RJ, et al. Comparison of non-inva-sive assessment to diagnose liver fibrosis in chronic
hepati-tis B and C patients. Scand J Gastroenterol 2011; 46:
962-72.
24. Crisan D, Radu C, Grigorescu MD, Lupsor M, Feier D, Grigor-escu M. Prospective non-invasive follow-up of liver fibrosis
in patients with chronic hepatitis C. J Gastrointestin Liver
Dis 2012; 21: 375-82.
25. Lewin M, Poujol-Robert A, Boëlle PY, Wendum D, Lasnier E, Viallon M, Guéchot J, et al. Diffusion-weighted magnetic res-onance imaging for the assessment of fibrosis in chronic
hepatitis C. Hepatology 2007; 46: 658-65.
26. Sebastiani G, Halfon P, Castera L, Pol S, Thomas DL, Mangia A, Di Marco V, et al. SAFE biopsy: a validated method for large-scale staging of liver fibrosis in chronic hepatitis C. Hepatology 2009; 49: 1821-7.
27. Boursier J, de Ledinghen V, Zarski JP, Fouchard-Hubert I, Gallois Y, Oberti F, Calès P, et al. Comparison of eight diag-nostic algorithms for liver fibrosis in hepatitis C: new algo-rithms are more precise and entirely noninvasive. Hepatology 2012; 55: 58-67.
28. Sirli R, Sporea I, Bota S, Popescu A, Cornianu M. A compar-ative study of non-invasive methods for fibrosis
assess-ment in chronic HCV infection. Hepat Mon 2010; 10: 88-94.
29. Obara N, Ueno Y, Fukushima K, Nakagome Y, Kakazu E, Kimura O, Wakui Y, et al. Transient elastography for meas-urement of liver stiffness measmeas-urement can detect early sig-nificant hepatic fibrosis in Japanese patients with viral and
nonviral liver diseases. J Gastroenterol 2008; 43: 720-8.
30. Castéra L, Le Bail B, Roudot-Thoraval F, Bernard PH, Fouch-er J, MFouch-errouche W, Couzigou P, et al. Early detection in rou-tine clinical practice of cirrhosis and oesophageal varices in
chronic hepatitis C: comparison of transient elastography (Fi-broScan) with standard laboratory tests and non-invasive
scores. J Hepatol 2009; 50: 59-68.
31. Cobbold JFL, Crossey MM, Colman P, Goldin RD, Murphy PS, Patel N, Fitzpatrick J, et al. Optimal combinations of ultra-sound-based and serum markers of disease severity in
pa-tients with chronic hepatitis C. J Viral Hepat 2010; 17:
537-45.
32. Bota S, Sirli R, Sporea I, Focsa M, Popescu A, Danila M, Strain M, et al. A new scoring system for prediction of
fibro-sis in chronic hepatitis C. Hepat Mon 2011; 11: 548-55.
33. Crisan D, Radu C, Lupsor M, Sparchez Z, Grigorescu MD, Grigorescu M. Two or more synchronous combination of noninvasive tests to increase accuracy of liver fibrosis as-sessement in chronic hepatitis C; results from a cohort of
446 patients. Hepat Mon 2012; 12: 177-84.
34. Zarski JP, Sturm N, Guechot J, Paris A, Zafrani ES, Asselah T, Boisson RC, et al. Comparison of nine blood tests and transient elastography for liver fibrosis in chronic hepatitis
C: the ANRS HCEP-23 study. J Hepatol 2012; 56: 55-62.
35. Gara N, Zhao X, Kleiner DE, Liang TJ, Hoofnagle JH, Ghany MG. Discordance among transient elastography, aspartate aminotransferase to platelet ratio index, and histologic as-sessments of liver fibrosis in patients with chronic hepatitis C. Clin Gastroenterol Hepatol 2013; 11: 303-8.
36. Bonnard P, Elsharkawy A, Zalata K, Delarocque-Astagneau E, Biard L, Le Fouler L, Hassan AB, et al. Comparison of liver biopsy and noninvasive techniques for liver fibrosis
assess-ment in patients infected with HCV-genotype 4 in Egypt. J
Viral Hepat 2015; 22: 245-53.
37. Smith JO, Sterling RK. Systematic review: non-invasive
methods of fibrosis analysis in chronic hepatitis C. Aliment
Pharmacol Ther 2009; 30: 557-76.
38. Shaheen AAM, Myers RP. Diagnostic accuracy of the as-partate aminotransferase-to-platelet ratio index for the pre-diction of hepatitis C-related fibrosis: a systematic review. Hepatology 2007; 46: 912-21.
Correspondence and reprint request:
Ângelo Zambam de Mattos, M.D., MSc, Ph.D. 154, Professor Annes Dias Street, office 1103,