Proc. Forum Acusticum 2002 Sevilla, Spain, Special Session PHA -01: Acoustics of Dispersed Particulate Matter, Hawkes et al, 16-20.09.2002, Invited Paper
Positioning particles within liquids using ultrasound force fields
PACS REFERENCE: 43.20.Ks, 43.25.Qp, 43.25.Uv
Hawkes Jeremy J.1, Gröschl Martin 2, Benes Ewald 2, Nowotny Helmut 3, Coakley W. Terence 4
1
Department of Instrumentation and Analytical Science University of Manchester, Institute of Technology PO Box 88, Manchester M60 1QD, UK
Email: [email protected]
2
Vienna University of Technology, Institut für Allgemeine Physik Wiedner Hauptstr. 8-10/134, A 1040 Wien
Email: [email protected], [email protected]
3
Vienna University of Technology, Institut für Theoretische Physik Wiedner Hauptstr. 8-10/136, A 1040 Wien
Email: [email protected]
4
School of Biosciences, Cardiff University Cardiff CF10 3TL, UK
Email: [email protected]
ABSTRACT
Ultrasound standing wave radiation acts on suspensions, emulsions, and colloids to drive the dispersed particles (solid particles, bubbles, or oil droplets) towards either nodal or anti-nodal positions in the sound field. Using narrow chambers which contain only one nodal plane we have been able to position this pressure node at: 1) The reflector side wall of a chamber, this has been used to draw cells to a surface for detection by a biosensor. 2) The centre of the chamber, this has been combined with manipulation by laminar flow to produce a filter to remove contaminating particles. These systems have been developed using a one-dimensional transfer matrix model to predict the node positions and the acoustic energy density in the fluid. The model has been further used to predict chamber designs in which pressure nodes are at 1) the transducer side wall of the chamber and 2) both walls of the chamber.
INTRODUCTION
to enhance the particle capture rate of biosensor surfaces by driving particles to the wall of the chamber (unpublished).
The aim of this paper is to describe fundamental design criteria, which must be applied for the development of any ultrasound system where node positioning is required. Four positions where the node can be placed between two chamber walls will be considered, these are against the transducer wall, centrally between the walls, against the reflector wall and against both walls. The method for calculating the node positions is based on the transfer matrix multilayer model. The reliability of this model was tested previously (Hawkes et al., 2002), here it is used as a design tool.
[image:2.596.202.396.202.242.2]
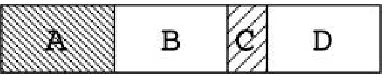
Fig. 1 Schematic representation of the acoustic chamber (4-layer system): A piezoceramic, B stainless steel transmission layer, C water layer, D stainless steel reflector layer.
Table 1 Material properties
Piezoceramic A Steel B, D Water C
Speed of sound [m/s] 4080 6100 1500
Mass density [kg/m3] 7700 7800 1000
Acoustic quality factor 1000 1000 1000
Dielectric constant [F/m] 1.2 x 10⁻⁸
Tangent of dielectric loss angle 3.0 x 10⁻³
Electromechanical coupling factor 0.48
Electrode area [mm2] 200
Thickness Q = λ/4 (@ 3 MHz) [mm] 0.508 0.125
Thickness H = λ/2 (@ 3 MHz) [mm] 0.680 1.016 0.250
SIMULATION CHOICES
A model (Nowotny and Benes, 1987; Nowotny et al., 1991) to simulate acoustic wave propagation through a multilayer system is used. This transfer matrix multilayer model has recently been experimentally validated in detail (Hawkes et al., 2002; Gröschl, 1998). Here the model has been run using data and construction details similar to those used for the experimental verification (Hawkes et al., 2002), see Figure 1. The ultrasound is produced by a piezoceramic layer (A), transmitted to the water layer (C) through stainless steel (B) and reflected by a second layer of stainless steel (D). The relevant properties of these layers are given in Table 1. The aim here is to describe general design principles. For this purpose we choose a fundamental frequency of 3 MHz and acoustic quality factors of 1000 for the different layers (previous fitted quality factor results were 150 and 350 for water and the piezoceramic respectively, while data for pure water is more than 10,000 and manufacturer data for the piezoceramic is 1000). Furthermore, the glue layer to fix the ceramic to the transmission layer is not considered here. The thicknesses of the transmission and reflector layers are modelled with
values which at 3 MHz are exactly λ/2, λ/4 and 0 and for water λ/2 and λ/4. The corresponding
dimensions in mm are given in the last two rows of Table 1. These λ/4 steps represent the
[image:2.596.86.512.318.513.2]Construction codes
The large numbers of constructions considered here are referred by the thickness values of the
component layers in terms of wavelength at 3 MHz: 0 = no layer, Q = λ/4, H = λ/2. The
piezo-ceramic layer is modelled with constant thickness of λ/2 and is not included in the code. The
passive layers are described by three letters, 0HQ for example refers to a construction with no
transmission layer, λ/2 water layer (0.25 mm) and λ/4 stainless steel reflector (0.508 mm).
SIMULATION RESULTS AND DISCUSSION
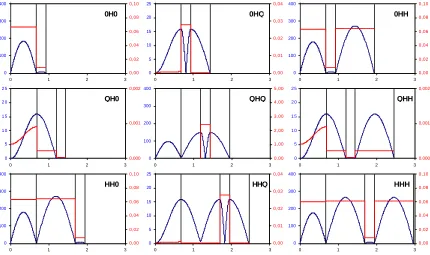
In Figures 2a and 2b the spatial distributions of the pressure and the acoustic energy density along the sound path (thickness direction of the layers) are shown for all considered
constructions (all combinations of transmission layer and reflector thicknesses with λ/4 and λ/2
water layer thicknesses, respectively). For these calculations it was assumed that the electrodes of the piezoceramic are connected to an electric generator with a source voltage
amplitude of 1 V and a source resistance of 50 Ω. Since on the free outer surface of the
reflector there is always a pressure node, for all constructions xy0 and xyH (x and y are any codes for the transmission layer and the reflector layer thickness, respectively) there is also a
pressure node at the right boundary of the water layer. For a water layer thickness of λ/2 (codes
xH0 and xHH) there is an additional pressure node at the other boundary (interface between
layers B and C). A pressure node in the middle of the water layer can only occur for a λ/2 water
layer combined with a λ/4 reflector layer (code xHQ). As can be seen from the pressure scales,
high values of pressure are obtained particularly in cases where the total acoustic path length is
a multiple of λ/2 (these are 0QQ, QQ0, QQH, HQQ in Fig. 2a and 0H0, 0HH, QHQ, HH0, HHH
in Fig. 2b).
The acoustic energy density in the water layer is also dependent on the reflector thickness. For
a reflector thickness of λ/2 (codes xyH), the acoustic energy density is much higher in the
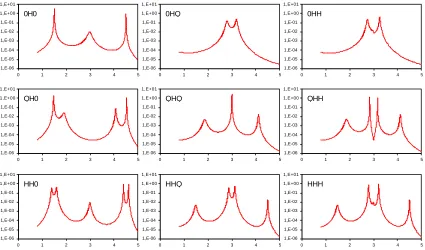
reflector than in the adjacent water layer, because for these geometries the displacement amplitudes have the same maximum value in both layers. This follows from the condition of continuity for the displacement that must apply at the water-reflector interface. In Figs. 3a and 3b the frequency spectra of the acoustic energy density in the water layer for all considered constructions are shown. As for Fig. 2, a source voltage amplitude of 1 V and a source
resistance of 50 Ω were assumed. Since the electric impedance of the multilayer systems is
strongly dependent on frequency, the voltage at the piezoceramic, as well as the total electric input energy to the system, also vary with frequency. Therefore, these figures alone are not sufficient to predict the efficiency of a particular construction. For the piezoceramic's resonance frequency of 3 MHz, the acoustic energy density in the water layer shows maxima for all
designs with a total acoustic path length that equals a multiple of λ/2 at 3 MHz (0QQ, QQ0,
QQH, HQQ in Fig. 3a, 0H0, QHQ, HH0 in Fig. 3b). Although this condition is not fulfilled for the designs 0QH and HQH (Fig. 3a), the results look very similar to the spectra for 0QQ and HQQ, respectively. However, this similarity is not a basic property of these designs but is due to a
smoothing effect on the energy density spectra that is caused by the 50 Ω source resistance in
series with the piezoelectric structure. To illustrate this effect, in the upper right picture of Fig. 3a (design 0QH) the respective energy density spectrum for a zero source resistance is included (blue curve). This curve shows a double peak, which is characteristic for designs where the total
acoustic path length at 3 MHz does not match a multiple of λ/2.
Fig. 2a Distributions of pressure (scale in kPa on the left) and acoustic energy density (scale in
J/m3 on the right) along the sound path at 3 MHz for all 9 possible constructions for a chamber
with a water layer of λ/4 (0.125 mm) and 0, λ/4 or λ/2 stainless steel transmission and reflector
layers. Pressure drops to 0 at the node positions. Layer boundaries are indicated by black vertical lines. Results are valid for an electric drive generator with a source voltage amplitude of
1 V and a source resistance of 50 Ω. Scale on the horizontal axis (sound path) is given in mm.
Fig. 2b The same as Fig. 2a but with a water layer of λ/2 (0.25 mm) and 0, λ/4 or λ/2 stainless steel transmission and reflector layers.
0 5 10 15 20 25
0 1 2 3
0,00 0,01 0,02 0,03 0,04 0 0Q0 0 100 200 300 400 500
0 1 2 3
0,00 0,02 0,04 0,06 0,08 0,10 0 0QQ 0 100 200 300 400 500
0 1 2 3
0,00 0,05 0,10 0,15 0,20 0 0QH 0 100 200 300 400 500
0 1 2 3
0,00 1,00 2,00 3,00 4,00 5,00 0 QQ0 0 5 1 0 1 5 2 0 2 5
0 1 2 3
0,000 0,001 0,002 0 QQQ 0 100 200 300 400 500
0 1 2 3
0,00 0,02 0,04 0,06 0,08 0,10 0 QQH 0 5 10 15 20 25
0 1 2 3
0,00 0,01 0,02 0,03 0,04 0 HQ0 0 100 200 300 400 500
0 1 2 3
0,00 0,02 0,04 0,06 0,08 0,10 0 HQQ 0 100 200 300 400 500
0 1 2 3
0,00 0,05 0,10 0,15 0,20 0 HQH 0 100 200 300 400
0 1 2 3
0,00 0,02 0,04 0,06 0,08 0,10 0 0H0 0 5 10 15 20 25
0 1 2 3
0,00 0,01 0,02 0,03 0,04 0 0HQ 0 100 200 300 400
0 1 2 3
0,00 0,02 0,04 0,06 0,08 0,10 0 0HH 0 5 1 0 1 5 2 0 2 5
0 1 2 3
0,000 0,001 0,002 0 QH0 0 100 200 300 400
0 1 2 3
0,00 1,00 2,00 3,00 4,00 5,00 0 QHQ 0 5 1 0 1 5 2 0 2 5
0 1 2 3
0,000 0,001 0,002 0 QHH 0 100 200 300 400
0 1 2 3
0,00 0,02 0,04 0,06 0,08 0,10 0 HH0 0 5 10 15 20 25
0 1 2 3
0,00 0,01 0,02 0,03 0,04 0 HHQ 0 100 200 300 400
0 1 2 3
[image:4.596.89.519.428.683.2]Fig. 3a Frequency spectra of the acoustic energy density (in J/m3) within the water layer for all
9 possible chambers with a water layer of λ/4 (0.125 mm) and 0, λ/4 or λ/2 stainless steel
transmission and reflector layers (the thickness values given in fractions of the acoustic wavelength correspond to a frequency of 3 MHz). Results are valid for an electric drive
generator with a source voltage amplitude of 1 V and a source resistance of 50 Ω. The upper
right picture additionally shows the result for a zero source resistance (blue curve, scale on the right). Scale on the horizontal axis (frequency) is given in MHz.
Fig. 3b The same as Fig. 3a but with a water layer of λ/2 (0.25 mm) and 0, λ/4 or λ/2 stainless steel transmission and reflector layers.
1,E-06 1,E-05 1,E-04 1,E-03 1,E-02 1,E-01 1,E+00 1,E+01
0 1 2 3 4 5
0Q0 1,E-06 1,E-05 1,E-04 1,E-03 1,E-02 1,E-01 1,E+00 1,E+01
0 1 2 3 4 5
0QQ
1 , E - 0 6 1 , E - 0 5 1 , E - 0 4 1 , E - 0 3 1 , E - 0 2 1 , E - 0 1 1 , E + 0 0 1 , E + 0 1
0 1 2 3 4 5
1,E-04 1,E-03 1,E-02 1,E-01 1 , E + 0 0 1 , E + 0 1 1 , E + 0 2 1 , E + 0 3
0QH 1,E-06 1,E-05 1,E-04 1,E-03 1,E-02 1,E-01 1,E+00 1,E+01
0 1 2 3 4 5
QQ0 1,E-06 1,E-05 1,E-04 1,E-03 1,E-02 1,E-01 1,E+00 1,E+01
0 1 2 3 4 5
QQQ 1,E-06 1,E-05 1,E-04 1,E-03 1,E-02 1,E-01 1,E+00 1,E+01
0 1 2 3 4 5
QQH 1,E-06 1,E-05 1,E-04 1,E-03 1,E-02 1,E-01 1,E+00 1,E+01
0 1 2 3 4 5
HQ0 1,E-06 1,E-05 1,E-04 1,E-03 1,E-02 1,E-01 1,E+00 1,E+01
0 1 2 3 4 5
HQQ 1,E-06 1,E-05 1,E-04 1,E-03 1,E-02 1,E-01 1,E+00 1,E+01
0 1 2 3 4 5
HQH 1,E-06 1,E-05 1,E-04 1,E-03 1,E-02 1,E-01 1,E+00 1,E+01
0 1 2 3 4 5
0H0 1,E-06 1,E-05 1,E-04 1,E-03 1,E-02 1,E-01 1,E+00 1,E+01
0 1 2 3 4 5
0HQ 1,E-06 1,E-05 1,E-04 1,E-03 1,E-02 1,E-01 1,E+00 1,E+01
0 1 2 3 4 5
0HH 1,E-06 1,E-05 1,E-04 1,E-03 1,E-02 1,E-01 1,E+00 1,E+01
0 1 2 3 4 5
QH0 1,E-06 1,E-05 1,E-04 1,E-03 1,E-02 1,E-01 1,E+00 1,E+01
0 1 2 3 4 5
QHQ 1,E-06 1,E-05 1,E-04 1,E-03 1,E-02 1,E-01 1,E+00 1,E+01
0 1 2 3 4 5
QHH 1,E-06 1,E-05 1,E-04 1,E-03 1,E-02 1,E-01 1,E+00 1,E+01
0 1 2 3 4 5
HH0 1,E-06 1,E-05 1,E-04 1,E-03 1,E-02 1,E-01 1,E+00 1,E+01
0 1 2 3 4 5
HHQ 1,E-06 1,E-05 1,E-04 1,E-03 1,E-02 1,E-01 1,E+00 1,E+01
0 1 2 3 4 5
[image:5.596.88.513.441.691.2]Similar results for node positions and spectra have been obtained, although with altered peak
magnitudes, when carbon (speed of sound 4260 m/s, mass density 1470 kg/m3) or silicon
(speed of sound 8430 m/s, mass density 2340 kg/m3) was used in the simulations.
CONCLUSION
The discussed series of designs describe constructions, which can be chosen to position particles either at a wall or centrally within a chamber. Moving particles from the centre of a chamber to the chamber walls is also possible by a change in frequency. In particular, this can be achieved in chambers 0HH or HHH. Particles may be also moved from one wall to the other. With respect to system efficiency, it is advantageous to operate near the piezoceramic's fundamental resonance. Nonetheless, other operating frequencies may produce some useful systems.
ACKNOWLEDGEMENTS
Jeremy J. Hawkes was supported by a DERA Contract No. CU013-0000010785. Work supported by the European Commission's TMR Programme EuroUltraSonoSep, Contract No. ERBFMRXCT97-0156, .
REFERENCES
Crum, L.A. Acoustic force on a liquid droplet in an acoustic stationary wave, J. Acoust. Soc. Am. 50, 157-163 (1971).
Gor'kov, L.P. On the forces acting on a small particle in an acoustical field in an ideal fluid, Sov. Phys. Dokl. 6, 773-775 (1962).
Gould, R.K., and Coakley, W.T. The effects of acoustic forces on small particles in suspension, Proc. 1973 Symp. on Finite-Amplitude Wave Effects in Fluids (Pergamon Press, Guildford, UK, 1974), pp. 252-257. Gröschl, M. Ultrasonic separation of suspended particles - Part I: Fundamentals, Acustica - acta acustica 84, 432-447 (1998).
Hawkes, J.J., and Coakley, W.T. Force field particle filter, combining ultrasound standing waves and laminar flow, Sensors and Actuators B 75, 213-222 (2001).
Hawkes, J.J., Coakley, W.T., Gröschl, M., Benes, E., Armstrong, S., Tasker, P.J., and Nowotny, H. Single half-wavelength ultrasonic particle filter: Predictions of the transfer matrix multilayer resonator model and experimental filtration results, J. Acoust. Soc. Am 111, 1259-1266 (2002).
Hill, M., Harris, N.R., Townsend, R., Beeby, S.P., Shen, Y., White, N.M., Hawkes J.J., and Coakley, W.T. A microfluidic device for ultrasonic separation, Proc. Forum Acusticum 2002, Sevilla, Spain, Sept. 16-20, 2002.
Johnson, D.A., and Feke, D.L. Methodology for fractionating suspended particles using ultrasonic standing wave and divided flow fields, Separations Technology 5, 251-258 (1995).
King,, L.V. On the acoustic radiation pressure on spheres, Proc. R. Soc. London A147, 212-240 (1934). Nowotny, H., and Benes, E. General one-dimensional treatment of the layered piezoelectric resonator with two electrodes, J. Acoust. Soc. Am. 82, 513-521 (1987).
Nowotny, H., Benes, E., and Schmid, M. Layered piezoelectric resonators with an arbitrary number of electrodes (general one-dimensional treatment), J. Acoust. Soc. Am. 90, 1238-1245 (1991).
Nyborg, W.L. Radiation pressure on a small rigid sphere, J. Acoust. Soc. Am. 42, 947-952 (1967). Whitworth, G., and Coakley, W.T. Particle column formation in a stationary ultrasonic field, J. Acoust. Soc. Am. 91, 79-85 (1992).