Stock markets, banks and economic growth in a context of common shocks and cross country dependencies (Supplement)
118
0
0
Texto completo
(2) Stock Markets, Banks and Economic Growth in a Context of Common Shocks and Cross-Country Dependencies (Online Supplement). STOCK MARKETS, BANKS AND ECONOMIC GROWTH IN A CONTEXT OF COMMON SHOCKS AND CROSS-COUNTRY DEPENDENCIES (Supplement)*. ABSTRACT This is an supplement to the paper by Ruge-Leiva and Caivano (2017) “Stock Markets, Banks and Economic Growth in a Context of Common Shocks and Cross-Country Dependencies”, which provides additional findings and figures, unit root test results, cross-section dependence test results, tables of data collection and additional descriptive statistics. Keywords: Economic Growth, Stock Market Development, Development, Cross-Section Dependence, Multifactor Error Structure.. Banking. JEL Codes: C23, G21, O16, O40 *The Paper of this supplement is available in the WP 03/17.. RESUMEN Este es un apéndice del artículo de Ruge-Leiva y Caivano (2017) “Stock Markets, Banks and Economic Growth in a Context of Common Shocks and Cross-Country Dependencies", que proporciona hallazgos y cifras adicionales, resultados de las pruebas de raíz unitaria, resultados de las pruebas de dependencia de la sección transversal, tablas de recolección de datos y estadísticas descriptivas adicionales. Palabras clave: Crecimiento Económico, desarrollo del mercado de valores, desarrollo bancario, dependencia transversal, estructura de error multifactor. JEL Codes: C23, G21, O16, O40 *El artículo que corresponde a este suplemento se recoge en el DT 03/17.. AUTORES DIEGO-IVAN RUGE-LEIVA Universidad Externado de Colombia, [email protected].. Finance. Faculty.. Email:. GIUSEPPE CAIVANO Università degli Studi di Bari Aldo Moro, Dipartamento di Scienze Economiche. Email: [email protected].. Instituto Universitario de Análisis Económico y Social Documento de Trabajo 04/2017, 118 páginas, ISSN: 2172-7856 2.
(3) Stock Markets, Banks and Economic Growth in a Context of Common Shocks and Cross-Country Dependencies (Online Supplement). ÍNDEX. Índex ........................................................................................... 3 A1. Brief description of the additional results in Tables A and B ........... 4 A2. Brief description of the definitions and sources of the data for variables ................................................................................... 8 A3. Additional figures ..................................................................... 9 A4. Additional results for Tables 2-3: Tables A1-A4 ........................... 14 A5. Additional results for Table 4: Tables A5-A9 ............................... 19 A6. Additional results for Table 5: Tables A10-A15 ............................ 24 A7. Additional results for Table 6: Tables A16-A34 ............................ 30 A8. Additional results when including the log of gross fixed capital formation to GDP as the dependent variable, for a time from 1988 to 2012: Tables A35-A37 ............................................................... 54 A9. Additional results for Tables 7-10: Table B1-B26 ......................... 57 A10. Additional results when including the log of gross fixed capital formation to GDP as the dependent variable, for a time from 1961 to 2014: Table B27-B30 ................................................................. 88 A11. Results of unit root and cross-section dependence tests: Tables C1C10 ......................................................................................... 93 A12. Data collection: Tables D1-D6 ............................................... 103 A13. Additional results for Table 1: Table D7 .................................. 114 A14. References ......................................................................... 115. Instituto Universitario de Análisis Económico y Social Documento de Trabajo 04/2017, 118 páginas, ISSN: 2172-7856 3.
(4) Stock Markets, Banks and Economic Growth in a Context of Common Shocks and Cross-Country Dependencies (Online Supplement). A1. BRIEF DESCRIPTION OF THE ADDITIONAL RESULTS IN TABLES A AND B. - Tables A1-A2 show the specifications of models in Tables 3-4 of for the separate modelling of bank and stock market development. Most of these results agree with our findings except for those which are misspecified due to strong cross-sectional correlation and non-stationary residuals. The negative effect of banking development also holds if we use data from 1988-2014 for bank development and growth (the results are available upon request). We do not examine models from 1988 to 2007 due to short time series data (this is the same case for models for the rest of the Tables A, except for Tables A3-A4). - Tables A3-A4 present the estimates of the dynamic models which implement bank development as the only independent variable. The results suggest that the effect of bank development is negative and significant. However, all pooled dynamic specifications suffer from strong residual cross-sectional correlation. In contrast, only one of the CCEMG specifications suffers from this problem. These results hold for advanced countries, even if the time series sample ranges from 1961 to 2007; however, the evidence for emerging economies is weaker (the results are available upon request). - In Tables A5-A8 we report the estimates for static and dynamic models for advanced and emerging economies which assume error cross-section independence and use data from 1988 to 2012. Although these models yield negative and significant coefficients of bank development and positive and significant estimates of stock market development, most of them are inconsistent due to strong cross-section dependence and/or non-stationary residuals. These results hold even if we model bank and stock market development separately; or if we employ data for bank development and economic growth from 1988 to 2014 when we only use bank development as the financial development regressor (the results are available upon request). Due to limitations of the sample size, we cannot report the results of the CCEP model for advanced countries. - Table A9 contains the estimates of the basic static and dynamic models for the subsample of advanced countries, using full crosssectional averages. However, the estimates are inconsistent due to strong residual cross-section dependence. This is also true when we analyze specifications where, in addition to cross-section averages: (i) we include additional regressors or different proxies for our main variable; (ii), we use cross-sectional averages that are computed on the basis of advanced countries plus two or more emerging economies; (iii), we detrend or demean the data to construct full sample averages; and (iv), we employ data from 1988 to 2014 for the bank development variable, growth and other variables, when bank development is the. Instituto Universitario de Análisis Económico y Social Documento de Trabajo 04/2017, 118 páginas, ISSN: 2172-7856 4.
(5) Stock Markets, Banks and Economic Growth in a Context of Common Shocks and Cross-Country Dependencies (Online Supplement). only financial development regressor (the results are available upon request). - We report estimates of the models in Table 6 from our paper by (i), studying the subsamples of advanced and emerging countries (Tables A10-A11); or (ii), using dynamic estimators for the full sample (Tables A12-A15). These results lend some support to our findings, except for those models that are misspecified due to the non-stationarity and/or strong cross-sectional dependence of the residuals. Some of these results also hold for: (i), cross-sectionally dependent models that include bank and stock market separately; (ii), those which employ data from 1988-2014 for bank development, output growth and other variables (in the case where bank development is the only financial regressor); or (iii) for some cross-sectionally independent static models (the results are available upon request). The CS-ARDL models for the full sample and all dynamic models for advanced and emerging economies are not analyzed due to very short time series data. - We report estimates of the models in Table 7 of our investigation by (i), including additional variables; (ii), analyzing the subsamples for advanced and emerging economies, with the inclusion of additional regressors; or (iii), using dynamic models for the full sample (see Tables A16-A32). They agree with our previous findings; however, the MG and DL-MG dynamic models suffer from strong cross-sectional dependence. Due to a scarcity of time series data, we do not include the banking crisis and the bank lending-deposit spread variables when using the subsamples for advanced and emerging economies nor versions of the models in Tables A29-A32 for subsamples of advanced and emerging economies. The findings from Tables A16-A32 also hold even if we (i), include bank and stock markets development separately; (ii), use static models which assume cross-section independence of errors; or (iii) employ time series data from 1988 to 2014 for the bank development variable, growth and other variables, in the case where we include bank development as the only financial development regressor (results are available upon request). - Table A33 presents the results of dynamic specifications that include gross government debt as an independent regressor, in addition to both bank and stock market development. We employ data from 1988 to 2012. We can infer that (1), the inclusion of gross government debt does not affect the results that we obtained in our work; (2), its estimates are insignificant in most cases, in contrast with our findings from Table 6; and (3), given the high level of significance of the stock market development estimates, stock markets should be accounted for when analyzing the effects of banking development and gross public debt on growth, especially because they appear to smooth the effects of common shocks to financial systems, with positive implications for economic activity. Unfortunately, due to the lack of time-series data, we cannot obtain reliable estimates from the CS-ARDL model with three lagged cross-section averages, and the estimates of the CS-DLMG model. Instituto Universitario de Análisis Económico y Social Documento de Trabajo 04/2017, 118 páginas, ISSN: 2172-7856 5.
(6) Stock Markets, Banks and Economic Growth in a Context of Common Shocks and Cross-Country Dependencies (Online Supplement). in column (9) are insignificant. Moreover, although we employ crosssectional dynamic models that include one and two lagged crosssectional averages (specifications (5)-(8)), and that therefore allow us to analyze more flexible specifications in accordance with the short data availability, they do not consistently address feedback effects and crosssectional dependencies. Moreover, due to the lack of data, we cannot obtain the estimates of these models for the subsamples of advanced and emerging economies. - Table A34 presents the results of dynamic models from 1988 to 2012 which include the main financial development variables separately and the ratio of gross public debt to GDP. Overall, they support the conclusions we derived from Table A33. These and our general results are also supported by some findings of the cross-sectionally independent static models (these results are available upon request). However, due to the small sample size, we cannot determine if they hold for the subsamples of the advanced and emerging economies. - Tables A35-A37 show results for models from 1988 to 2012, where we include gross fixed capital formation to GDP as the dependent variable, and both stock market and banking development as the independent regressors. Estimates of the stock market development variable are positive and significant in most cases; however, when the sample is divided between advanced and emerging economies, they become insignificant (possibly due to a small sample bias). In contrast, while the coefficient of bank development is significant and positive in static models, it becomes positive and insignificant, or negative and significant, in most of the dynamic models (and even for the subsamples of advanced and emerging countries, although these results might be affected by a possible small sample bias). The only dynamic model that yields positive and significant slopes for banking development is the CSARDL model (this contradicts the findings from Tables B27-B30, where this model yields insignificant estimates of bank development). In addition, most of the static models are misspecified due to nonstationary and/or cross-sectionally dependent residuals. We also used several robustness checks, and obtained similar results in terms of the sign and significance of estimates (results are available upon request). Therefore, we can infer that (i) stock market development may promote long-run investment in fixed assets; and (ii), banking development may marginally boost or not promote at all long-run aggregate investment. Our second conclusion is supported by the findings which are reported in Tables B27-B30. - We report estimates of the models in Tables 8-11 of our investigation by (i), analyzing the main sample and the subsamples for advanced and emerging economies, with the inclusion of different additional regressors (in addition to inflation), or the implementation of different proxy variables for banking development and economic growth; and (ii), using cross-sectionally independent dynamic models for the full sample (see Tables B1-B26). Overall, the results from these specifications support. Instituto Universitario de Análisis Económico y Social Documento de Trabajo 04/2017, 118 páginas, ISSN: 2172-7856 6.
(7) Stock Markets, Banks and Economic Growth in a Context of Common Shocks and Cross-Country Dependencies (Online Supplement). our findings. Although we do not use alternative proxies for the main variables of models which assume cross-sectionally independent errors, and/or split the sample between advanced and emerging countries in these models, the sign and significance of banking development in these cases coincide with previous findings (the results are available upon request). In addition, most of the results from Tables B1-B26 and Tables 8-11 hold even if inflation is not included. This is also true when inflation is replaced by population growth or the log of the ratio of gross fixed capital formation to GDP; or when economic growth is proxied by per capita GDP growth. This evidence is weaker when inflation is replaced by the log of the ratio of trade to GDP, or when we use time series data for a time period between 1961 to 2007 and for specifications as in Tables 8-11. However, these estimates become insignificant in several cases when inflation is replaced by the log of the ratio of the total gross government debt to GDP or the log of human capital, or when banking development is proxied by the log of liquid liabilities (the results are available upon request). In this case, results are not conclusive because, as we found in Tables 3-7 and Tables A33-A34, stock markets should be accounted for when analyzing the impact of these variables on growth, because it may smooth the effects of common shocks. In addition, despite the results from the use of liquid liabilities, we mainly rely on the estimates of the ratio of domestic credit to private sector by banks to GDP because it excludes loans to the government and public enterprises and credits by development banks (Beck and Levine, 2004), and more data is available. Moreover, we do not employ the log of the bank lending-deposit spread and the banking crisis dummy due to a shortage of data. - Tables B27-B30 show results for models from 1961 to 2014, where we include gross fixed capital formation to GDP as the dependent variable, banking development as the main independent regressor, and other covariates such as inflation and general government final consumption expenditure to GDP. When we use the full sample we find that the coefficient of bank development is positive and insignificant in ARDL specifications, and significant in the case of the DL models. Now, when we employ subsamples for advanced and emerging economies, the estimates of bank development are positive and insignificant (surprisingly, cross-sectional models for advanced countries fail to address residual cross-sectional dependence). We also used several robustness checks, and obtained similar results in terms of the sign and significance of estimates. In fact, the estimates of bank development in DL models become insignificant in some cases (the results are available upon request). Therefore, all of these findings agree with those of Tables A35-A37, and confirm that banking development may marginally foster or not promote at all long-run investment in fixed assets. However, we recognize that these findings may be subject to the omission of the stock market development regressor.. Instituto Universitario de Análisis Económico y Social Documento de Trabajo 04/2017, 118 páginas, ISSN: 2172-7856 7.
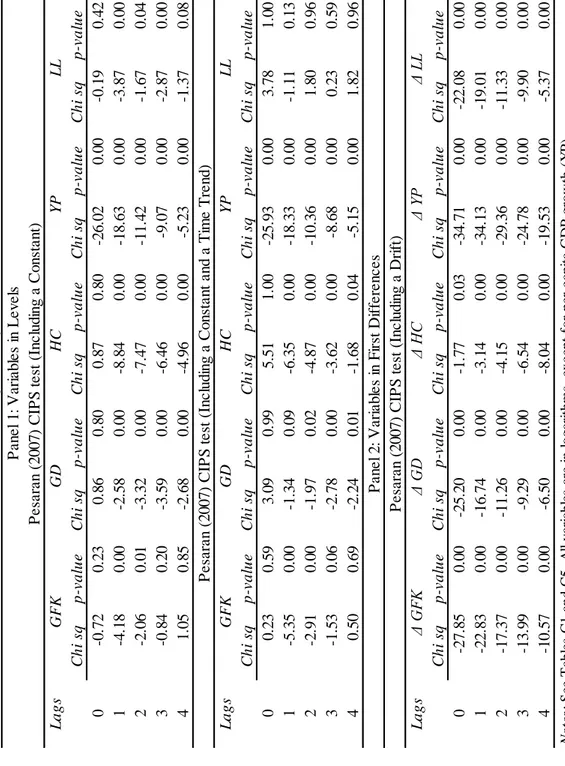
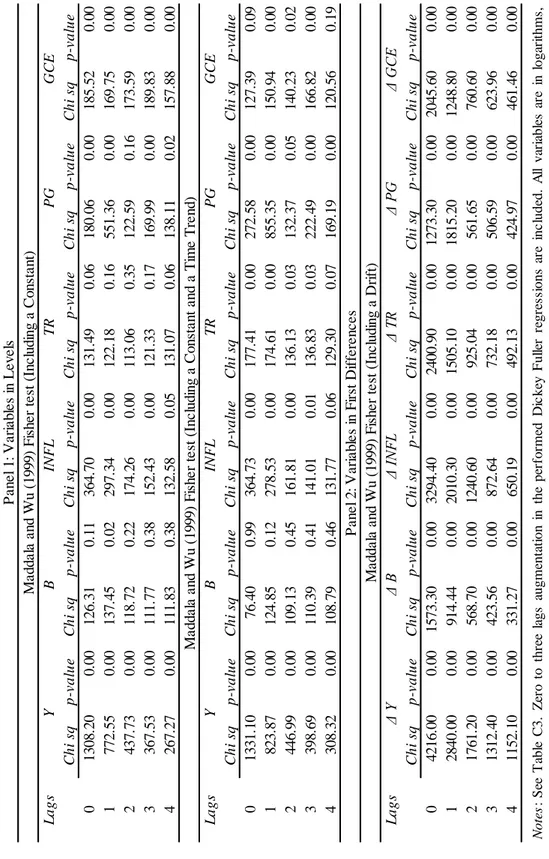
(8) Stock Markets, Banks and Economic Growth in a Context of Common Shocks and Cross-Country Dependencies (Online Supplement). A2. BRIEF DESCRIPTION OF THE DEFINITIONS AND SOURCES OF THE DATA FOR VARIABLES. The GDP growth variable (𝑌𝑖𝑡 ) uses the constant GDP in Local Currency Units (LCU) from the World Bank World Development Indicators (WDI) database. We also use this source for variables, such as the ratio of domestic credit to private sector by banks to GDP (𝐵𝑖𝑡 ), the ratio of trade (imports plus exports of goods and services) to GDP (𝑇𝑅𝑖𝑡 ), population growth (𝑃𝐺𝑖𝑡 , which uses the data on total population (in millions)), the relationship of general government final consumption expenditure to GDP (𝐺𝐶𝐸𝑖𝑡 ), the ratio of gross fixed capital formation to GDP (𝐺𝐹𝐾𝑖𝑡 ), GDP per capita growth (𝑌𝑃𝑖𝑡 , based on constant GDP per capita data in LCU), the ratio of market capitalization of listed companies to GDP (𝑆𝑖𝑡 ), the ratio of total value of stocks traded to GDP (𝑆𝑇𝑉𝑖𝑡 ), market turnover ratio of stocks traded (𝑀𝑇𝑅𝑖𝑡 ), and inflation (𝐼𝑁𝐹𝐿𝑖𝑡 ) (which uses the consumer price index (CPI) where the observations for 2010 have a value of 100). The CPI for Argentina is taken from the International Financial Statistics (IFS) of the International Monetary Fund (IMF). The CPI for Germany and the United Kingdom are taken from the OECD Main Economic Indicators (MEI). For Brazil, Chile, China, Tunisia, and Venezuela, we used the data on inflation found at: http://www.carmenreinhart.com/data/browse-by-topic/topics/2/, which updates Reinhart and Rogoff (2011). The data for the ratio of total (domestic plus external) gross government debt (in face value terms) to GDP (𝐺𝐷𝑖𝑡 ) are taken from the IMF Historical Public Debt Database (HPDD) (Abbas et al., 2011, Fall 2013 vintage). This database mainly covers public debt at the general government level. However, due to the lack of information on some countries before 1980, the figures for public debt refer to the central government level. The data for the Ivory Coast at the general government level are from http://www.carmenreinhart.com/data/browse-by-topic/topics/9/ and follow Reinhart and Rogoff (2011). We also used this source for the ratio of government debt to GDP at the central level for Argentina, Brazil, Chile, China, Indonesia, Philippines, Switzerland, and Venezuela. The index of human capital (𝐻𝐶𝑖𝑡 ) is taken from the Penn World Table 8.1. The main source for the variables, such as the bank lending-deposit spread (𝑆𝑃𝑖𝑡 ), banking crisis dummy (𝐵𝐶𝑖𝑡 ), and the ratio of liquid liabilities to GDP (𝐿𝐿𝑖𝑡 ) is the Global Financial Development (GFD) database of the World Bank. The data on liquid liabilities for Argentina and Germany are taken from the WDI. If any of the abovementioned series contained gaps of up to three years, we used linear interpolations to fill them. A thorough description of the data sources, time coverage, and missing data of the variables per country can be found in Tables D1D7.. Instituto Universitario de Análisis Económico y Social Documento de Trabajo 04/2017, 118 páginas, ISSN: 2172-7856 8.
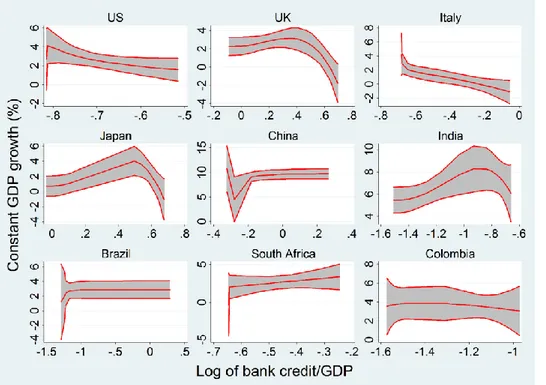
(9) Stock Markets, Banks and Economic Growth in a Context of Common Shocks and Cross-Country Dependencies (Online Supplement). A3. ADDITIONAL FIGURES. Fig. A1. It shows fractional polynomial lines (with a 95% confidence interval) for GDP growth against the log of the ratio of private credit by banks to GDP. The plots run from 1988 to 2012 and cover nine economies, which, from the left to the right, are: United States, United Kingdom, Italy, Japan, China, India, Brazil, South Africa, and Colombia.. Instituto Universitario de Análisis Económico y Social Documento de Trabajo 04/2017, 118 páginas, ISSN: 2172-7856 9.
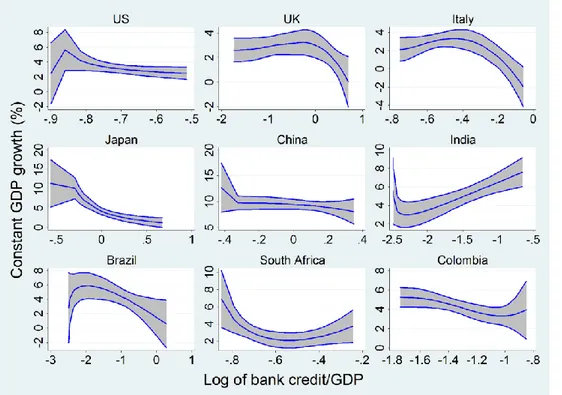
(10) Stock Markets, Banks and Economic Growth in a Context of Common Shocks and Cross-Country Dependencies (Online Supplement). Fig. A2. It shows fractional polynomial lines (with a 95% confidence interval) for GDP growth against the log of the ratio of private credit by banks to GDP. The plots are from 1961 to 2014 and for nine economies, which, from the left to the right, are: United States, United Kingdom, Italy, Japan, China, India, Brazil, South Africa, and Colombia.. Instituto Universitario de Análisis Económico y Social Documento de Trabajo 04/2017, 118 páginas, ISSN: 2172-7856 10.
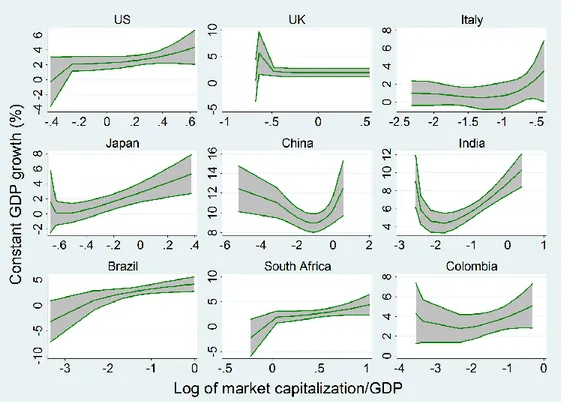
(11) Stock Markets, Banks and Economic Growth in a Context of Common Shocks and Cross-Country Dependencies (Online Supplement). Fig. A3. It shows fractional polynomial lines (with a 95% confidence interval) for GDP growth against the log of the ratio of market capitalization of listed companies to GDP. The plots are from 1988 to 2012 and for nine economies, which, from the left to the right, are: United States, United Kingdom, Italy, Japan, China, India, Brazil, South Africa, and Colombia.. Instituto Universitario de Análisis Económico y Social Documento de Trabajo 04/2017, 118 páginas, ISSN: 2172-7856 11.
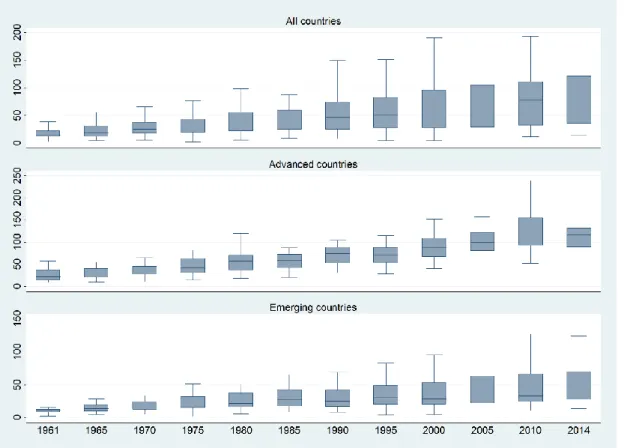
(12) Stock Markets, Banks and Economic Growth in a Context of Common Shocks and Cross-Country Dependencies (Online Supplement). Fig. A4. It provides box plots of the percentage of private credit by banks as a share of GDP, between 1961 and 2014 for the full sample, and the subsamples of advanced and emerging economies, from top to the bottom, respectively. We suppress the display of extreme values.. Instituto Universitario de Análisis Económico y Social Documento de Trabajo 04/2017, 118 páginas, ISSN: 2172-7856 12.
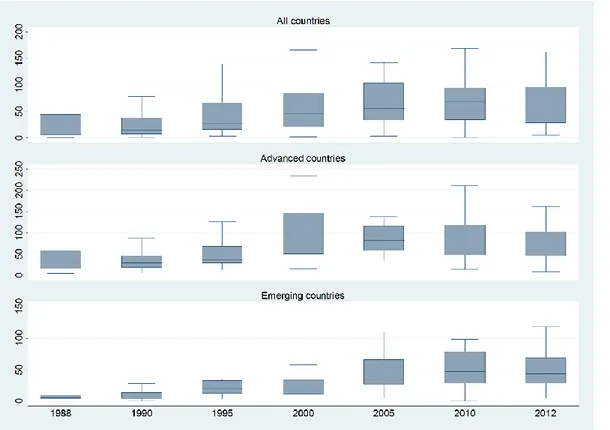
(13) Stock Markets, Banks and Economic Growth in a Context of Common Shocks and Cross-Country Dependencies (Online Supplement). Fig. A5. It shows box plots of the percentage of market capitalization of listed companies as a share of GDP, between 1988 and 2012 for the full sample and the subsamples of advanced and emerging economies, from top to the bottom, respectively. We suppress the display of extreme values.. Instituto Universitario de Análisis Económico y Social Documento de Trabajo 04/2017, 118 páginas, ISSN: 2172-7856 13.
(14) Instituto Universitario de Análisis Económico y Social Documento de Trabajo 04/2017, 118 páginas, ISSN: 2172-7856. 14. -0.24 0.80 I(1) 3.36 1332 54. -0.331** (0.144). -0.25 0.80 I(1) 3.26 1331 54. 0.162 (0.104) -0.34 0.73 I(1) 2.98 1332 54. -1.027* (0.377). -0.39 0.69 I(0) 2.78 1331 54. 1.401*** (0.218) -0.31 0.75 I(0) 3.49 1331 54. -2.199** (0.991). -0.09 0.93 I(0) 3.39 1277 54. 0.981** (0.433) -0.28 0.78 I(1) 2.81 1332 54. -1.219*** (0.458). 0.36 0.72 I(0) 2.63 1331 54. 1.546*** (0.285) 38.52 0.00 I(1) 2.92 1332 54. -1.769*** (0.667). Static models for banking development and growth from 1988-2012 POLS 2FE 2FE FD FD CCEP CCEP MG (2) (3) (4) (5) (6) (7) (8) (9). 44.06 0.00 I(0) 2.90 1331 54. 0.860*** (0.184). MG (10). 0.05 0.96 I(0) 2.47 1332 54. -2.626*** (0.769). -0.34 0.73 I(0) 2.36 1331 54. 1.808*** (0.276). CCEMG CCEMG (11) (12). Notes: GDP growth is the dependent variable. Log domestic credit to private sector by banks to GDP (B) and log market capitalization of listed companies to GDP (S) are the independent variables. The estimates of the intercept term are omitted. Standard errors are given in parentheses. Results are reported for a period of time from 1988 to 2012. Estimators: (1-2) POLS: Pooled OLS, augmented with T-1 year dummies; (3-4) 2FE: Two-way fixed effects, augmented with T-1 year dummies and N-1 country dummies; (5-6) FD: First Differences, augmented with T-2 year dummies; (7-8) CCEP: Pooled Pesaran (2006), augmented with common country dummies and cross-section averages; (9-10) MG: Mean Group Pesaran and Smith (1995); (11-12) CCEMG: Common Correlated Effects MG Pesaran (2006), augmented with cross-section averages. White heteroskedasticity-robust standard errors are reported for models (1)-(8). For models (9)-(12) we report (i), the estimates of the outlier-robust mean of parameter coefficients across groups following Hamilton (1992); and (ii), nonparametric standard errors according to Pesaran and Smith (1995) and Pesaran (2006) (the latter only for (11-12)). Levels of significance are represented by * 10%, ** 5% and *** 1%. Diagnostics: (evaluated at the 5% level of significance, full results of the following tests are available on request): 1) CD test: The Pesaran (2004, 2015) test, for which Ho: Weak cross-section dependence of the residuals (the test statistic as well as the p-value for each model are reported). 2) CIPS test: The Pesaran (2007) test evaluates the order of integration of the residuals where I(0): stationary, I(1): nonstationary. We include here up to 3 lags augmentation in the Dickey Fuller regressions employed. The root mean squared error (RMSE), NXT number of country-time observations and N number of countries are also included.. CD-test statistic CD-test p-value Order of Integration RMSE NXT N. S. B. POLS (1). TABLE A1. Stock Markets, Banks and Economic Growth in a Context of Common Shocks and Cross-Country Dependencies (Online Supplement). A4. ADDITIONAL RESULTS FOR TABLES 2-3: TABLES A1-A4.
(15) Instituto Universitario de Análisis Económico y Social Documento de Trabajo 04/2017, 118 páginas, ISSN: 2172-7856. 15. 0.129 (0.167). -1.537*** (0.513) 1.644*** (0.289). -2.213*** (0.696) 1.389*** (0.285). -0.16 0.87 2.99 1331 54. -0.31 0.75 2.87 1277 54. -0.38 0.70 2.85 1331 54. -0.54 0.59 2.66 1277 54. 37.68 0.00 2.61 1331 54. 44.22 0.00 2.60 1277 54. -0.544*** -0.559*** -0.725*** -0.794*** -0.816*** -0.783*** (0.041) (0.040) (0.048) (0.046) (0.035) (0.041). -0.517** (0.247). 36.09 0.00 2.73 1331 54. -2.104*** (0.674). 42.40 0.00 2.79 1277 54. 1.252*** (0.242). 2.119*** (0.416). 0.19 0.85 1.77 1331 54. -1.89 0.05 1.58 1183 54. -0.820*** -0.932*** (0.053) (0.059). -2.480** (1.101). 1.32 0.18 2.08 1331 54. -2.917*** (0.852). -2.39 0.01 1.98 1183 54. 2.158*** (0.411). Notes: GDP growth is the dependent variable. Log domestic credit to private sector by banks to GDP (B) and log market capitalization of listed companies to GDP (S) are the independent variables. The estimates of the intercept term are omitted. Standard errors are given in parentheses. Results are reported for a period of time from 1988 to 2012. Long run estimates of dynamic models and cointegration coefficients of ARDL models are reported. Estimators: (1-2) POLS: Dynamic autoregressive distributed lagged (ARDL) Pooled OLS, augmented with T-2 year dummies; (3-4) 2FE: Dynamic ARDL Two-way fixed effects, augmented with T-2 year dummies and N-1 country dummies; (5-6) MG: Dynamic ARDL Mean Group; (7-8) DLMG: Distributed lagged DL Mean Group; (9-10) CS-ARDL: Dynamic cross-sectional ARDL Chudik and Pesaran (2015a), augmented with three lags of the cross-sectional averages of the dependent and independent variables; (11-12) CS-DLMG: Cross-sectional DL Chudik et al. (2016) Mean Group, augmented with three lags of the cross-sectional averages of the independent variables. Models (1-6) and (9-10) are represented by a Error Correction Model (ECM) and are augmented with one lag of the dependent and independent variables. Standard errors of ARDL models are computed via the Delta method. DL models are augmented with one lag of the independent variables. White heteroskedasticity-robust standard errors are reported for models (1-4). For models (512) we report (i), the estimates of the outlier-robust mean of parameter coefficients across groups following Hamilton (1992); and (ii), nonparametric standard errors according to Pesaran and Smith (1995) and Pesaran (2006) (the latter only for (9-12)). Levels of significance are represented by * 10%, ** 5% and *** 1%. Diagnostics: See Table A1, except for the CIPS test.. CD-test statistic CD-test p-value RMSE NXT N. Cointegration coefficient. S. B. POLS (1). Dynamic models for banking development and growth from 1988-2012 POLS 2FE 2FE MG MG DLMG DLMG CS-ARDL CS-ARDL CS-DLMG CS-DLMG (2) (3) (4) (5) (6) (7) (8) (9) (10) (11) (12). TABLE A2. Stock Markets, Banks and Economic Growth in a Context of Common Shocks and Cross-Country Dependencies (Online Supplement).
(16) Stock Markets, Banks and Economic Growth in a Context of Common Shocks and Cross-Country Dependencies (Online Supplement). TABLE A3 Pooled and MG dynamic models for banking development and growth from 1961-2014 POLS 2FE 1 lag 2 lags 3 lags 1 lag 2 lags 3 lags (1) (2) (3) (4) (5) (6) B. Cointegration coefficient. CD-test statistic CD-test p-value RMSE NXT N. -0.296* -(0.177). -0.348* (0.201). -0.474* (0.245). -0.360 (0.282). -0.457 (0.296). -0.588* (0.339). -0.608*** (0.030). -0.535*** (0.032). -0.434*** (0.031). -0.740*** (0.032). -0.724*** (0.036). -0.647*** (0.038). -2.08 0.03 3.22 2615 54. -1.99 0.04 3.18 2561 54. -2.02 0.04 3.13 2507 54. -2.44 0.01 3.09 2615 54. -2.29 0.02 3.07 2561 54. -2.25 0.02 3.06 2507 54. Instituto Universitario de Análisis Económico y Social Documento de Trabajo 04/2017, 118 páginas, ISSN: 2172-7856 16.
(17) Stock Markets, Banks and Economic Growth in a Context of Common Shocks and Cross-Country Dependencies (Online Supplement). TABLE A3 (Continued) Pooled and MG dynamic models for banking development and growth from 1961-2014 MG DLMG 1 lag 2 lags 3 lags 1 lag 2 lags 3 lags (7) (8) (9) (10) (11) (12) B. -1.749*** (0.340). -1.903*** (0.386). -1.942*** (0.396). Cointegration coefficient. -0.763*** (0.023). -0.810*** (0.030). -0.779*** (0.030). 35.94 0.00 3.00 2615 54. 35.95 0.00 2.89 2561 54. 33.88 0.00 2.82 2507 54. CD-test statistic CD-test p-value RMSE NXT N. -1.903*** (0.322). -1.944*** (0.355). -1.957*** (0.364). 35.07 0.00 3.14 2657 54. 34.57 0.00 3.07 2605 54. 32.65 0.00 3.02 2553 54. Notes: GDP growth is the dependent variable. Log domestic credit to private sector by banks to GDP (B) is the independent variable. The estimates of the intercept term are omitted. Standard errors are given in parentheses. Results are reported for a period of time from 1961 to 2014. Long run estimates of dynamic models and cointegration coefficients of ARDL models are reported. Estimators: (1)-(3) POLS: Dynamic autoregressive distributed lagged (ARDL) Pooled OLS, augmented with T-2 year dummies; (4)-(6) 2FE: Dynamic ARDL Twoway fixed effects, augmented with T-2 year dummies and N-1 country dummies; (7)-(9) MG: Dynamic ARDL Mean Group Pesaran and Smith (1995); (10)-(12) DLMG: Distributed lagged DL Mean Group. Models (1)-(9) are represented by a Error Correction Model (ECM) and are augmented with one, two and three lags of the dependent and independent variables. Standard errors of ARDL models are computed via the Delta method. Models (10)-(12) are augmented with one, two and three lags of the independent variables. White heteroskedasticity-robust standard errors are reported for models (1)-(6). For models (7)-(12) we report (i), the estimates of the outlier-robust mean of parameter coefficients across groups following Hamilton (1992); and (ii), nonparametric standard errors according to Pesaran and Smith (1995). Levels of significance are represented by * 10%, ** 5% and *** 1%. Diagnostics: See Table A1, except for the CIPS test.. Instituto Universitario de Análisis Económico y Social Documento de Trabajo 04/2017, 118 páginas, ISSN: 2172-7856 17.
(18) Stock Markets, Banks and Economic Growth in a Context of Common Shocks and Cross-Country Dependencies (Online Supplement). TABLE A4 Dynamic CCEMG models for banking development and growth from 1961-2014 CS-ARDL CS-DLMG 1 lag 2 lags 3 lags 1 lag 2 lags 3 lags (1) (2) (3) (4) (5) (6) B. Cointegration coefficient. CD-test statistic CD-test p-value RMSE NXT N. -0.760* (0.413). -1.153** (0.529). -1.303** (0.563). -0.799*** (0.033). -0.831*** (0.039). -0.779*** (0.036). -1.98 0.04 2.45 2545 54. -1.43 0.15 2.36 2526 54. -1.28 0.20 2.3 2507 54. -1.069** (0.447). -1.193*** (0.441). -1.309*** (0.454). -1.50 0.13 2.69 2588 54. -1.46 0.14 2.63 2571 54. -1.07 0.28 2.59 2553 54. Notes: GDP growth is the dependent variable. Log domestic credit to private sector by banks to GDP (B) is the independent variable. The estimates of the intercept term are omitted. Standard errors are given in parentheses. Results are reported for a period of time from 1961 to 2014. Long run estimates of dynamic models and cointegration coefficients of ARDL models are reported. Estimators: (1)-(3) CS-ARDL: Dynamic crosssectional ARDL Chudik and Pesaran (2015a), augmented with three lags of the cross-sectional averages of the dependent and independent variables; (4)-(6) CS-DLMG: Cross-sectional DL Chudik et al. (2016) Mean Group, augmented with three lags of the cross-sectional averages of the independent variables. Models (1)-(3) are represented by a Error Correction Model (ECM) and are augmented with one, two and three lags of the dependent and independent variables. Standard errors of ARDL models are computed via the Delta method. Models (4)-(6) are augmented with one, two and three lags of the independent variables. White heteroskedasticity-robust standard errors are reported for models (1) and (2). For models (3)-(6) we report (i), the estimates of the outlier-robust mean of parameter coefficients across groups following Hamilton (1992); and (ii), nonparametric standard errors according to Pesaran and Smith (1995) and Pesaran (2006). Levels of significance are represented by * 10%, ** 5% and *** 1%. Diagnostics: See Table A1, except for the CIPS test.. Instituto Universitario de Análisis Económico y Social Documento de Trabajo 04/2017, 118 páginas, ISSN: 2172-7856 18.
(19) Stock Markets, Banks and Economic Growth in a Context of Common Shocks and Cross-Country Dependencies (Online Supplement). A5. ADDITIONAL RESULTS FOR TABLE 4: TABLES A5-A9. TABLE A5 Static models according to the basic specification for advanced countries POLS 2FE FD MG (1) (2) (3) (4) B. -0.657*** (0.207). -1.541*** (0.326). -4.116** (1.596). -5.548*** (0.835). S. 0.989*** (0.156). 1.781*** (0.286). 0.678 (0.590). 2.192*** (0.295). -2.12 0.03 I(0) 2.26 608 25. -2.61 0.00 I(1) 1.87 608 25. -0.89 0.37 I(0) 2.20 583 25. 29.42 0.00 I(1) 2.05 608 25. CD-test statistic CD-test p-value Order of Integration RMSE NXT N. Notes: GDP growth is the dependent variable. Log domestic credit to private sector by banks to GDP (B) and log market capitalization of listed companies to GDP (S) are the independent variables. The estimates of the intercept term are omitted. Standard errors are given in parentheses. Results are reported for a period of time from 1988 to 2012. Estimators: (1) POLS: Pooled OLS, augmented with T-1 year dummies; (2) 2FE: Two-way fixed effects, augmented with T-1 year dummies and N-1 country dummies; (3) FD: First Differences, augmented with T-2 year dummies; (4) MG: Mean Group Pesaran and Smith (1995). White heteroskedasticity-robust standard errors are reported for models (1)-(3). For model (4) we report (i), the estimates of the outlier-robust mean of parameter coefficients across groups following Hamilton (1992); and (ii), nonparametric standard errors according to Pesaran and Smith (1995). Levels of significance are represented by * 10%, ** 5% and *** 1%. Diagnostics: See Table A1.. Instituto Universitario de Análisis Económico y Social Documento de Trabajo 04/2017, 118 páginas, ISSN: 2172-7856 19.
(20) Stock Markets, Banks and Economic Growth in a Context of Common Shocks and Cross-Country Dependencies (Online Supplement). TABLE A6 Dynamic models according to the basic specification for advanced countries POLS 2FE MG DLMG (1) (2) (3) (4) B. -0.858** -1.770*** (0.363) (0.403). -5.631*** (1.039). -5.947*** (1.010). S. 1.109*** 2.421*** (0.277) (0.465). 3.406*** (0.495). 3.153*** (0.444). -0.479*** -0.746*** (0.061) (0.064). -0.912*** (0.046). Cointegration coefficient. CD-test statistic CD-test p-value RMSE NXT N. -1.30 0.19 1.92 583 25. -2.31 0.02 1.76 583 25. 22.59 0.00 1.68 583 25. 21.37 0.00 1.76 583 25. Notes: GDP growth is the dependent variable. Log domestic credit to private sector by banks to GDP (B) and log market capitalization of listed companies to GDP (S) are the independent variables. Standard errors are given in parentheses. Results are reported for a period of time from 1988 to 2012. Long run estimates of dynamic models and cointegration coefficients of ARDL models are reported. Estimators: (1) POLS: Dynamic autoregressive distributed lagged (ARDL) Pooled OLS, augmented with T-2 year dummies; (2) 2FE: Dynamic ARDL Two-way fixed effects, augmented with T-2 year dummies and N-1 country dummies; (3) MG: Dynamic ARDL Mean Group; (4) DLMG: Distributed lagged DL Mean Group. Models (1), (2) and (3) are represented by a Error Correction Model (ECM) and are augmented with one lag of the dependent and independent variables. Standard errors of ARDL models are computed via the Delta method. Model (4) is augmented with one lag of the independent variables. White heteroskedasticity-robust standard errors are reported for models (1) and (2). For models (3) and (4) we report (i), the estimates of the outlier-robust mean of parameter coefficients across groups following Hamilton (1992); and (ii), nonparametric standard errors according to Pesaran and Smith (1995). Levels of significance are represented by * 10%, ** 5% and *** 1%. Diagnostics: See Table A1, except for the CIPS test.. Instituto Universitario de Análisis Económico y Social Documento de Trabajo 04/2017, 118 páginas, ISSN: 2172-7856 20.
(21) Stock Markets, Banks and Economic Growth in a Context of Common Shocks and Cross-Country Dependencies (Online Supplement). TABLE A7 Static models according to the basic specification for emerging countries POLS 2FE FD CCEP MG (1) (2) (3) (4) (5) B. S. CD-test statistic CD-test p-value Order of Integration RMSE NXT N. 0.914*** (0.268). -0.529 (0.542). -1.627 (1.625). -2.054** (0.793). -1.111 (1.117). 0.031 0.940*** (0.172) (0.296). 1.001* (0.577). 1.777*** (0.461). 1.519*** (0.341). -2.00 0.04 I(0) 4.14 676 29. -1.82 0.06 I(0) 3.04 705 29. 13.01 0.00 I(0) 3.05 705 29. -2.26 0.02 I(0) 3.54 705 29. -2.39 0.01 I(1) 3.27 705 29. Notes: GDP growth is the dependent variable. Log domestic credit to private sector by banks to GDP (B) and log market capitalization of listed companies to GDP (S) are the independent variables. The estimates of the intercept term are omitted. Standard errors are given in parentheses. Results are reported for a period of time from 1988 to 2012. Estimators: (1) POLS: Pooled OLS, augmented with T-1 year dummies; (2) 2FE: Two-way fixed effects, augmented with T-1 year dummies and N-1 country dummies; (3) FD: First Differences, augmented with T-2 year dummies; (4) CCEP: Pooled Pesaran (2006), augmented with common country dummies and cross-section averages; (5) MG: Mean Group Pesaran and Smith (1995). White heteroskedasticity-robust standard errors are reported for models (1)-(4). For model (5) we report (i), the estimates of the outlier-robust mean of parameter coefficients across groups following Hamilton (1992); and (ii), nonparametric standard errors according to Pesaran and Smith (1995). Levels of significance are represented by * 10%, ** 5% and *** 1%. Diagnostics: See Table A1.. Instituto Universitario de Análisis Económico y Social Documento de Trabajo 04/2017, 118 páginas, ISSN: 2172-7856 21.
(22) Stock Markets, Banks and Economic Growth in a Context of Common Shocks and Cross-Country Dependencies (Online Supplement). TABLE A8 Dynamic models according to the basic specification for emerging countries POLS 2FE MG DLMG (1) (2) (3) (4) B. 0.627* (0.355). -1.256* (0.652). -1.974* (1.097). -2.828** (1.093). S. 0.084 (0.228). 1.058*** (0.386). 1.997*** (0.428). 1.966*** (0.424). -0.717*** (0.056). -0.873*** (0.061). -0.975*** (0.062). -2.25 0.02 3.30 676 29. -2.44 0.01 3.14 676 29. 8.04 0.00 2.58 676 29. Cointegration coefficient. CD-test statistic CD-test p-value RMSE NXT N. 9.54 0.00 2.69 676 29. Notes: GDP growth is the dependent variable. Log domestic credit to private sector by banks to GDP (B) and log market capitalization of listed companies to GDP (S) are the independent variables. Standard errors are given in parentheses. Results are reported for a period of time from 1988 to 2012. Long run estimates of dynamic models and cointegration coefficients of ARDL models are reported. Estimators: (1) POLS: Dynamic autoregressive distributed lagged (ARDL) Pooled OLS, augmented with T-2 year dummies; (2) 2FE: Dynamic ARDL Two-way fixed effects, augmented with T-2 year dummies and N-1 country dummies; (3) MG: Dynamic ARDL Mean Group; (4) DLMG: Distributed lagged DL Mean Group. Models (1), (2) and (3) are represented by a Error Correction Model (ECM) and are augmented with one lag of the dependent and independent variables. Standard errors of ARDL models are computed via the Delta method. Model (4) is augmented with one lag of the independent variables. White heteroskedasticityrobust standard errors are reported for models (1) and (2). For models (3) and (4) we report (i), the estimates of the outlier-robust mean of parameter coefficients across groups following Hamilton (1992); and (ii), nonparametric standard errors according to Pesaran and Smith (1995). Levels of significance are represented by * 10%, ** 5% and *** 1%. Diagnostics: See Table A1, except for the CIPS test.. Instituto Universitario de Análisis Económico y Social Documento de Trabajo 04/2017, 118 páginas, ISSN: 2172-7856 22.
(23) Stock Markets, Banks and Economic Growth in a Context of Common Shocks and Cross-Country Dependencies (Online Supplement). TABLE A9 Static and dynamic CCEMG models for advanced countries including full cross-section averages CCEMG CS-ARDL CS-DLMG (1) (2) (3) B. -4.178*** (1.360). -2.007 (2.777). -2.554 (2.896). S. 2.352*** (0.424). 1.999** (0.873). 2.244*** (0.624). Cointegration coefficient. CD-test statistic CD-test p-value Order of Integration RMSE NXT N. -1.207*** (0.118) 7.23 0.00 I(0) 1.49 608 25. 2.02 0.04. 2.69 0.00. 0.56 502 23. 0.82 536 25. Notes: GDP growth is the dependent variable. Log domestic credit to private sector by banks to GDP (B) and log market capitalization of listed companies to GDP (S) are the independent variables. The estimates of the intercept term are omitted. Long run estimates of dynamic models and cointegration coefficients of ARDL models are reported. Standard errors of ARDL specifications are computed via the Delta method. Standard errors are given in parentheses. Results are reported for a period of time from 1988 to 2012. Estimators: (1) CCEMG: Common Correlated Effects MG Pesaran (2006), augmented with cross-section averages; (2) CSARDL: Dynamic cross-sectional ARDL Chudik and Pesaran (2015a) represented by a Error Correction Model (ECM), augmented with one lag of the dependent and independent variables and three lags of the crosssectional averages of the dependent and independent variables; (3) CS-DLMG: Cross-sectional DL Chudik et al. (2016) Mean Group, augmented with one lag of the independent variable and three lags of the crosssectional averages of the independent variables. For advanced countries we compute the cross-section averages based on the full sample. For these models we report (i), the estimates of the outlier-robust mean of parameter coefficients across groups following Hamilton (1992); and (ii), nonparametric standard errors according to Pesaran and Smith (1995) and Pesaran (2006). Levels of significance are represented by * 10%, ** 5% and *** 1%. Diagnostics: See Table A1 Except for the CIPS test.. Instituto Universitario de Análisis Económico y Social Documento de Trabajo 04/2017, 118 páginas, ISSN: 2172-7856 23.
(24) Stock Markets, Banks and Economic Growth in a Context of Common Shocks and Cross-Country Dependencies (Online Supplement). A6. ADDITIONAL RESULTS FOR TABLE 5: TABLES A10-A15. TABLE A10 Static CCEMG models for advanced countries including additional regressors (1) (2) (3) (4) (5) B. -5.160*** -3.751*** (1.452) (1.243). S. 1.201* (0.676). TR. 3.231 (2.392). GCE. 0.944* (0.510). -2.653** (1.215) 0.965** (0.461). -4.235** -3.458*** (1.824) (1.218) 0.978 (0.603). -11.694*** (2.951). GFK. 6.016*** (0.955). GD. -1.959 (1.289). PG. CD-test statistic CD-test p-value Order of Integration RMSE NXT N. 1.671*** (0.474). -0.479 (0.606) -0.12 0.90 I(1) 1.30 608 25. 0.42 0.67 I(1) 1.21 608 25. 1.51 0.13 I(0) 1.23 608 25. 0.33 0.74 I(0) 1.22 606 25. 10.78 0.00 I(0) 1.30 608 25. Notes: GDP growth is the dependent variable. Log domestic credit to private sector by banks to GDP (B) and log market capitalization of listed companies to GDP (S) are the main independent variables. We include additional regressors such as the log trade to GDP (TR), log general government final consumption expenditure to GDP (GCE), log gross fixed capital formation to GDP (GFK), log total (domestic plus external) gross (central and/or general) government debt to GDP (GD), and population growth (PG). The estimates of the intercept term are omitted. Standard errors are given in parentheses. Results are reported for a period of time from 1988 to 2012. We use the Common Correlated Effects MG Pesaran (2006) estimator augmented with cross-section averages of the dependent and independent variables. We compute the cross-section averages based on advanced countries plus China. Here we report (i), the estimates of the outlierrobust mean of parameter coefficients across groups following Hamilton (1992); and (ii), nonparametric standard errors according to Pesaran and Smith (1995) and Pesaran (2006). Levels of significance are represented by * 10%, ** 5% and *** 1%. Diagnostics: See Table A1.. Instituto Universitario de Análisis Económico y Social Documento de Trabajo 04/2017, 118 páginas, ISSN: 2172-7856 24.
(25) Stock Markets, Banks and Economic Growth in a Context of Common Shocks and Cross-Country Dependencies (Online Supplement). TABLE A11 Static CCEMG models for emerging countries including additional regressors (1) (2) (3) (4) (5) B. -3.216* (1.456). -2.015* (1.178). -4.043*** (1.403). -4.074*** (1.545). -2.972** (1.425). S. 1.539*** (0.362). 1.731*** (0.443). 1.294*** (0.377). 1.647*** (0.440). 1.681*** (0.413). TR. 1.828 (2.064). GCE. -1.598 (2.407). GFK. 6.165*** (1.740). GD. -3.691*** (1.137). PG. CD-test statistic CD-test p-value Order of Integration RMSE NXT N. -0.064 (1.290) -1.92 0.05 I(0) 2.25 705 29. -1.82 0.06 I(0) 2.30 701 29. Notes: See Table A10.. Instituto Universitario de Análisis Económico y Social Documento de Trabajo 04/2017, 118 páginas, ISSN: 2172-7856 25. -2.05 0.04 I(0) 2.27 701 29. -2.34 0.01 I(0) 2.21 688 29. -2.11 0.03 I(0) 2.34 705 29.
(26) Stock Markets, Banks and Economic Growth in a Context of Common Shocks and Cross-Country Dependencies (Online Supplement). TABLE A12 Dynamic models including general government final consumption expenditure to GDP as an additional regressor POLS 2FE MG DLMG CS-DLMG (1) (2) (3) (4) (5) B. -0.594** -1.850*** (0.271) (0.471). -2.548*** (0.861). -2.883*** (0.801). -4.867* (2.753). S. 0.701*** 1.719*** (0.179) (0.310). 1.871*** (0.317). 1.913*** (0.311). 2.553** (1.141). -7.802*** (1.781). -1.977 (9.228). 12.11 0.00 1.86 1255 54. -1.96 0.05 0.59 1052 48. GCE. -2.861*** (0.480). -2.490* (1.383). -7.225*** (1.954). Cointegration coefficient. -0.615*** -0.822*** (0.044) (0.048). -1.061*** (0.036). CD-test statistic CD-test p-value RMSE NXT N. -0.35 0.72 2.80 1255 54. -0.71 0.48 2.62 1255 54. 10.17 0.00 1.78 1255 54. Notes: GDP growth is the dependent variable. Log domestic credit to private sector by banks to GDP (B) and log market capitalization of listed companies to GDP (S) are the independent variables. Log general government final consumption expenditure to GDP (GCE) is included as an additional regressor. The estimates of the intercept term are omitted. Standard errors are given in parentheses. Results are reported for a period of time from 1988 to 2012. Long run estimates of dynamic models and cointegration coefficients of ARDL models are reported. Estimators: (1) POLS: Dynamic autoregressive distributed lagged (ARDL) Pooled OLS, augmented with T-2 year dummies; (2) 2FE: Dynamic ARDL Two-way fixed effects, augmented with T-2 year dummies and N-1 country dummies; (3) MG: Dynamic ARDL Mean Group Pesaran and Smith (1995); (4) DLMG: Distributed lagged DL Mean Group; (5) CS-DLMG: Cross-sectional DL Chudik et al. (2016) Mean Group, augmented with three lags of the cross-sectional averages of the independent variables. Models (1), (2) and (3) are represented by a Error Correction Model (ECM) and are augmented with one lag of the dependent and independent variables. Standard errors of ARDL models are computed via the Delta method. Models (4) and (5) are augmented with one lag of the independent variables. White heteroskedasticity-robust standard errors are reported for models (1) and (2). For models (3)-(5) we report (i), the estimates of the outlier-robust mean of parameter coefficients across groups following Hamilton (1992); and (ii), nonparametric standard errors according to Pesaran and Smith (1995) and Pesaran (2006) (the latter only for (5) and (6)). Levels of significance are represented by * 10%, ** 5% and *** 1%. Diagnostics: See Table A1, except for the CIPS test.. Instituto Universitario de Análisis Económico y Social Documento de Trabajo 04/2017, 118 páginas, ISSN: 2172-7856 26.
(27) Stock Markets, Banks and Economic Growth in a Context of Common Shocks and Cross-Country Dependencies (Online Supplement). TABLE A13 Dynamic models including trade to GDP as an additional regressor POLS 2FE MG DLMG CS-DLMG (1) (2) (3) (4) (5) B. -1.099*** -1.782*** (0.262) (0.414). -4.125*** (0.978). -5.060*** (0.947). 0.164 (2.945). S. 0.518*** 1.710*** (0.187) (0.278). 2.511*** (0.375). 2.650*** (0.365). 2.341** (1.159). TR. 0.640*** (0.237). 0.999 (0.778). -1.212*** (1.362). -1.011 (1.295). 15.269** (6.945). -0.585*** -0.827*** (0.042) (0.046). -0.976*** (0.044) 14.99 0.00 1.92 1259 54. -0.22 0.82 0.56 1074 49. Cointegration coefficient. CD-test statistic CD-test p-value RMSE NXT N. -0.92 0.35 2.83 1259 54. -1.23 0.21 2.60 1259 54. 13.94 0.00 1.80 1259 54. Notes: GDP growth is the dependent variable. Log domestic credit to private sector by banks to GDP (B) and log market capitalization of listed companies to GDP (S) are the independent variables. Log trade to GDP (TR) is included as an additional regressor. For additional details see Table A12. For diagnostics see Table A1, except for the CIPS test.. Instituto Universitario de Análisis Económico y Social Documento de Trabajo 04/2017, 118 páginas, ISSN: 2172-7856 27.
(28) Stock Markets, Banks and Economic Growth in a Context of Common Shocks and Cross-Country Dependencies (Online Supplement). TABLE A14 Dynamic models including gross fixed capital formation to GDP as an additional regressor POLS 2FE MG DLMG CS-DLMG (1) (2) (3) (4) (5) B. -1.141*** -1.538*** (0.207) (0.356). -2.161*** (0.482). -2.537*** (0.576). -3.868 (2.631). S. 0.334** 1.087*** (0.140) (0.265). 1.757*** (0.245). 2.037*** (0.287). 2.096** (0.828). 4.508*** 2.871*** (0.547) (0.807). 2.714** (1.242). 2.134* (1.176). 3.126 (4.455). -0.720*** -0.909*** (0.041) (0.045). -1.135*** (0.039) 24.62 0.00 1.78 1255 54. 0.84 0.40 0.53 1052 48. GFK. Cointegration coefficient. CD-test statistic CD-test p-value RMSE NXT N. -0.68 0.49 2.60 1255 54. -0.86 0.38 2.41 1255 54. 21.97 0.00 1.67 1255 54. Notes: GDP growth is the dependent variable. Log domestic credit to private sector by banks to GDP (B) and log market capitalization of listed companies to GDP (S) are the independent variables. Log gross fixed capital formation to GDP (GFK) is included separately as an additional regressors. For additional details see Table A12. For diagnostics see Table A1, except for the CIPS test.. Instituto Universitario de Análisis Económico y Social Documento de Trabajo 04/2017, 118 páginas, ISSN: 2172-7856 28.
(29) Stock Markets, Banks and Economic Growth in a Context of Common Shocks and Cross-Country Dependencies (Online Supplement). TABLE A15 Dynamic models including inflation as an additional regressors POLS 2FE MG DLMG CS-DLMG (6) (7) (8) (9) (10) B. -0.880*** (0.297). -1.902*** (0.434). -3.975*** (0.916). -4.054*** (0.917). 0.038 (3.501). S. 0.682*** (0.195). 1.925*** (0.289). 2.252*** (0.328). 2.258*** (0.305). 2.206 (1.504). 0.305 (0.215). 0.204 (0.201). -0.398 (0.213). -0.251 (0.208). 0.247 (0.937). -0.569*** (0.042). -0.812*** (0.048). -0.939*** (0.044). -0.76 0.44 2.85 1249 54. -1.06 0.29 2.63 1249 54. 21.39 0.00 1.92 1249 54. 21.31 0.00 2.02 1249 54. 5.04 0.00 0.56 965 44. INFL. Cointegration coefficient. CD-test statistic CD-test p-value RMSE NXT N. Notes: GDP growth is the dependent variable. Log domestic credit to private sector by banks to GDP (B) and log market capitalization of listed companies to GDP (S) are the independent variables. Log of inflation (INFL) is included separately as an additional regressors. For additional details see Table A12. For diagnostics see Table A1, except for the CIPS test.. Instituto Universitario de Análisis Económico y Social Documento de Trabajo 04/2017, 118 páginas, ISSN: 2172-7856 29.
(30) Stock Markets, Banks and Economic Growth in a Context of Common Shocks and Cross-Country Dependencies (Online Supplement). A7. ADDITIONAL RESULTS FOR TABLE 6: TABLES A16-A34. TABLE A16 Static CCEMG models including additional regressors and the total value of stocks traded to GDP as a proxy for stock markets development (1) (2) (3) (4) (5) (6) (7) B. -3.528*** (1.019). -3.803*** (1.009). -5.588*** (0.990). -5.499*** (1.077). -4.067*** (0.990). -3.139*** (0.797). -4.385*** (0.719). STV. 0.960*** (0.193). 0.963*** (0.200). 1.017*** (0.187). 1.020*** (0.176). 0.933*** (0.184). 1.428*** (0.219). 1.206*** (0.189). TR. 3.691** (1.669). -2.284*** (0.718). -0.282 (0.312). GCE. -9.589*** (2.348). GFK. 7.927*** (1.385). GD. -3.112*** (0.694). PG. 0.044 (0.569). BC. BxBC. -2.277** (1.021). SxBC. CD-test statistic CD-test p-value Order of Integration RMSE NXT N. -0.089 (0.166) 0.94 0.34 I(0) 1.80 1309 54. 1.79 0.07 I(0) 1.81 1305 54. 1.93 0.05 I(0) 1.78 1305 54. Instituto Universitario de Análisis Económico y Social Documento de Trabajo 04/2017, 118 páginas, ISSN: 2172-7856 30. 2.61 0.00 I(0) 1.74 1290 54. 0.72 0.47 I(0) 1.84 1309 54. 2.56 0.01 I(0) 1.68 1260 54. 2.71 0.00 I(0) 1.62 1208 54.
(31) Stock Markets, Banks and Economic Growth in a Context of Common Shocks and Cross-Country Dependencies (Online Supplement). TABLE A16 (Continued) Static CCEMG models including additional regressors and the total value of stocks traded to GDP as a proxy for stock markets development Notes: GDP growth is the dependent variable. Log domestic credit to private sector by banks to GDP (B) and log total value of stocks traded to GDP (STV) are the main independent variables. We include additional regressors such as those included in Table A10, a banking crisis dummy (1=banking crisis, 0=none) (BC), the interaction between the dummy of banking crisis and the log domestic credit to private sector by banks to GDP (BxBC), and the interaction between the dummy of banking crisis and log market capitalization of listed companies to GDP (SxBC). The estimates of the intercept term are omitted. Standard errors are given in parentheses. Results are reported for a period of time from 1988 to 2012, except for those models which include banking crisis dummies where the time frame is from 1988-2011. We use the Common Correlated Effects MG Pesaran (2006) estimator augmented with cross-section averages of the dependent and independent variables. Here we report (i), the estimates of the outlier-robust mean of parameter coefficients across groups following Hamilton (1992); and (ii), nonparametric standard errors according to Pesaran and Smith (1995) and Pesaran (2006). Levels of significance are represented by * 10%, ** 5% and *** 1%. Diagnostics: See Table A1.. Instituto Universitario de Análisis Económico y Social Documento de Trabajo 04/2017, 118 páginas, ISSN: 2172-7856 31.
(32) Stock Markets, Banks and Economic Growth in a Context of Common Shocks and Cross-Country Dependencies (Online Supplement). TABLE A17 Static CCEMG models for advanced countries including additional regressors and the total value of stocks traded to GDP as a proxy for stock markets development (1) (2) (3) (4) (5) B. STV. TR. -4.248*** (1.214). -3.391*** (1.097). -2.965* (1.547). -2.579 (1.706). -4.832*** (1.587). 1.052*** (0.362). 0.772*** (0.252). 0.472** (0.230). 0.801** (0.317). 0.935*** (0.276). 4.473* (2.568). GCE. -10.711*** (2.815). GFK. 9.071*** (1.759). GD. -1.848 (1.446). PG. CD-test statistic CD-test p-value Order of Integration RMSE NXT N. -0.180 (0.528) -0.39 0.69 I(0) 1.29 605 25. 1.09 0.27 I(0) 1.20 605 25. Notes: See Table A16. Instituto Universitario de Análisis Económico y Social Documento de Trabajo 04/2017, 118 páginas, ISSN: 2172-7856 32. 1.86 0.06 I(0) 1.16 605 25. 0.78 0.43 I(0) 1.15 603 25. 9.07 0.00 I(0) 1.26 605 25.
(33) Stock Markets, Banks and Economic Growth in a Context of Common Shocks and Cross-Country Dependencies (Online Supplement). TABLE A18 Static CCEMG models for emerging countries including additional regressors and the total value of stocks traded to GDP as a proxy for stock markets development (1) (2) (3) (4) (5) B. -2.716** (1.271). -2.275** (1.125). -5.276*** (1.314). -4.782*** (1.311). -3.332** (1.301). STV. 0.979*** (0.305). 1.156*** (0.327). 0.862*** (0.285). 0.964*** (0.266). 0.910*** (0.249). TR. 0.146 (2.161). GCE. -3.874 (2.966). GFK. 6.944*** (1.934). GD. -4.578*** (0.946). PG. CD-test statistic CD-test p-value Order of Integration RMSE NXT N. 0.174 (1.257) -1.93 0.05 I(0) 2.11 704 29. -1.67 0.09 I(0) 2.18 700 29. Notes: See Table A16. Instituto Universitario de Análisis Económico y Social Documento de Trabajo 04/2017, 118 páginas, ISSN: 2172-7856 33. -1.96 0.04 I(0) 2.14 700 29. -2.61 0.00 I(0) 2.07 687 29. -2.17 0.03 I(0) 2.23 704 29.
(34) Stock Markets, Banks and Economic Growth in a Context of Common Shocks and Cross-Country Dependencies (Online Supplement). TABLE A19 Static CCEMG models including additional regressors and the turnover ratio of stocks traded as a proxy for stock markets development (1) (2) (3) (4) (5) (6) (7) B. -3.246*** (1.017). -3.854*** (0.940). -5.533*** (1.115). -4.690*** (1.011). -3.659*** (0.887). -3.180*** (0.999). -3.960*** (0.931). MTR. 0.346 (0.253). 0.317 (0.210). 0.585** (0.264). 0.452 (0.281). 0.476* (0.286). 0.911*** (0.300). 0.388 (0.269). TR. 3.995** (1.725). -1.252** (0.564). -0.483 (0.343). GCE. -8.094*** (2.163). GFK. 8.325*** (1.186). GD. -3.525*** (0.777). PG. 0.052 (0.539). BC. BxBC. -0.727 (0.656). SxBC. CD-test statistic CD-test p-value Order of Integration RMSE NXT N. 0.129 (0.140) 1.89 0.05 I(0) 1.77 1257 54. 1.62 0.10 I(0) 1.76 1253 54. 1.54 0.12 I(0) 1.72 1253 54. Instituto Universitario de Análisis Económico y Social Documento de Trabajo 04/2017, 118 páginas, ISSN: 2172-7856 34. 2.13 0.03 I(0) 1.68 1238 54. 1.70 0.08 I(0) 1.79 1257 54. 3.39 0.00 I(0) 1.59 1208 54. 1.75 0.07 I(0) 1.64 1208 54.
(35) Stock Markets, Banks and Economic Growth in a Context of Common Shocks and Cross-Country Dependencies (Online Supplement). TABLE A19 (Continued) Static CCEMG models including additional regressors and the turnover ratio of stocks traded as a proxy for stock markets development Notes: GDP growth is the dependent variable. Log domestic credit to private sector by banks to GDP (B) and log turnover ratio of stocks traded (MTR) are the main independent variables. We include additional regressors such as those included in Table A12. The estimates of the intercept term are omitted. Standard errors are given in parentheses. Results are reported for a period of time from 1989 to 2012, except for those models which include banking crisis dummies where the time frame is from 1989-2011. We use the Common Correlated Effects MG Pesaran (2006) estimator augmented with cross-section averages of the dependent and independent variables. Here we report (i), the estimates of the outlier-robust mean of parameter coefficients across groups following Hamilton (1992); and (ii), nonparametric standard errors according to Pesaran and Smith (1995) and Pesaran (2006). Levels of significance are represented by * 10%, ** 5% and *** 1%. Diagnostics: See Table A1.. Instituto Universitario de Análisis Económico y Social Documento de Trabajo 04/2017, 118 páginas, ISSN: 2172-7856 35.
(36) Stock Markets, Banks and Economic Growth in a Context of Common Shocks and Cross-Country Dependencies (Online Supplement). TABLE A20 Static CCEMG models for advanced countries including additional regressors and the turnover ratio of stocks traded as a proxy for stock markets development (1) (2) (3) (4) (5) B. -4.670*** (1.570). -3.078*** (1.026). -2.578* (1.336). -1.576 (1.259). -4.443*** (1.349). MTR. 0.293 (0.236). 0.119 (0.274). -0.028 (0.297). 0.190 (0.285). 0.159 (0.423). TR. 5.087** (2.404). GCE. -10.189*** (2.899). GFK. 8.956*** (1.840). GD. -1.992* (1.167). PG. CD-test statistic CD-test p-value Order of Integration RMSE NXT N. -0.874* (0.499) -0.66 0.51 I(1) 1.32 581 25. 1.33 0.18 I(0) 1.21 581 25. Notes: See Table A19.. Instituto Universitario de Análisis Económico y Social Documento de Trabajo 04/2017, 118 páginas, ISSN: 2172-7856 36. 1.80 0.07 I(0) 1.15 581 25. 1.30 0.19 I(0) 1.16 579 25. 11.34 0.00 I(1) 1.29 581 25.
(37) Stock Markets, Banks and Economic Growth in a Context of Common Shocks and Cross-Country Dependencies (Online Supplement). TABLE A21 Static CCEMG models for emerging countries including additional regressors and the turnover ratio of stocks traded as a proxy for stock markets development (1) (2) (3) (4) (5) B. -3.312** (1.392). -3.045** (1.278). -6.124*** (1.458). -5.775*** (1.568). -3.401*** (1.251). MTR. 0.755* (0.458). 0.419 (0.342). 0.894** (0.345). 0.868** (0.347). 0.765** (0.377). TR. 0.901 (2.088). GCE. -2.547 (2.646). GFK. 6.687*** (1.425). GD. -5.457*** (1.209). PG. CD-test statistic CD-test p-value Order of Integration RMSE NXT N. 1.010 (1.092) -1.75 0.08 I(0) 2.04 676 29. -1.73 0.08 I(0) 2.08 672 29. Notes: See Table A19.. Instituto Universitario de Análisis Económico y Social Documento de Trabajo 04/2017, 118 páginas, ISSN: 2172-7856 37. -2.13 0.03 I(0) 2.02 672 29. -2.41 0.01 I(0) 1.95 659 29. -2.16 0.03 I(0) 2.23 676 29.
(38) Stock Markets, Banks and Economic Growth in a Context of Common Shocks and Cross-Country Dependencies (Online Supplement). TABLE A22 Static CCEMG models including additional regressors and per capita GDP growth as a proxy for economic growth (1) (2) (3) (4) (5) (6) (7) B. -3.334*** (1.132). -3.833*** (0.984). -4.472*** (0.968). -4.398*** (1.167). -3.795*** (0.876). -3.976*** (0.977). -4.757*** (0.826). S. 1.838*** (0.264). 1.619*** (0.314). 1.671*** (0.290). 1.909*** (0.329). 0.409 (0.281). 1.872*** (0.356). 1.801*** (0.334). BC. -0.366 (0.417). -0.441 (0.300). BxBC. -0.612 (0.503). TR. 3.090** (1.411). GCE. -7.204*** (2.289). GFK. 6.360*** (1.229). GD. -1.724** (0.786). PG. -0.579 (0.444). SxBC. CD-test statistic CD-test p-value Order of Integration RMSE NXT N. 0.245 (0.244) 0.38 0.70 I(0) 1.89 1313 54. 0.42 0.67 I(0) 1.90 1309 54. 0.76 0.44 I(0) 1.89 1309 54. Instituto Universitario de Análisis Económico y Social Documento de Trabajo 04/2017, 118 páginas, ISSN: 2172-7856 38. 0.60 0.54 I(0) 1.85 1294 54. 1.64 0.10 I(0) 1.81 1257 54. 1.74 0.08 I(0) 1.80 1264 54. 2.56 0.01 I(0) 1.72 1208 54.
(39) Stock Markets, Banks and Economic Growth in a Context of Common Shocks and Cross-Country Dependencies (Online Supplement). TABLE A22 (Continued) Static CCEMG models including additional regressors and per capita GDP growth as a proxy for economic growth Notes: GDP per capita growth is the dependent variable. Log domestic credit to private sector by banks to GDP (B) and log market capitalization of listed companies to GDP (S) are the main independent variables. We include additional regressors such as those included in Table A12. The estimates of the intercept term are omitted. Standard errors are given in parentheses. Results are reported for a period of time from 1988 to 2012, except for those models which include banking crisis dummies where the time frame is from 1988-2011. We use the Common Correlated Effects MG Pesaran (2006) estimator augmented with cross-section averages of the dependent and independent variables. Here we report (i), the estimates of the outlier-robust mean of parameter coefficients across groups following Hamilton (1992); and (ii), nonparametric standard errors according to Pesaran and Smith (1995) and Pesaran (2006). Levels of significance are represented by * 10%, ** 5% and *** 1%. Diagnostics: See Table A1.. Instituto Universitario de Análisis Económico y Social Documento de Trabajo 04/2017, 118 páginas, ISSN: 2172-7856 39.
(40) Stock Markets, Banks and Economic Growth in a Context of Common Shocks and Cross-Country Dependencies (Online Supplement). TABLE A23 Static CCEMG models for advanced countries including additional regressors and per capita GDP growth as a proxy for economic growth (1) (2) (3) (4) (5) B. -3.875*** (1.233). -3.236*** (1.204). -2.843** (1.430). -3.329* (1.851). -3.946*** (1.253). S. 1.118* (0.611). 1.068** (0.514). 1.145** (0.491). 1.101* (0.631). 0.148 (0.434). TR. 3.999* (2.106). GCE. -9.567*** (2.814). GFK. 4.859*** (1.274). GD. -1.623 (1.148). PG. CD-test statistic CD-test p-value Order of Integration RMSE NXT N. -1.178** (0.471) -0.25 0.79 I(0) 1.29 608 25. 0.62 0.53 I(1) 1.22 608 25. Notes: See Table A22.. Instituto Universitario de Análisis Económico y Social Documento de Trabajo 04/2017, 118 páginas, ISSN: 2172-7856 40. 1.41 0.16 I(0) 1.27 608 25. 0.09 0.93 I(0) 1.25 606 25. 11.81 0.00 I(1) 1.34 581 25.
(41) Stock Markets, Banks and Economic Growth in a Context of Common Shocks and Cross-Country Dependencies (Online Supplement). TABLE A24 Static CCEMG models for emerging countries including additional regressors and per capita GDP growth as a proxy for economic growth (1) (2) (3) (4) (5) B. -3.406** (1.470). -2.249* (1.222). -4.203*** (1.421). -4.084*** (1.497). -3.477*** (1.283). S. 1.641*** (0.375). 1.836*** (0.463). 1.424*** (0.391). 1.458*** (0.418). 0.495** (0.247). TR. 2.099 (1.985). GCE. -1.935 (2.385). GFK. 6.190*** (1.693). GD. -3.647*** (1.117). PG. CD-test statistic CD-test p-value Order of Integration RMSE NXT N. 0.026 (1.122) -1.79 0.07 I(0) 2.24 705 29. -1.75 0.07 I(0) 2.30 701 29. Notes: See Table A22.. Instituto Universitario de Análisis Económico y Social Documento de Trabajo 04/2017, 118 páginas, ISSN: 2172-7856 41. -1.75 0.08 I(0) 2.26 701 29. -2.09 0.03 I(0) 2.20 688 29. -2.07 0.03 I(0) 2.13 676 29.
(42) Stock Markets, Banks and Economic Growth in a Context of Common Shocks and Cross-Country Dependencies (Online Supplement). TABLE A25 Static CCEMG models including additional regressors and liquid liabilities as a proxy for banking sector development (1) (2) (3) (4) (5) (6) (7) LL. -3.683*** (1.114). -2.445** (1.065). -4.896*** (1.001). -5.092*** (1.140). -4.582*** (1.101). -5.898*** (1.269). -6.577*** (1.126). S. 1.509*** (0.271). 1.527*** (0.350). 1.594*** (0.286). 1.818*** (0.387). 1.734*** (0.359). 2.057*** (0.348). 1.631*** (0.347). TR. 4.306*** (1.619). BC. -0.123 (0.541). 0.457 (0.324). BxBC. -1.161* (0.702). GCE. -8.345*** (2.521). GFK. 3.637*** (1.322). GD. -1.728* (0.902). PG. -0.548 (0.621). SxBC. CD-test statistic CD-test p-value Order of Integration RMSE NXT N. 0.372 (0.328) 1.15 0.24 I(0) 1.93 1261 52. -0.02 0.98 I(0) 1.94 1257 52. 0.20 0.84 I(0) 1.91 1257 52. Instituto Universitario de Análisis Económico y Social Documento de Trabajo 04/2017, 118 páginas, ISSN: 2172-7856 42. 0.78 0.43 I(0) 1.92 1242 52. 1.55 0.12 I(0) 1.98 1261 52. 1.88 0.06 I(0) 1.80 1213 52. 1.85 0.06 I(0) 1.79 1161 52.
(43) Stock Markets, Banks and Economic Growth in a Context of Common Shocks and Cross-Country Dependencies (Online Supplement). TABLE A25 (Continued) Static CCEMG models including additional regressors and liquid liabilities as a proxy for banking sector development Notes: GDP per capita growth is the dependent variable. Log liquid liabilities to GDP (LL) and log market capitalization of listed companies to GDP (S) are the main independent variables. We include additional regressors such as those included in Table A12. The estimates of the intercept term are omitted. Standard errors are given in parentheses. Results are reported for a period of time from 1988 to 2012, except for those models which include banking crisis dummies where the time frame is from 1988-2011. We use the Common Correlated Effects MG Pesaran (2006) estimator augmented with crosssection averages of the dependent and independent variables. Here we report (i), the estimates of the outlier-robust mean of parameter coefficients across groups following Hamilton (1992); and (ii), nonparametric standard errors according to Pesaran and Smith (1995) and Pesaran (2006). Levels of significance are represented by * 10%, ** 5% and *** 1%. Diagnostics: See Table A1.. Instituto Universitario de Análisis Económico y Social Documento de Trabajo 04/2017, 118 páginas, ISSN: 2172-7856 43.
(44) Stock Markets, Banks and Economic Growth in a Context of Common Shocks and Cross-Country Dependencies (Online Supplement). TABLE A26 Static CCEMG models for advanced countries including additional regressors and liquid liabilities as a proxy for banking sector development (1) (2) (3) (4) (5) LL. -4.108*** (0.946). -1.757 (1.292). -2.535** (1.239). -3.031** (1.379). -2.909** (1.352). S. 0.878 (0.540). 0.927** (0.462). 0.939*** (0.432). 0.752 (0.644). 1.701*** (0.533). TR. 4.548 (2.978). GCE. -13.478*** (3.715). GFK. 4.634*** (1.066). GD. -2.020** (0.923). PG. CD-test statistic CD-test p-value Order of Integration RMSE NXT N. -0.087 (0.651) -0.9 0.37 I(0) 1.18 579 24. -0.7 0.48 I(0) 1.19 579 24. Notes: See Table A25.. Instituto Universitario de Análisis Económico y Social Documento de Trabajo 04/2017, 118 páginas, ISSN: 2172-7856 44. 0.83 0.40 I(0) 1.20 579 24. 0.42 0.67 I(0) 1.21 577 24. 10.27 0.00 I(0) 1.28 579 24.
(45) Stock Markets, Banks and Economic Growth in a Context of Common Shocks and Cross-Country Dependencies (Online Supplement). TABLE A27 Static CCEMG models for emerging countries including additional regressors and liquid liabilities as a proxy for banking sector development (1) (2) (3) (4) (5) LL. S. TR. -4.882*** (1.857). -2.910 (1.822). -5.068*** (1.493). -6.432*** (1.778). -5.445*** (1.536). 1.580*** (0.361). 1.698*** (0.515). 1.301*** (0.299). 1.713*** (0.533). 1.722*** (0.518). 2.085 (2.392). GCE. -2.480 (2.749). GFK. 4.137*** (1.568). GD. -2.824** (1.426). PG. CD-test statistic CD-test p-value Order of Integration RMSE NXT N. -0.054 (1.469) -2.27 0.02 I(0) 2.35 682 28. -1.39 0.16 I(0) 2.37 678 28. Notes: See Table A25.. Instituto Universitario de Análisis Económico y Social Documento de Trabajo 04/2017, 118 páginas, ISSN: 2172-7856 45. -1.69 0.09 I(0) 2.32 678 28. -1.99 0.04 I(0) 2.33 665 28. -1.68 0.09 I(0) 2.42 682 28.
(46) Stock Markets, Banks and Economic Growth in a Context of Common Shocks and Cross-Country Dependencies (Online Supplement). TABLE A28 Static CCEMG models including additional regressors and bank lending-deposit spread as a proxy for banking sector development (1) (2) (3) (4) (5) SP. -0.702 (0.532). -0.832 (0.775). -0.480 (0.788). -0.418 (1.069). -0.869 (0.765). S. 1.064* (0.492). 1.547*** (0.478). 1.117*** (0.378). 0.975* (0.511). 1.076* (0.570). TR. 2.857 (1.799). GCE. -4.676* (2.817). GFK. 3.886** (1.847). GD. -0.769 (1.202). PG. CD-test statistic CD-test p-value Order of Integration RMSE NXT N. 1.307 (1.037) 0.48 0.63 I(0) 1.92 615 26. -0.59 0.55 I(0) 1.88 611 26. -1.07 0.28 I(0) 1.93 611 26. -0.57 0.56 I(0) 1.96 600 26. 0.34 0.73 I(0) 1.97 615 26. Notes: GDP per capita growth is the dependent variable. Log liquid liabilities to GDP (LL) and log market capitalization of listed companies to GDP (S) are the main independent variables. We include additional regressors such as those included in Table A10. The estimates of the intercept term are omitted. Standard errors are given in parentheses. Results are reported for a period of time from 1988 to 2012. We use the Common Correlated Effects MG Pesaran (2006) estimator augmented with cross-section averages of the dependent and independent variables. Here we report (i), the estimates of the outlier-robust mean of parameter coefficients across groups following Hamilton (1992); and (ii), nonparametric standard errors according to Pesaran and Smith (1995) and Pesaran (2006). Levels of significance are represented by * 10%, ** 5% and *** 1%. Diagnostics: See Table A1.. Instituto Universitario de Análisis Económico y Social Documento de Trabajo 04/2017, 118 páginas, ISSN: 2172-7856 46.
Figure
+7
Documento similar