BIBLIOTECAS DEL TECNOLÓGICO DE MONTERREY
PUBLICACIÓN DE TRABAJOS DE GRADO
Las Bibliotecas del Sistema Tecnológico de Monterrey son depositarias de los trabajos recepcionales y de
grado que generan sus egresados. De esta manera, con el objeto de preservarlos y salvaguardarlos como
parte del acervo bibliográfico del Tecnológico de Monterrey se ha generado una copia de las tesis en
versión electrónica del tradicional formato impreso, con base en la Ley Federal del Derecho de Autor
(LFDA).
Es importante señalar que las tesis no se divulgan ni están a disposición pública con fines de
comercialización o lucro y que su control y organización únicamente se realiza en los Campus de origen.
Cabe mencionar, que la Colección de
Documentos Tec,
donde se encuentran las tesis, tesinas y
disertaciones doctorales, únicamente pueden ser consultables en pantalla por la comunidad del
Tecnológico de Monterrey a través de Biblioteca Digital, cuyo acceso requiere cuenta y clave de acceso,
para asegurar el uso restringido de dicha comunidad.
El Tecnológico de Monterrey informa a través de este medio a todos los egresados que tengan alguna
inconformidad o comentario por la publicación de su trabajo de grado en la sección Colección de
"Mold Defect Reduction for the Aluminum Wheels"-Edición
Única
Title
"Mold Defect Reduction for the Aluminum
Wheels"-Edición Única
Authors
Leonardo Alejandro Berumen Davila; Otros
Affiliation
Tecnológico de Monterrey, Universidad Virtual
Issue Date
2007-05-01
Item type
Tesis
Rights
Open Access
Downloaded
18-Jan-2017 20:36:33
UNIVERSIDAD VIRTUAL
SIX SIGMA PROJECT
SIX SIGMA BLACK BELT CERTIFICATION
Leonardo Alejandro Berumen Davila
Mario Guel Hernandez
Javier Solache Orozco
COMMITTEE:
MOLD DEFECT REDUCTION FOR THE ALUMINUM WHEELS
BY:
Leonardo Alejandro Berumen Dávila
Mario Guel Hernández
Javier Solache Orozco
SIX SIGMA PROJECT PRESENTED TO: ITESM FACULTY
DEDICATION
Leonardo
To my Wife for her unwavering faith in me as an academic and for giving me the knowledge, confidence, and encouragement to succeed.
Javier
ACKNOWLEDMENTS
W e would like to acknowledge the S U P E R I O R INDUSTRIES O F MEXICO for their on-going support and advice in making this research project possible: Special thanks to Heriberto Rodriguez owner process, Guillermo Calderon, Jose Antonio Banderas and Carlos Jimenez.
Thanks go out to:
Dr. Leonel Quintanilla and his wisdom, patience, guidance, and tutelage through the dreaded art of interpreting statistics.
All the team members, for adding daily knowledge, a little bit of sanity, and a lot of hard work.
Last, but never least of all, to everybody who was involve on this project, support, and encouragement on the journey to achieve and pursuit of higher goals and excellence. When we started taking the obstacles of this project presented, we took them as signs of potential to defeat, we saw who we're through our eyes and found out, once again, that just about anything is possible.
SUMMARY
The mold defect appears on the face of the wheels as lack of foundry material mainly on the spokes, windows, hub area, and bead of the wheels.
The purpose of this project is to improve product quality by reducing mold defects. This involved identifying and isolating the primary causes of problems that directly affect the cost of poor quality, determine the root causes and implement effective corrective actions.
On the last semester basis, there was a total of $ 149, 835 U S D as a result of scrap. The initial goal is to reduce the cost of poor quality (COPQ) by 50% to achieve annual savings of $ 74,917.
CONTENTS
DEDICATION
ACKNOWLEDMENTS ii
SUMMARY iii
CONTENTS IV
CHAPTER 1. INTRODUCTION
1.1 Company High-Lights 1.2 Six Sigma Project Objective
1 2 4
CHAPTER 2. LITERATURE REVIEW 5
CHAPTER 3. THE BREAKTROUGH STRATEGY 3.1. DEFINE PHASE
8 8
3.1.1. Cover Sheet 3.1.2. Project Charter
3.1.3. Cost Savings Tracking Sheet 3.1.4. Tollgate Review Plan
3.1.5. Project Action Plan (Gantt Chart 3.1.6. Defect Example
3.1.7. Process Model (SICOP or Map L1/L2/L3
3.2. MEASURE PHASE 16
3.2.1. Data Collection Plan 3.2.2. Base Line Data 3.2.3. M S A - G a g e Study
3.2.4. Brainstorming - Root Cause 3.2.5. Organization Causes
3.2.6. Cause Investigation
3.3. ANALYZE PHASE 19
3.3.1. Brainstorming - Solutions 3.3.2. Solution Evaluation / Selection 3.3.3. Solution Details
3.4. IMPROVE PHASE 31
3.4.1. Pilot Plan
3.5. CONTROL PHASE 36
3.1.1. Permanent Controls
3.1.2. Celebrate Success (Close and Handoff)
CHAPTER 4. RECOMMENDATIONS 40
R E F E R E N C E S v
VITA
CHAPTER 1. INTRODUCTION
Six Sigma is as much about people excellence as it is about technical excellence. Employees often wonder how they are going to solve a difficult problem, but when they are given the tools to ask the right questions, measure the right things, correlate a problem with a solution and plan a course of action, they can find solutions to the problem more easily. Therefore, with Six Sigma, the company's Superior corporate culture shifts to one that includes a systematic approach to problem solving and a pro-active attitude among employees. Successfully Six Sigma programs also had contributed to the overall sense of pride of the Superior Company's employees.
Six Sigma had helped us to transforms the mindset and works on major business issues like:
© Process design: Designing production processes to have the best and most consistent outcomes from the beginning.
© Variable investigation: conducting studies to identify what the variables cause variation and how they interact with each other.
© Analysis and reasoning: using facts and data to find the root causes of variations, instead of educated guesses or intuition.
© Focus on process improvement: focusing on process improvement as key to excellence in quality.
© Pro-activeness: Encouraging people to be pro-active about preventing potential problems instead of waiting for problems to occur.
© Broad participation in problem solving: getting more people involved in finding causes and solutions for problems.
© Knowledge sharing: learning and sharing new knowledge in terms of best practices to speed up overall improvement.
© Goal setting: aiming at stretch goals, instead of "good enough" targets, so that the company is constantly striving for improvement.
© Suppliers: cost is not the only criteria for vendor evaluation, but relative capability to consistently provide quality materials with the shortest lead time.
1.1 Company High-Lights
Superior Industries de Mexico S.A. de C.V.
Lou Borick founded Superior Industries in 1957. Steve Borick named C E O starting January 2005.
Superior Industries is the world's largest producer of cast aluminum road wheels servicing original equipment manufacturers worldwide:
© Superior Industries is a premier company focusing on supplying its customers with the highest possible quality at competitive prices.
& Employs a highly optimized low-pressure casting and light forging technologies, which offer structural and styling flexibility required to meet multiple platform demands.
® These processes offer high volume efficiency, manufacturing consistency, repeatability, and most of all quality.
Superior Industries is currently operating seven low-pressure cast aluminum wheel plants in the U S , Mexico and Europe and new plant is in production
launching in Chihuahua, Mex. (Plant # 10).
O in 1993 Mexico operations started with plant 7 and in 2001 a second
plan was build in Mexico (plant 9)
3 In this year a new plant (10) is being starting production
Superior Industries has achieved several supplier awards recognizing its excellence. The awards were:
«* In 2003, 2004, 2005, and 2006 Nissan North America awarded "Zero Defects" and "Quality Master Award".
O In 2006 named by Ford "Strategic Supplier"
& In 2002, Superior Industries achieved a new supplier award recognizing our excellence. The awards were the Ford Motor Company' Silver World Excellence Award.
® In 2004, Gold Award from Daimler-Chrysler.
• General Motors Supplier of the Year Award (2000, 2001, 2002, 2003, 2004, 2005, and 2006).
@ In 2003, Fayetteville received the V P P Gold Star Recognition Award from O S H A .
Superior Industries Mexico was awarded Self-audit status (VPP) from "Mexico Labor Ministry" (Secretaria del Trabajo y Prevision Social) reached on 2004.
MISSION STATEMENT
To design and manufacture "Superior" quality aluminum wheels and other automotive component products for our customers worldwide. To continue to be the performance leader in our industry to provide a maximum return to our shareholders; provide a competitively priced quality product for our customers; and create growth opportunities for our employees with particular emphasis on a team effort among our people through open communication, smart thinking and cooperation.
Quality Vision.
Provide a supporting role to the Corporation for reducing waste, optimizing processes, and maintaining our position as the quality leader in our commodity. To clearly define the roles and functions of the Quality Organization
Address: Plant 9: Nicolas Gogol 11354 Chihuahua, Chih. CP.31109 Information of the contact in the company
Jose Luis Salgado, Operations Manager, isalgado(5).supind.com Tel. 614 4290960
Automotive Industry actual conditions
a) The modalities of price reductions "imposed" by the clients affect the margins sensibly due to the Asian competition.
b) High sensibility of the clients to the quality problems
c) Lack of competitiveness at world level with the Asian market generating closing plants of aluminum wheels in USA.
d) It is a tendency to the drop of penetration of our main clients in the market. e) Change in the design of new vehicles (fashion / stile, size of wheels). f) Customer expectations
g) Quality and delivery always improving.
h) More flexibility and faster new products development. i) Cost atractive.
1.2 Six Sigma Project Objective
Project Name: Mold defect reduction Project description
The mold defect appears on the face of the wheels as lack of foundry material mainly on the spokes, windows, hub area, and bead of the wheels.
The purpose of this project is to improve product quality by reducing mold defects. This involved identifying and isolating the three primary causes of problems that directly affect the cost of poor quality, determine the root cause and implement effective corrective actions. On the last semester basis, there was a total of $ 149, 835 U S D as a result of scrap. The initial goal is to reduce the cost of poor quality (COPQ) by 50% to achieve annual savings of $ 74,917
This is one of the main defects in the Plant
Scope: All the wheels produced in the Plant
Project Objective is 50% reduction for this defect.
Key Words
0 Cast: To take a form in a mold
© Casting machine: The machine to cast a wheel with a permanent mold.
O Deburr: To remove the burrs from a wheel.
O Expedition E B : Type of wheel
© F20: Wheel damage produced because of mold problem ® F21: Drag damage during removal the wheel from a mold © Fettle: To remove the casting gate
O Final Inspection: The place in the process to make a final evaluation
of the wheel
© Fist Slope: The place in the process to review the wheels before clear coat application
® Fluoroscope: An instrument used for observing the internal structure of a wheel by means of X-rays
0 Heat Treat: To treat wheels by heating and cooling in a way that will produce desired properties
O Machining face wheel: Wheel with a finish as machined cover just by
acrylic
O Mold shop: The place where the molds are prepared
0 M R B :
9 Picker: Fluoroscope wheel for immediate feed back to the casting
operators
CHAPTER 2. LITERATURE REVIEW: SIX SIGMA THEORIES
Six Sigma has been a popular management philosophy for years. Motorola first made Six Sigma popular in the 1980s. AlliedSignal embraced it in the early 1990s and then General Electric made it the most popular management philosophy in history. Like anything that becomes popular, misconceptions abound relative to how to implement Six Sigma. Particularly since this management philosophy is based on facts and data being used to make decisions in the organization, a host of statisticians have developed new careers teaching and consulting in this discipline. However, most statisticians are skilled in the theory of Six Sigma. To make Six Sigma a success in your organization, it must affect everyone in the organization.
Everyone in an organization must be involved and affected by ix Sigma, regardless of their position in the organization. Unlike the approaches many take that imply Six Sigma is some mystic set of skills available only to those with advanced college degrees, Six Sigma must be available to everyone in the organization, where certain skills are practiced by all.
Six Sigma is teaching everyone in the organization to become more effective and efficient. Unfortunately, most organizations are highly ineffective and inefficient. This means they have unhappy customers and waste considerable money because their processes do not run at optimum. The path to becoming more effective and efficient using Six Sigma contains three components. The first component deals with the strategy of Six Sigma. The strategy of Six Sigma is called Business Process Management. This strategic component is the responsibility of executive management. Thus, if you hear your company has embraced Six Sigma it may be several months before you see the results of your management's initial work. To have you become acquainted with what your management has done to create the Business Process Management system.
The second component of Six Sigma deals with the tactics of how project teams improve a broken process. It utilizes a methodology similar to the scientific method you learned in school. The scientific method refers to defining and measuring a problem, analyzing its root cause, and testing theories of improvement.
a percentage of non-defective outputs of only 30.854%. That's obviously really poor performance. If we have processes functioning at a three sigma level, this means we're allowing 66807.2 errors per million opportunities, or delivering 93.319% non-defective outputs. That's much better, but we're still wasting money and disappointing our customers. How well are your processes operating? Are they three sigma? Four sigma? Five? Most organizations in the world are operating at three to four sigma quality levels. That means they could be losing up to 2 5 % of their total revenue due to processes that deliver too many defects—defects that take up time and effort to repair as well as creating unhappy customers. Is that good enough? The answer is simple. No it's not when you could be doing a lot better.
The central idea of Six Sigma management is that if you can measure the defects in a process, you can systematically figure out ways to eliminate them, to approach a quality level of zero defects. So, in short, Six Sigma is several things:
1. A statistical basis of measurement: 3.4 defects per million opportunities 2. A philosophy and a goal: as perfect as practically possible
3. A methodology 4. A symbol of quality
The Six Sigma methodology uses statistical tools to identify the vital few factors, the factors that matter most for improving the quality of processes and generating bottom-line results. It consists of four or five phases:
I. Define the projects, the goals, and the deliverables to customers (internal and external).
II. Measure the current performance of the process.
III. Analyze and determine the root cause(s) of the defects. IV. Improve the process to eliminate defects.
V. Control the performance of the process.
Six Sigma statistical tools work like magic to uncover what you don't know. Yet you don't have to be a statistician to use them: you focus on selecting tools, using them, and analyzing data and let the specific software do the calculations. The five-phase process of DMAIC, described earlier in this chapter, uses a collection of tools and is a logic filter to lead you to the vital few factors affecting your process outcomes:
Define. Determines the project goals and deliverables to customers. (Internal
and external)
Measure. Identifies one or more product or service characteristics, maps the
process, evaluates measurement systems, and estimates baseline capability.
Analyze. Evaluates and reduces the variables with graphical analysis and
hypothesis testing and identifies the vital few factors for process improvement. Improve. Discovers variable relationships among the vital few, establishes operating tolerances, and validates measurements.
Control. Determines the ability to control the vital few factors and implements
Six Sigma is not another quality program. That's an important point to emphasize. Businesses exist for one purpose—to profitably serve customers. So it follows that any problem-solving initiative should do the same. Six Sigma uses your resources to fix identifiable, chronic problems. It proves its value by connecting outcomes to your bottom line. Quality programs lay a valuable foundation in creating a quality mindset. But ask yourself if any you've experienced have generated specific financial results like Six Sigma. It's very possible you'll answer, "No," since a primary criterion for selecting Six Sigma projects is to return money to your balance sheet as the result of full-time efforts by dedicated resources.
Six Sigma is not theory. It's a practice of discovering the vital few processes that matter most. It defines measures, analyzes, improves, and controls them to tie quality improvement directly to bottom-line results.
3.1 DEFINE P H A S E
In the Define phase, we create a high-level process map to get an overview of the steps, events, and operations that make up the process. This helped us understand the process and verify the scope we defined in our charter. It is particularly important that our high-level map reflects the process as it actually is, since it serves as the basis for more detailed maps.
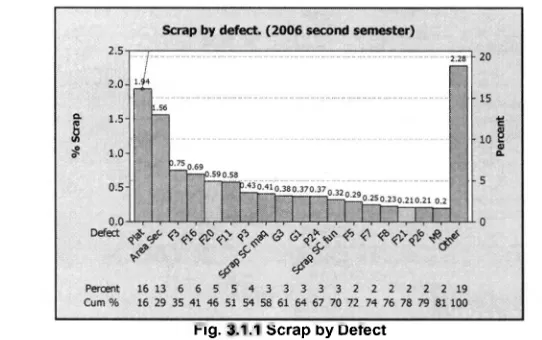
Pareto A n a l y s i s
W e prioritized the opportunities for improvement by using Superior 2006 second semester scrap report. Cost was analyzed in order to know if the problem could be performed as a Six Sigma project.
Foundry (Total
shots) 1119322 9.21 Machining (Gross
mach) 1069676 1.8
Paint 1181961 2.6
C o s t s
USD
RW 4.45
USD Foundry scrap 8.90 Machining USD scrap 15.74 Final line USD scrap 18.85 90% of defects %scrap
reduction Main Defects (Scrap) R W Wheels % Scrap 50% Reduction per defect Cumm Scrap % 13.61 unit cost
scrap Total F3 8388 0.75 0.37 13.24 13.24 23.30 195,440 F20 1780 0.16 0.08 13.53 13.16 23.30 41,474
F11 261 0.02 0.01 13.60 12.97 23.30 6,081 14367
l/lachining •Virgin)
F16 4690 0.42 0.21 13.40 12.76 15.74 73,821 F11 4301 0.38
n : 0.19 nzyxwvutsrqponmlkjihgfedcbaZYXWVUTSRQPONMLKJIHGFEDCBA I R
13.42 12.57 15.74
1 RzyxwvutsrqponmlkjihgfedcbaZYXWVUTSRQPONMLKJIHGFEDCBA 7 A
67,698
G1 ouoo 2898 u.OJ 0.26 U. I D 0.13 13.48 I O.HrO 12.27 15.74
01.
45,615 F7 2750 0.25 0.12 13.49 12.15 15.74 43,285 F5 2684 0.24 0.12 13.49 12.03 15.74 42,246 F8 2541 0.23 0.11 13.50 11.92 15.74 39,995 F21 2046zyxwvutsrqponmlkjihgfedcbaZYXWVUTSRQPONMLKJIHGFEDCBA1 0.18 0.09 13.52 11 15.74 32.204
F25 1383 0.12 0.06 13.55 11.76 15.74 21,768 26959
•Virgin)
F16 2987 0.27 0.13 13.48 11.63 18.85 56,305 F11 2065 0.18 0.09 13.52 11.54 18.85 38,925 F20 1071 0.10 ; 0.05 13.56 1 20,188
F17 653 0.06 0.03 13.58 11.46 18.85 12,309 F4 515 0.05 0.02 13.59 11.44 18.85 9,708 F5 483 0.04 0.02 13.59 11.42 18.85 9,105 G1 481 0.04 0.02 13.59 11.40 18.85 9,067 F1 319 0.03 0.01 13.60 11.38 18.85 6,013
8574 4.46 2.23
P r o b l e m Description
S i x S i g m a project charter
[image:21.612.160.431.69.239.2]After project selection, project cover sheet, project contents and project charter (Fig. 3.1.2) were made and then formed the project team.
Ng. scrap by Detect
Gantt chart
A Gantt chart (Fig. 3.1.3) is a visual project planning device used for production scheduling. A Gantt chart graphically displays time needed to complete tasks.
In order to follow a sequence, a Gantt chart was developed; it helps team members to perform activities punctually.
D Task name Srait Finish % completed 1 Stage 0: Information analysis
2 information review of the problem 15-Jan-07 100%
3 Problem *vheei style and process 15-Jan-07 i S2C07 1 0 0 %
4 Stage J: Define - Project purpose and scope, to identify critical to quality fCTQ's)
5 Project selection (Y) 100':;
6 Project evaluation cost (Finance) 1 0 0 %
7 Project charter 1 0 0 %
8 Problem statement 100%
9 Project scope 100%
10 P r o c e s s sigma level 100%
11 T e a m Members 1 0 0 %
12 Financial benefits 1 0 0 %
13 Project charter validation 1 0 0 %
14 S i P O C (High level processflow) 100 =zyxwvutsrqponmlkjihgfedcbaZYXWVUTSRQPONMLKJIHGFEDCBA 3
15 P r o c e s s capability 100%
16 V o i c e of the customer | ¥ Q C ) 1 0 0 %
17 Critical to Quality (CTQ's) Jara-07 1 0 0 %
13 Stage!!.- Measure - Data collection and real process information
19 P r o c e s s flow 29-Jar,-07
20 Detailed process flow 1 0 0 %
21 P r o c e s s R T Y 1 0 0 %
22 Data collection plan 100%
23 Type of data (Discrete or continuous) 100%
24 Sample size 100%
25 Measurement system 1 0 0 %
26 R e c o r d sheet 100%
27 ;^ c s records 1 0 0 %
28 G a q e R & R ll "
29 Stage ill.- Analyze - Root cause analysis
30 P r o c e s s flow diagram 12-Fet-07 li 100?'!
31 Value added a n d non value added activities 12-Feb-07 2/16/2007 ! 0 0 %
32 Key process input and outputs variables 12 •-. 3/30*2007 100%
33 variables identification MfA Hi A
34 Stage IV,- Improve - Root cause solution implementation
35 identify m e a n s to remove the causes of the defects 7 2007 100%
36 Solution validation 9-Feb-07 4 / 1 * 2 0 0 7 100%
37 Modify the process to stay within the acceptable range 9-Feb-07 4/13/2007 1 0 0 %
38 cost'benefit analysis
39 Stage V.- Control- Determine how to maintain the improvements
40 Control plan 9-Feb-07 4/13/2007 100?.
[image:22.612.82.497.85.399.2]41 Project hand off 4/t6i2007 5 0 / 2 0 0 7
Fig. 3.1.3 Gantt Chart
The multi-functional core team is formed of Production, Product Engineering and Quality personnel. The support team involved Industrial Engineering, Maintenance and mold shop.
The team meets a minimum of once a week from start to completion of the project (January 2007 - May 2007).
S I P O C
S U P P L I E R INPUT P R O C E S S OUTPUT C U S T O M E R Meltinq Melted
Aluminum Mold shop Mold
Facilities Pressured Air,
Molded Wheel Maintenance Water, Liqht,
etc Molding
Molded
Wheel Fettling C F E
A C H E S O N Mold Paint O R P A C Special Paint
P r o c e s s Capability
In order to know if a process consistently makes a product that meets a customer specified specification range (Tolerance).
Binomial distribution is used due it is usually associated with recording the number of defective items out of the total number sampled.
Two process capabilities are shown, historical used as reference (Fig. 3.1.4). Two process points are being measure due to defect registration (Fig. 3.1.5).
[image:23.612.124.510.440.665.2]Historical data
Voice of the Customer
V O C focused feedback in the context of the customer's experience with the product or service, providing us clues about theirs expectations, perceptions and needs.
This Standard sets the Criteria that is to be used forjudging acceptable cosmetic Appearance of Wheels.
PAINTED & MACHINED F A C E D W H E E L S
Z O N E B
B l e m i s h Type Description / Definition Max Size
mm Max#
Max Size
mm Max#
Dirt or Foreign Particles
Visible foreign Material in the form of lint, dirt or dust found in the paint
and clear coat layers
1.0mm 3 1.5mm window 1 per
Out gassing/ Finish Bubbles/ Clear coat
Pops
Bubble remnants or small holes in the
surface finish.
1.0mm 3 1.5mm window 1 per Out gassing/
Finish Bubbles/ Clear coat
Pops
Bubble remnants or small holes in the
surface finish. >0.5mm x25mm Sq 5 in 25mm >0.5mm
8 in 25mm x25mm
Sq
Scratches Scratches in Clear coat visible at Arms Length.
5mm long x0.5mm wide 2 5mm long x0.5mm wide 1 per window Chip whip
Scratches under Clear Coat from Machining
Chips Not Allowed Not Allowed Not Allowed Not Allowed
Paint Runs &
Sags Visible at Arms Length.
Not Allowed Not Allowed Not Allowed Not Allowed
Orange Peel Visible at Arms Length. Allowed Not Allowed Not Allowed Not Allowed Not
Damage (Dents)
Anomalies in substrate
under Clear coat 0.5mm
Not Allowed
1 per window
Machining line
Machine lines on surface, visible at arm's
length. (Not Applicable to Painted wheels)
[image:25.612.87.546.84.696.2]Not Allowed Not Allowed Not Allowed Not Allowed
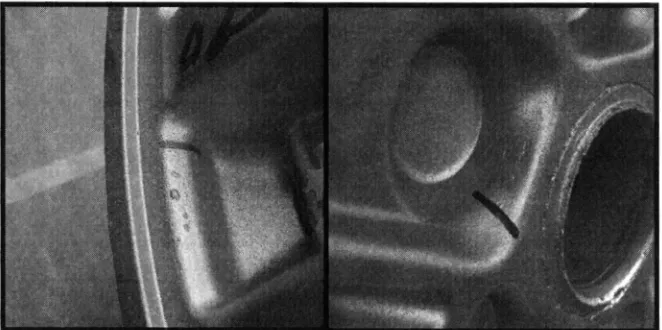
Critical to Quality (CTQ)
[image:26.612.132.463.165.330.2]In order to identify measurable C T Q characteristic that will be improved, some pictures were taken (Fig. 3.1.6). It helps to determine the specification limits for our Y, also, any characteristic that satisfies or dissatisfies customer.
In the Measure and Analyze phases, we created a detailed process map to help us identify problems in the process. Our improvement project is focus on addressing these problems
P r o c e s s Map
First, we mapped the process to fully understand the activities and sequence of steps in order to identify Key Process Input and Output Variables (KPIVs and KPOVs). Value stream mapping objective is to optimize the process and waste
o l i m i n a t i n n
Type of data (Discrete or continuous) Definitions:
Continuous datazyxwvutsrqponmlkjihgfedcbaZYXWVUTSRQPONMLKJIHGFEDCBA is numerical information such that the numbers represent quantities. Thus, the number 14 for continuous data is twice the amount as the number 7. In theory, fractions of these quantities make sense, e.g., 1.3 days or 3.17 inches. In practice, if fractions of quantities, e.g., counts, do not make sense but the number of possible values is large, one can treat the data as continuous-like.
Discrete data is non-quantitative information. If numerical, the numbers are
labels, e.g., social security numbers, rather than quantities. For this reason, a finite number of values are possible and the values cannot be subdivided meaningfully. For example, the number of parts damaged in shipment produces discrete data because parts are either damaged or not damaged.
Based on the above definitions, our product data will be defined as discrete due they are classified as good or bad.
Detailed Process Map
On this map, we can realize all factors involved on the manufacturing.
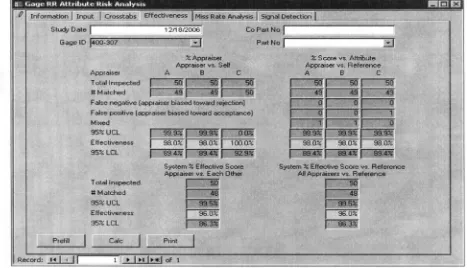
Measurement System A n a l y s i s
Attribute Gage Repeatability & Reproducibility (Gage R & R) studies were performed to identify and correct measurement errors.
[image:30.612.55.522.172.440.2]This Six Sigma tool increased the confidence in ensuring only good products are sending to our internal and external customers, consequently, also resulting to quick savings in material by reducing the probability of rejecting good products.
C a u s e and Effect Diagram (Fishbone)
The team used several graphical tools to visualize the problem and brainstorm the solution.
Fig. 3.3.2 Final Inspection Rejections F20 & F21
[image:32.612.123.498.343.594.2]Fig. 3.3.4 F20 & F21 Final Inspection per wheel style
F i s h b o n e Diagram
[image:34.612.58.515.121.410.2]This fishbone diagram identified the primary causes of defects. This further reinforces the focus of our improvement efforts and in much more detail.
Fig. 3.3.6 Fishbone Diagram fro Mold Defect
A mold shop supervisor was integrated to the team. We realized he could help on this problem due the most of cases the mold before running is strongly related with none defects operation.
Fig. 3.3.7Pareto Chart of F20 & F21 First Slope in Expedition E/B Wheel
Fig. 3.3.8 F20 & F21 Expedition Rejection in First Slope & Final Inspection
Rejection in first slope and final inspection for Expedition wheel.
[image:35.612.120.505.353.612.2]1. Defects classification by quality. Final inspection and M R B .
2. Bad inspection mold. The mold had defects before running at casting deck.
3. Polish at mold shop after running. The molds are not well polished during maintenance at mold shop after production.
4. Lack of cosmetic inspection at casting deck.
A c t i o n s already taken for the above mentioned:
[image:36.612.149.502.279.428.2]1. Different pictures were taken in both areas in order to identify those defects that were identified as a defect mold only Final inspection and M R B were advised. The purpose of this is to classify the defects correctly in order to know the problem as it is.
Fig. 3.3.9 Mold Defects
2. Bad inspection mold. The mold had defects before running at casting deck. The attached report is being performing in order to detect molds with defects when it starts running or during normal operation. Currently all molds with defects before running will send back to mold shop for repairing.
3. Polish at mold shop after running. Normally all molds are sending back to mold shop for normal maintenance, several times molds are not well polished during maintenance because lack of feedback from
production. Currently all Expedition molds are sending to mold shop with an as-cast wheel. It helps to mold shop technician to detect mold defects easier.
Fig. 3.3.10 Process Capability specific on casting machines
Fig. 3.3.11 Process Capability Mg Percent on Casting Machine
Industrial Engineering study also was performed in order to make sure cosmetic inspection could be improved without affectation in other duties.
Process capability specific gravity on casting machines
(using 95.0% confidence)
Frequency: Two times per shift per casting machine
Process capability Mg percent on casting machine
(using 95.0% confidence)
Hypothesis Testing
Fig. 3.3.12 Hypothesis Testing
Two-Sample T-Test and CI: Status 2, C7 Two-sample T for Status 2
C 7 N Mean StDev S E Mean Before 5 1.440 0.872 0.39 After 6 0.770 0.279 0.11
Difference = mu (before) - mu (after) Estimate for difference: 0.670000
95% lower bound for difference: -0.015293
T-Test of difference = 0 (vs. >): T-Value = 1.79 P-Value = 0.05 DF = 9 Both use Pooled StDev = 0.6174
On this statistical analysis we are comparing means before and after improvements were made, p value tells us with 95% of confidence that there is sufficient evidence to reject Ho, in others words, there is statistical difference among those two periods, mu before is bigger than after.
Ho: Ha:
before before
Correlation A n a l y s i s
With this analysis, we were able to determine that there was a correlation between the final inspection and first inspection detection. It is known that good detection at first inspection correlates with final inspection because the wheels are not sending with defects until final inspection. (Pearson Correlation = 0.806).
Correlations: first slope rejection, final inspection rejection
Pearson correlation of first slope and final inspection rejections = 0.503 P-Value = 0.096
P-value tells us that at this time there is not correlation among those two inspection points so far. It is assumed that efforts made in first slope will reduce rejections on final inspection. A correlation is desirable.
The reports were used temporarily in these areas, first slope and final inspection.
[image:42.612.134.485.113.382.2]Some wheel defects were analyzed during this study.
3.4 IMPROVE PHASE
An action plan was established for each wheel style in function of the problem on it.
B E N C H M A R K I N G
Hungary plant is performing a rework in all wheels as a normal operation. This is to make sure good wheels at final inspection.
Mold defect is one of the main reasons of this rework.
P r o c e s s capability
A process capability is calculated one time all the possible solutions were implemented, on this case not all improvements are implemented yet.
[image:45.612.150.501.147.372.2]Process capability is calculated in first slope inspection and final inspection.
Fig. 3.4.1 Actual Process Capability First Slope F20 & F21
[image:45.612.153.484.431.654.2]Financial analysis
In control phase, some rules were already established. All molds are being repaired if any defect is detected at casting deck. Quality inspection is more powerful than before.
Fig. 3.5.1 Daily Quality Inspection
A feasibility check list was created for new programs; it will help us since mold design to avoid problems on production.
New records were implemented in casting decks, these records will help on
defect detection besides casting deck personnel evaluation.
RECOMMENDATIONS
At the present the automotive industry has been an evolution in the aspects as Quality - Cost and Delivery, now the final customer determines the market laws to meet their expectations, that's why the Quality, Cost and Delivery of products and services have had to improve substantially.
A s part as supplier's requirements, the ISO-TS16949 standard calls for continuous improvement methodologies and a structure in the supply chain companies that include Six Sigma and lean manufacturing.
In spite of the obstacles we had as far as time for the development of the project, the impacts in the plant were very positive in the economic aspect as well as the cultural change.
During the development of the project we found opportunity areas that were not considered initially, these arose due to the depth of the analysis that methodology six sigma demand. An additional benefit was achieved "yield" at final line from 87 to 94 percent.
Six sigma has demonstrated that its application is very useful as well as the support of the top management, to be open to the change and to be conscientious of the necessity of the improvement.
REFERENCES
Breygfogle ill, Forrest w. (1999). implementing Six Sigma, Smarter Solutions
using statistical Methods. John Wiley & Sons. New York
Harry, Mikel J. (2000). The Vision of Six Sigma: A Roadmap for Breakthroug.zyxwvutsrqponmlkjihgfedcbaZYXWVUTSRQPONMLKJIHGFEDCBA 4a ed. Sigma Publishing Company. Phoenix, Arizona.
Costich-Sicker, Therese (2002) The Six Sigma Memory Jogger II G O A L / Q P C Salem NH.
Brassard, Michael (2002) The Black Belt Memory Jogger G O A L / Q P C Salem NH.
Mireles Linares, Juan Jose A S Q M B B (2007) A S Q conference Six Sigma introduction an executive
Coracides, Mario (2005) G E Capital Courier Simulation v 3.0.1
McCarty Thomas, Daniels Lorraine, Bremer Michel and Gupta Praveen. (2005) The Six Sigma Black Belt handbook Motorola University.
McGraw Hill U S A
VITA JAVIER SOLACHE
Javier Solache Orozco was born in Tuxpan, Michoacan, on January 28, 1945. His Professional studies were done in Escuela Superior de Ingenieria Mecanica y Electrica in Mexico City.
At present laboring in the Superior Industries de Mexico as Quality Systems Manager for Plants 7 and 9 in Chihuahua, Chih., Plant of manufacture the aluminum wheels for automotive industries. Responsible of the Implementation of the system of quality achieving the Certification in ISO-TS 16949 Launch of 60 new wheels for nine different clients. Several awards have been achived.
From 1966 to this date, he has been working as follow: • 1966/1984 Ford Motor Company
• 1984/1994 Nissan Mexicana Planta Aguascalientes
• 1994/ 2000 Valeo Sistemas Electricos San Luis Potosi Plant • 2000/2001 N E M A K Nuevo Leon State
• 2001/ 2007. Superior Industries de Mexico
He has been working in management positions since 1974 and as Quality manager since 1982.
Adress:
Santa Rosalia 5940
VITA LEONARDO BERUMEN
Leonardo Berumen was born in C d . Delicias, Chihuahua on December 29, 1977. His Professional studies were done in the Instituto Tecnologico y de Estudios Superiores de Monterrey Campus Sonora Norte and a Master degree in Business Administration in the Universidad Tecnologica sponsor by Universidad Autonoma de Chihuahua.
At present he's working at Metropolitan Furniture Corporation a Steelcase Company developing as follow:
cp Monitors production/planning processes and products for compliance with
accepted quality standards. Maintains detailed records including verifications, changes, and employee certifications.
9 Fosters Team environment. Trains employees on specific role/responsibilities.
Implements or maintains teaming process within the department. Handles routine activities including pay issues, clarification of roles, and communication of goals.
cp Responsible for meeting established budgets and developing and maintaining
cost-reduction iniatives. Focuses on profitability considering the cost of goods/services. Justifies each step of the manufacturing/service process while maintaining customer focus. May interact with vendors to select equipment which meets our budget objectives. Participates in setting and communicating department goals and is responsible to meet those goals.
cp Encourages development of all team members. Completes performance reviews
in a timely manner. Recommends appropriate developmental action steps and addresses problem areas with employees. Interprets and applies company policy and procedures in a uniform and fair manner. Fosters and maintains a working environment which maximizes the contributions of all team members.
cp Maintains focus on established safety standards. Monitors employees for
adherence to rules, usage of protective equipment, and proper operating techniques.
9 Continually monitors department status in order to meet established production
schedules. Identifies problem areas and develops appropriate resolutions. Requires constant planning of daily and weekly manpower to meet schedules/objectives. Reviews schedule for changes or priorities and plans accordingly.
cp Participate any Lean events and Lean improvement.