C
OMMON
E
RRORS IN
S
TATISTICS
C
OMMON
E
RRORS IN
S
TATISTICS
(
AND
H
OW TO
A
VOID
T
HEM
)
Phillip I. Good
James W. Hardin
Copyright © 2003 by John Wiley & Sons, Inc. All rights reserved. Published by John Wiley & Sons, Inc., Hoboken, New Jersey. Published simultaneously in Canada.
No part of this publication may be reproduced, stored in a retrieval system, or transmitted in any form or by any means, electronic, mechanical, photocopying, recording, scanning, or otherwise, except as permitted under Section 107 or 108 of the 1976 United States Copyright Act, without either the prior written permission of the Publisher, or authorization through payment of the appropriate per-copy fee to the Copyright Clearance Center, Inc., 222 Rosewood Drive, Danvers, MA 01923, 978-750-8400, fax 978-750-4470, or on the web at www.copyright.com. Requests to the Publisher for permission should be addressed to the Permissions Department, John Wiley & Sons, Inc., 111 River Street, Hoboken, NJ 07030, (201) 748-6011, fax (201) 748-6008, e-mail: permreq@wiley.com.
Limit of Liability/Disclaimer of Warranty: While the publisher and author have used their best efforts in preparing this book, they make no representations or warranties with respect to the accuracy or completeness of the contents of this book and specifically disclaim any implied warranties of merchantability or fitness for a particular purpose. No warranty may be created or extended by sales representatives or written sales materials. The advice and strate-gies contained herein may not be suitable for your situation. You should consult with a pro-fessional where appropriate. Neither the publisher nor author shall be liable for any loss of profit or any other commercial damages, including but not limited to special, incidental, con-sequential, or other damages.
For general information on our other products and services please contact our Customer Care Department within the U.S. at 877-762-2974, outside the U.S. at 317-572-3993 or fax 317-572-4002.
Wiley also publishes its books in a variety of electronic formats. Some content that appears in print, however, may not be available in electronic format.
Library of Congress Cataloging-in-Publication Data:
Good, Phillip I.
Common errors in statistics (and how to avoid them)/Phillip I. Good, James W. Hardin.
p. cm.
Includes bibliographical references and index. ISBN 0-471-46068-0 (pbk. : acid-free paper)
1. Statistics. I. Hardin, James W. (James William) II. Title. QA276.G586 2003
519.5—dc21
2003043279 Printed in the United States of America.
CONTENTS v
Preface ix
PART I FOUNDATIONS 1
1. Sources of Error 3
Prescription 4
Fundamental Concepts 4
Ad Hoc, Post Hoc Hypotheses 7
2. Hypotheses: The Why of Your Research 11
Prescription 11
What Is a Hypothesis? 11
Null Hypothesis 14
Neyman–Pearson Theory 15
Deduction and Induction 19
Losses 20
Decisions 21
To Learn More 23
3. Collecting Data 25
Preparation 25
Measuring Devices 26
Determining Sample Size 28
Fundamental Assumptions 32
Experimental Design 33
Four Guidelines 34
To Learn More 37
vi CONTENTS
PART II HYPOTHESIS TESTING AND ESTIMATION 39
4. Estimation 41
Prevention 41
Desirable and Not-So-Desirable Estimators 41
Interval Estimates 45
Improved Results 49
Summary 50
To Learn More 50
5. Testing Hypotheses: Choosing a Test Statistic 51
Comparing Means of Two Populations 53
Comparing Variances 60
Comparing the Means of KSamples 62
Higher-Order Experimental Designs 65
Contingency Tables 70
Inferior Tests 71
Multiple Tests 72
Before You Draw Conclusions 72
Summary 74
To Learn More 74
6. Strengths and Limitations of Some Miscellaneous Statistical
Procedures 77
Bootstrap 78
Bayesian Methodology 79
Meta-Analysis 87
Permutation Tests 89
To Learn More 90
7. Reporting Your Results 91
Fundamentals 91
Tables 94
Standard Error 95
p Values 100
Confidence Intervals 101
Recognizing and Reporting Biases 102
Reporting Power 104
Drawing Conclusions 104
Summary 105
To Learn More 105
8. Graphics 107
The Soccer Data 107
One Rule for Correct Usage of Three-Dimensional Graphics 115
One Rule for the Misunderstood Pie Chart 117
Three Rules for Effective Display of Subgroup Information 118
Two Rules for Text Elements in Graphics 121
Multidimensional Displays 123
Choosing Effective Display Elements 123
Choosing Graphical Displays 124
Summary 124
To Learn More 125
PART III BUILDING A MODEL 127
9. Univariate Regression 129
Model Selection 129
Estimating Coefficients 137
Further Considerations 138
Summary 142
To Learn More 143
10. Multivariable Regression 145
Generalized Linear Models 146
Reporting Your Results 149
A Conjecture 152
Building a Successful Model 152
To Learn More 153
11. Validation 155
Methods of Validation 156
Measures of Predictive Success 159
Long-Term Stability 161
To Learn More 162
Appendix A 163
Appendix B 173
Glossary, Grouped by Related but Distinct Terms 187
Bibliography 191
Author Index 211
Subject Index 217
PREFACE ix
O
NE OF THE VERY FIRST STATISTICAL APPLICATIONS ONwhich Dr. Good worked was an analysis of leukemia cases in Hiroshima, Japan following World War II; on August 7, 1945 this city was the target site of the first atomic bomb dropped by the United States. Was the high incidence of leukemia cases among survivors the result of exposure to radiation from the atomic bomb? Was there a relationship between the number of leukemia cases and the number of survivors at certain distances from the atomic bomb’s epicenter?To assist in the analysis, Dr. Good had an electric (not an electronic) calculator, reams of paper on which to write down intermediate results, and a prepublication copy of Scheffe’s Analysis of Variance. The work took several months and the results were somewhat inconclusive, mainly
because he could never seem to get the same answer twice—a conse-quence of errors in transcription rather than the absence of any actual rela-tionship between radiation and leukemia.
Today, of course, we have high-speed computers and prepackaged statis-tical routines to perform the necessary calculations. Yet, statisstatis-tical software will no more make one a statistician than would a scalpel turn one into a neurosurgeon. Allowing these tools to do our thinking for us is a sure recipe for disaster.
Pressed by management or the need for funding, too many research workers have no choice but to go forward with data analysis regardless of the extent of their statistical training. Alas, while a semester or two of undergraduate statistics may suffice to develop familiarity with the names of some statistical methods, it is not enough to be aware of all the circum-stances under which these methods may be applicable.
The purpose of the present text is to provide a mathematically rigorous but readily understandable foundation for statistical procedures. Here for the second time are such basic concepts in statistics as null and alternative
hypotheses, pvalue, significance level, and power. Assisted by reprints from the statistical literature, we reexamine sample selection, linear regres-sion, the analysis of variance, maximum likelihood, Bayes’ Theorem, meta-analysis, and the bootstrap.
Now the good news: Dr. Good’s articles on women’s sports have appeared in the San Francisco Examiner, Sports Now, and Volleyball Monthly. So, if you can read the sports page, you’ll find this text easy to read and to follow. Lest the statisticians among you believe this book is too introductory, we point out the existence of hundreds of citations in statistical literature calling for the comprehensive treatment we have pro-vided. Regardless of past training or current specialization, this book will serve as a useful reference; you will find applications for the information contained herein whether you are a practicing statistician or a well-trained scientist who just happens to apply statistics in the pursuit of other science.
The primary objective of the opening chapter is to describe the main sources of error and provide a preliminary prescription for avoiding them. The hypothesis formulation—data gathering—hypothesis testing and esti-mate cycle is introduced, and the rationale for gathering additional data before attempting to test after-the-fact hypotheses is detailed.
Chapter 2 places our work in the context of decision theory. We empha-size the importance of providing an interpretation of each and every potential outcome in advance of consideration of actual data.
Chapter 3 focuses on study design and data collection for failure at the planning stage can render all further efforts valueless. The work of Vance Berger and his colleagues on selection bias is given particular emphasis.
Desirable features of point and interval estimates are detailed in Chapter 4 along with procedures for deriving estimates in a variety of practical situations. This chapter also serves to debunk several myths surrounding estimation procedures.
Chapter 5 reexamines the assumptions underlying testing hypotheses. We review the impacts of violations of assumptions, and we detail the procedures to follow when making two- and k-sample comparisons. In addition, we cover the procedures for analyzing contingency tables and two-way experimental designs if standard assumptions are violated.
Chapter 6 is devoted to the value and limitations of Bayes’ Theorem, meta-analysis, and resampling methods.
Chapter 7 lists the essentials of any report that will utilize statistics, debunks the myth of the “standard” error, and describes the value and limitations of pvalues and confidence intervals for reporting results. Prac-tical significance is distinguished from statisPrac-tical significance, and induction is distinguished from deduction.
Twelve rules for more effective graphic presentations are given in Chapter 8 along with numerous examples of the right and wrong ways to maintain reader interest while communicating essential statistical information.
Chapters 9 through 11 are devoted to model building and to the assumptions and limitations of standard regression methods and data mining techniques. A distinction is drawn between goodness of fit and prediction, and the importance of model validation is emphasized. Seminal articles by David Freedman and Gail Gong are reprinted.
Finally, for the further convenience of readers, we provide a glossary grouped by related but contrasting terms, a bibliography, and subject and author indexes.
Our thanks to William Anderson, Leonardo Auslender, Vance Berger, Peter Bruce, Bernard Choi, Tony DuSoir, Cliff Lunneborg, Mona Hardin, Gunter Hartel, Fortunato Pesarin, Henrik Schmiediche, Marjorie Stine-spring, and Peter A. Wright for their critical reviews of portions of this text. Doug Altman, Mark Hearnden, Elaine Hand, and David Parkhurst gave us a running start with their bibliographies.
We hope you soon put this textbook to practical use.
Phillip Good
Huntington Beach, CA brother_unknown@yahoo.com
James Hardin College Station, TX jhardin@stat.tamu.edu
Part I
FOUNDATIONS
“Don’t think—use the computer.”Chapter 1
Sources of Error
CHAPTER 1 SOURCES OF ERROR 3
S
TATISTICAL PROCEDURES FOR HYPOTHESIS TESTING, ESTIMATION, AND MODELbuilding are only a partof the decision-making process. They should never be quoted as the sole basis for making a decision (yes, even those procedures that are based on a solid deductive mathematical foundation). As philosophers have known for centuries, extrapolation from a sample or samples to a larger incompletely examined population must entail a leap of faith.
The sources of error in applying statistical procedures are legion and in-clude all of the following:
• Using the same set of data both to formulate hypotheses and to test them.
• Taking samples from the wrong population or failing to specify the population(s) about which inferences are to be made in advance.
• Failing to draw random, representative samples.
• Measuring the wrong variables or failing to measure what you’d hoped to measure.
• Using inappropriate or inefficient statistical methods.
• Failing to validate models.
But perhaps the most serious source of error lies in letting statistical pro-cedures make decisions for you.
PRESCRIPTION
Statistical methods used for experimental design and analysis should be viewed in their rightful role as merely a part, albeit an essential part, of the decision-making procedure.
Here is a partial prescription for the error-free application of statistics.
1. Set forth your objectives and the use you plan to make of your research beforeyou conduct a laboratory experiment, a clinical trial, or survey and beforeyou analyze an existing set of data.
2. Define the population to which you will apply the results of your analysis.
3. List all possible sources of variation. Control them or measure them to avoid their being confounded with relationships among those items that are of primary interest.
4. Formulate your hypothesis and all of the associated alternatives. (See Chapter 2.) List possible experimental findings along with the conclusions you would draw and the actions you would take if this or another result should prove to be the case. Do all of these things beforeyou complete a single data collection form andbefore you turn on your computer.
5. Describe in detail how you intend to draw a representative sample from the population. (See Chapter 3.)
6. Use estimators that are impartial, consistent, efficient, and robust and that involve minimum loss. (See Chapter 4.) To improve re-sults, focus on sufficient statistics, pivotal statistics, and admis-sible statistics, and use interval estimates. (See Chapters 4 and 5.)
7. Know the assumptions that underlie the tests you use. Use those tests that require the minimum of assumptions and are most pow-erful against the alternatives of interest. (See Chapter 5.)
8. Incorporate in your reports the complete details of how the sample was drawn and describe the population from which it was drawn. If data are missing or the sampling plan was not followed, explain why and list all differences between data that were present in the sample and data that were missing or excluded. (See Chapter 7.)
FUNDAMENTAL CONCEPTS
Three concepts are fundamental to the design of experiments and surveys: variation, population, and sample.
A thorough understanding of these concepts will forestall many errors in the collection and interpretation of data.
If there were no variation, if every observation were predictable, a mere repetition of what had gone before, there would be no need for statistics.
Variation
Variation is inherent in virtually all our observations. We would not expect outcomes of two consecutive spins of a roulette wheel to be identical. One result might be red, the other black. The outcome varies from spin to spin.
There are gamblers who watch and record the spins of a single roulette wheel hour after hour hoping to discern a pattern. A roulette wheel is, after all, a mechanical device and perhaps a pattern will emerge. But even those observers do not anticipate finding a pattern that is 100% determin-istic. The outcomes are just too variable.
Anyone who spends time in a schoolroom, as a parent or as a child, can see the vast differences among individuals. This one is tall, today, that one short. Half an aspirin and Dr. Good’s headache is gone, but his wife re-quires four times that dosage.
There is variability even among observations on deterministic formula-satisfying phenomena such as the position of a planet in space or the volume of gas at a given temperature and pressure. Position and volume satisfy Kepler’s Laws and Boyle’s Law, respectively, but the observations we collect will depend upon the measuring instrument (which may be affected by the surrounding environment) and the observer. Cut a length of string and measure it three times. Do you record the same length each time?
In designing an experiment or survey, we must always consider the possibility of errors arising from the measuring instrument and from the observer. It is one of the wonders of science that Kepler was able to for-mulate his laws at all, given the relatively crude instruments at his disposal.
Population
The population(s) of interest must be clearly defined before we begin to gather data.
From time to time, someone will ask us how to generate confidence inter-vals (see Chapter 7) for the statistics arising from a total census of a popu-lation. Our answer is no, we cannot help. Population statistics (mean, median, 30th percentile) are not estimates. They are fixed values and will be known with 100% accuracy if two criteria are fulfilled:
1. Every member of the population is observed.
2. All the observations are recorded correctly.
Confidence intervals would be appropriate if the first criterion is vio-lated, because then we are looking at a sample, not a population. And if the second criterion is violated, then we might want to talk about the con-fidence we have in our measurements.
Debates about the accuracy of the 2000 United States Census arose from doubts about the fulfillment of these criteria.1“You didn’t count the homeless,” was one challenge. “You didn’t verify the answers,” was another. Whether we collect data for a sample or an entire population, both these challenges or their equivalents can and should be made.
Kepler’s “laws” of planetary movement are not testable by statistical means when applied to the original planets (Jupiter, Mars, Mercury, and Venus) for which they were formulated. But when we make statements such as “Planets that revolve around Alpha Centauri will also follow Kepler’s Laws,” then we begin to view our original population, the planets of our sun, as a sample of all possible planets in all possible solar systems.
A major problem with many studies is that the population of interest is not adequately defined before the sample is drawn. Don’t make this mistake. A second major source of error is that the sample proves to have been drawn from a different population than was originally envisioned. We consider this problem in the next section and again in Chapters 2, 5, and 6.
Sample
A sample is any (proper) subset of a population.
Small samples may give a distorted view of the population. For example, if a minority group comprises 10% or less of a population, a jury of 12 persons selected at random from that population fails to contain any mem-bers of that minority at least 28% of the time.
As a sample grows larger, or as we combine more clusters within a single sample, the sample will grow to more closely resemble the popula-tion from which it is drawn.
How large a sample must be to obtain a sufficient degree of closeness will depend upon the manner in which the sample is chosen from the population. Are the elements of the sample drawn at random, so that each unit in the population has an equal probability of being selected? Are the elements of the sample drawn independently of one another?
If either of these criteria is not satisfied, then even a very large sample may bear little or no relation to the population from which it was drawn.
An obvious example is the use of recruits from a Marine boot camp as representatives of the population as a whole or even as representatives of all Marines. In fact, any group or cluster of individuals who live, work, study, or pray together may fail to be representative for any or all of the following reasons (Cummings and Koepsell, 2002):
6 PART I FOUNDATIONS 1
1. Shared exposure to the same physical or social environment
2. Self-selection in belonging to the group
3. Sharing of behaviors, ideas, or diseases among members of the group
A sample consisting of the first few animals to be removed from a cage will not satisfy these criteria either, because, depending on how we grab, we are more likely to select more active or more passive animals. Activity tends to be associated with higher levels of corticosteroids, and corticos-teroids are associated with virtually every body function.
Sample bias is a danger in every research field. For example, Bothun [1998] documents the many factors that can bias sample selection in astronomical research.
To forestall sample bias in your studies, determine before you begin the factors can affect the study outcome (gender and life style, for example). Subdivide the population into strata (males, females, city dwellers, farmers) and then draw separate samples from each stratum. Ideally, you would assign a random number to each member of the stratum and let a com-puter’s random number generator determine which members are to be included in the sample.
Surveys and Long-Term Studies
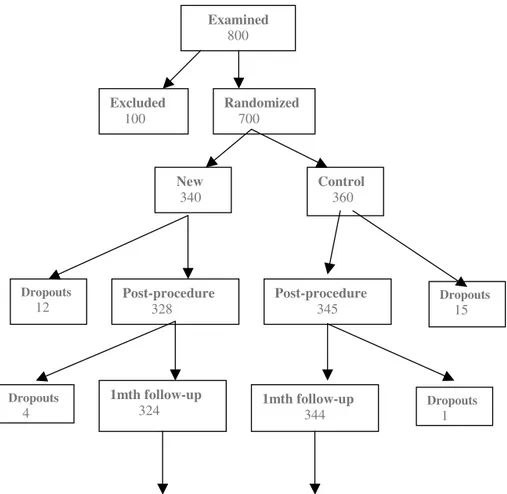
Being selected at random does not mean that an individual will be willing to participate in a public opinion poll or some other survey. But if survey results are to be representative of the population at large, then pollsters must find some way to interview nonresponders as well. This difficulty is only exacerbated in long-term studies, because subjects fail to return for follow-up appointments and move without leaving a forwarding address. Again, if the sample results are to be representative, some way must be found to report on subsamples of the nonresponders and the dropouts.
AD HOC, POST HOC HYPOTHESES
Formulate and write down your hypotheses before you examine the data.
Patterns in data can suggest, but cannot confirm hypotheses unless these hypotheses were formulated beforethe data were collected.
Everywhere we look, there are patterns. In fact, the harder we look, the more patterns we see. Three rock stars die in a given year. Fold the United States 20-dollar bill in just the right way and not only the Pentagon but the Twin Towers in flames are revealed. It is natural for us to want to attribute some underlying cause to these patterns. But those who have studied the laws of probability tell us that more often than not patterns are simply the result of random events.
Put another way, finding at least one cluster of events in time or in space has a greater probability than finding no clusters at all (equally spaced events).
How can we determine whether an observed association represents an underlying cause and effect relationship or is merely the result of chance? The answer lies in our research protocol. When we set out to test a spe-cific hypothesis, the probability of a spespe-cific event is predetermined. But when we uncover an apparent association, one that may well have arisen purely by chance, we cannot be sure of the association’s validity until we conduct a second set of controlled trials.
In the International Study of Infarct Survival [1988], patients born under the Gemini or Libra astrological birth signs did not survive as long when their treatment included aspirin. By contrast, aspirin offered appar-ent beneficial effects (longer survival time) to study participants from all other astrological birth signs.
Except for those who guide their lives by the stars, there is no hidden meaning or conspiracy in this result. When we describe a test as significant at the 5% or 1-in-20 level, we mean that 1 in 20 times we’ll get a signifi-cant result even though the hypothesis is true. That is, when we test to see if there are any differences in the baseline values of the control and treatment groups, if we’ve made 20 different measurements, we can expect to see at least one statistically significant difference; in fact, we will see this result almost two-thirds of the time. This difference will not repre-sent a flaw in our design but simply chance at work. To avoid this undesir-able result—that is, to avoid attributing statistical significance to an insignificant random event, a so-called Type I error—we must distinguish between the hypotheses with which we began the study and those that came to mind afterward. We must accept or reject these hypotheses at the original significance level while demanding additional corroborating evi-dence for those exceptional results (such as a depenevi-dence of an outcome on astrological sign) that are uncovered for the first time during the trials.
No reputable scientist would ever report results before successfully reproducing the experimental findings twice, once in the original labora-tory and once in that of a colleague.2The latter experiment can be partic-ularly telling, because all too often some overlooked factor not controlled in the experiment—such as the quality of the laboratory water—proves responsible for the results observed initially. It is better to be found wrong
8 PART I FOUNDATIONS 2
in private than in public. The only remedy is to attempt to replicate the findings with different sets of subjects, replicate, and then replicate again.
Persi Diaconis [1978] spent some years as a statistician investigating paranormal phenomena. His scientific inquiries included investigating the powers linked to Uri Geller, the man who claimed he could bend spoons with his mind. Diaconis was not surprised to find that the hidden
“powers” of Geller were more or less those of the average nightclub magi-cian, down to and including forcing a card and taking advantage of ad hoc, post hoc hypotheses.
When three buses show up at your stop simultaneously, or three rock stars die in the same year, or a stand of cherry trees is found amid a forest of oaks, a good statistician remembers the Poisson distribution. This distri-bution applies to relatively rare events that occur independently of one another. The calculations performed by Siméon-Denis Poisson reveal that if there is an average of one event per interval (in time or in space), then while more than third of the intervals will be empty, at least one-fourth of the intervals are likely to include multiple events.
Anyone who has played poker will concede that one out of every two hands contains “something” interesting. Don’t allow naturally occurring results to fool you or to lead you to fool others by shouting, “Isn’t this incredible?”
The purpose of a recent set of clinical trials was to see if blood flow and distribution in the lower leg could be improved by carrying out a simple surgical procedure prior to the administration of standard prescription medicine.
The results were disappointing on the whole, but one of the marketing representatives noted that the long-term prognosis was excellent when a marked increase in blood flow was observed just after surgery. She suggested we calculate a pvalue3for a comparison of patients with an improved blood flow versus patients who had taken the prescription medi-cine alone.
Such a pvalue would be meaningless. Only one of the two samples of patients in question had been taken at random from the population (those patients who received the prescription medicine alone). The other sample (those patients who had increased blood flow following surgery) was determined after the fact. In order to extrapolate results from the samples in hand to a larger population, the samples must be taken at random from, and be representative of, that population.
CHAPTER 1 SOURCES OF ERROR 9 3
The preliminary findings clearly called for an examination of surgical procedures and of patient characteristics that might help forecast successful surgery. But the generation of a pvalue and the drawing of any final con-clusions had to wait on clinical trials specifically designed for that purpose.
This doesn’t mean that one should not report anomalies and other unex-pected findings. Rather, one should not attempt to provide pvalues or confidence intervals in support of them. Successful researchers engage in a cycle of theorizing and experimentation so that the results of one experi-ment become the basis for the hypotheses tested in the next.
A related, extremely common error whose resolution we discuss at length in Chapters 10 and 11 is to use the same data to select variables for inclusion in a model and to assess their significance. Successful model builders develop their frameworks in a series of stages, validating each model against a second independent data set before drawing conclusions.
Chapter 2
Hypotheses: The Why of
Your Research
CHAPTER 2 HYPOTHESES: THE WHY OF YOUR RESEARCH 11
I
N THIS CHAPTER WE REVIEW HOW TO FORMULATEa hypothesis that is testable by statistical means, the appropriate use of the null hypothesis, Neyman–Pearson theory, the two types of error, and the more general theory of decisions and losses.PRESCRIPTION
Statistical methods used for experimental design and analysis should be viewed in their rightful role as merely a part, albeit an essential part, of the decision-making procedure.
1. Set forth your objectives and the use you plan to make of your research beforeyou conduct a laboratory experiment, a clinical trial, or a survey and beforeyou analyze an existing set of data.
2. Formulate your hypothesis and all of the associated alternatives. List possible experimental findings along with the conclusions you would draw and the actions you would take if this or another result should prove to be the case. Do all of these things before you complete a single data collection form andbeforeyou turn on your computer.
WHAT IS A HYPOTHESIS?
A well-formulated hypothesis will be both quantifiable and testable—that is, involve measurable quantities or refer to items that may be assigned to mutually exclusive categories.
of values.” or “Some measurable characteristic takes different values in dif-ferent populations, the difference(s) taking a specific pattern or a specific set of values.”
Examples of well-formed statistical hypotheses include the following:
• “For males over 40 suffering from chronic hypertension, a 100 mg daily dose of this new drug lowers diastolic blood pressure an average of 10 mm Hg.”
• “For males over 40 suffering from chronic hypertension, a daily dose of 100 mg of this new drug lowers diastolic blood pressure an average of 10 mm Hg more than an equivalent dose of metoprolol.”
• “Given less than 2 hours per day of sunlight, applying from 1 to 10 lb of 23–2–4 fertilizer per 1000 square feet will have no effect on the growth of fescues and Bermuda grasses.”
“All redheads are passionate” is not a well-formed statistical hypothe-sis—not merely because “passionate” is ill-defined, but because the word “All” indicates that the phenomenon is not statistical in nature.
Similarly, logical assertions of the form “Not all,” “None,” or “Some” are not statistical in nature. The restatement, “80% of redheads are pas-sionate,” would remove this latter objection.
The restatements, “Doris J. is passionate,” or “Both Good brothers are 5¢10≤tall,” also are not statistical in nature because they concern specific individuals rather than populations (Hagood, 1941).
If we quantify “passionate” to mean “has an orgasm more than 95% of the time consensual sex is performed,” then the hypothesis “80% of red-heads are passionate” becomes testable. Note that defining “passionate” to mean “has an orgasm every time consensual sex is performed” would not be provable as it is a statement of the “all or none” variety.
Finally, note that until someone succeeds in locating unicorns, the hypothesis “80% of unicorns are passionate” is nottestable.
Formulate your hypotheses so they are quantifiable, testable, and statistical in nature.
How Precise Must a Hypothesis Be?
The chief executive of a drug company may well express a desire to test whether “our anti-hypertensive drug can beat the competition.” But to apply statistical methods, a researcher will need precision on the order of “For males over 40 suffering from chronic hypertension, a daily dose of 100 mg of our new drug will lower diastolic blood pressure an average of 10 mm Hg more than an equivalent dose of metoprolol.”
The researcher may want to test a preliminary hypothesis on the order of “For males over 40 suffering from chronic hypertension, there is a daily
dose of our new drug which will lower diastolic blood pressure an average of 20 mm Hg.” But this hypothesis is imprecise. What if the necessary dose of the new drug required taking a tablet every hour? Or caused liver malfunction? Or even death? First, the researcher would conduct a set of clinical trials to determine the maximum tolerable dose (MTD) and then test the hypothesis, “For males over 40 suffering from chronic hyperten-sion, a daily dose of one-third to one-fourth the MTD of our new drug will lower diastolic blood pressure an average of 20 mm Hg.”
CHAPTER 2 HYPOTHESES: THE WHY OF YOUR RESEARCH 13 1
Chiles [2001, p. 61]. A BILL OF RIGHTS
• Scientists can and should be encouraged to make subgroup analyses.
• Physicians and engineers should be encouraged to make decisions utilizing the findings of such analyses.
• Statisticians and other data analysts can and should rightly refuse to give their imprimatur to related tests of significance.
In a series of articles by Horwitz et al. [1998], a physician and his col-leagues strongly criticize the statistical community for denying them (or so they perceive) the right to provide a statistical analysis for subgroups not contemplated in the original study protocol. For example, suppose that in a study of the health of Marine recruits, we notice that not one of the dozen or so women who received the vaccine contracted pneumonia. Are we free to provide a pvalue for this result?
Statisticians Smith and Egger [1998] argue against hypothesis tests of subgroups chosen after the fact, suggesting that the results are often likely to be explained by the “play of chance.” Altman [1998b, pp. 301–303], another statistician, concurs noting that “. . . the observed treatment effect is expected to vary across subgroups of the data . . . simply through chance variation” and that “doctors seem able to find a biologically plausible explanation for any finding.” This leads Horwitz et al. [1998] to the incorrect conclusion that Altman proposes we “dispense with clinical biology (biologic evidence and pathophysiologic reasoning) as a basis for forming subgroups.” Neither Altman nor any other statistician would quarrel with Horwitz et al.’s assertion that physicians must investigate “how do we [physicians] do our best for a particular patient.”
be pressured to give their imprimatur to what, in statistical terms, is clearly an improper procedure, nor should statisticians mislabel suboptimal proce-dures as the best that can be done.2
We concur with Anscombe [1963], who writes, “. . . the concept of error probabilities of the first and second kinds . . . has no direct relevance to experimentation. . . . The formation of opinions, decisions concerning further experimentation and other required actions, are not dictated . . . by the formal analysis of the experiment, but call for judgment and imagina-tion. . . . It is unwise for the experimenter to view himself seriously as a decision-maker. . . . The experimenter pays the piper and calls the tune he likes best; but the music is broadcast so that others might listen. . . .”
NULL HYPOTHESIS
“A major research failing seems to be the exploration of uninteresting or even trivial questions. . . . In the 347 sampled articles in Ecologycontaining null hypotheses tests, we found few examples of null hypotheses that seemed biologically plausible.” Anderson, Burnham, and Thompson [2000].
Test Only Relevant Null Hypotheses
The “null hypothesis” has taken on an almost mythic role in contempo-rary statistics. Obsession with the “null” has been allowed to shape the direction of our research. We’ve let the tool use us instead of our using the tool.3
While a null hypothesis can facilitate statistical inquiry—an exact permu-tation test is impossible without it—it is never mandated. In any event, virtually any quantifiable hypothesis can be converted into null form. There is no excuse and no need to be content with a meaningless null.
To test that the mean value of a given characteristic is three, subtract three from each observation and then test the “null hypothesis” that the mean value is zero.
Often, we want to test that the size of some effect is inconsequential, not zero but close to it, smaller than d, say, where dis the smallest biological, medical, physical or socially relevant effect in your area of research. Again, subtract dfrom each observation, before proceeding to test a null hypothesis. In Chapter 5 we discuss an alternative approach using confidence intervals for tests of equivalence.
14 PART I FOUNDATIONS
2 One is reminded of the Dean, several of them in fact, who asked me to alter my grades. “But that is something you can do as easily as I.” “Why Dr. Good, I would never dream of overruling one of my instructors.”
3
To test that “80% of redheads are passionate,” we have two choices depending on how “passion” is measured. If “passion” is an all-or-none phenomenon, then we can forget about trying to formulate a null hypothesis and instead test the binomial hypothesis that the probability p that a redhead is passionate is 80%. If “passion” can be measured on a seven-point scale and we define “passionate” as “passion” greater than or equal to 5, then our hypothesis becomes “the 20th percentile of redhead passion exceeds 5.” As in the first example above, we could convert this to a “null hypothesis” by subtracting five from each observation. But the effort is unnecessary.
NEYMAN–PEARSON THEORY
Formulate your alternative hypotheses at the same time you set forth your principal hypothesis.
When the objective of our investigations is to arrive at some sort of con-clusion, then we need to have not only a hypothesis in mind, but also one or more potential alternative hypotheses.
The cornerstone of modern hypothesis testing is the Neyman–Pearson Lemma. To get a feeling for the working of this lemma, suppose we are testing a new vaccine by administering it to half of our test subjects and giving a supposedly harmless placebo to each of the remainder. We
proceed to follow these subjects over some fixed period and to note which subjects, if any, contract the disease that the new vaccine is said to offer protection against.
We know in advance that the vaccine is unlikely to offer complete pro-tection; indeed, some individuals may actually come down with the disease as a result of taking the vaccine. Depending on the weather and other factors over which we have no control, our subjects, even those who received only placebo, may not contract the disease during the study period. All sorts of outcomes are possible.
The tests are being conducted in accordance with regulatory agency guidelines. From the regulatory agency’s perspective, the principal hypothesis H is that the new vaccine offers no protection. Our alternative hypothesis A is that the new vaccine can cut the number of infected indi-viduals in half. Our task before the start of the experiment is to decide which outcomes will rule in favor of the alternative hypothesis A and which in favor of the null hypothesis H.
The problem is that because of the variation inherent in the disease process, each and every one of the possible outcomes could occur regard-less of which hypothesis is true. Of course, some outcomes are more likely if H is true (for example, 50 cases of pneumonia in the placebo group and
48 in the vaccine group), and others are more likely if the alternative hypothesis is true (for example, 38 cases of pneumonia in the placebo group and 20 in the vaccine group).
Following Neyman and Pearson, we order each of the possible out-comes in accordance with the ratio of its probability or likelihood when the alternative hypothesis is true to its probability when the principal hypothesis is true. When this likelihood ratio is large, we shall say the outcome rules in favor of the alternative hypothesis. Working downwards from the outcomes with the highest values, we continue to add outcomes to the rejectionregion of the test—so-called because these are the out-comes for which we would reject the primary hypothesis—until the total probability of the rejection region under the null hypothesis is equal to some predesignated significance level.
To see that we have done the best we can do, suppose we replace one of the outcomes we assigned to the rejection region with one we did not. The probability that this new outcome would occur if the primary hypothesis is true must be less than or equal to the probability that the outcome it replaced would occur if the primary hypothesis is true. Other-wise, we would exceed the significance level. Because of how we assigned outcome to the rejection region, the likelihood ratio of the new outcome is smaller than the likelihood ratio of the old outcome. Thus the probabil-ity the new outcome would occur if the alternative hypothesis is true must be less than or equal to the probability that the outcome it replaced would occur if the alternative hypothesis is true. That is, by swapping outcomes we have reduced the power of our test. By following the method of Neyman and Pearson and maximizing the likelihood ratio, we obtain the most powerful test at a given significance level.
To take advantage of Neyman and Pearson’s finding, we need to have an alternative hypothesis or alternatives firmly in mind when we set up a test. Too often in published research, such alternative hypotheses remain unspecified or, worse, are specified only afterthe data are in hand. We must specify our alternatives before we commence an analysis, preferably at the same time we design our study.
Are our alternatives one-sided or two-sided? Are they ordered or unordered? The form of the alternative will determine the statistical procedures we use and the significance levels we obtain.
Decide beforehand whether you wish to test against a one-sided or a two-sided alternative.
One-Sided or Two-Sided
Suppose on examining the cancer registry in a hospital, we uncover the following data that we put in the form of a 2 ¥2 contingency table.
The 9 denotes the number of males who survived, the 1 denotes the number of males who died, and so forth. The four marginal totals or marginals are 10, 14, 13, and 11. The total number of men in the study is 10, while 14 denotes the total number of women, and so forth.
The marginals in this table are fixed because, indisputably, there are 11 dead bodies among the 24 persons in the study and 14 women. Suppose that before completing the table, we lost the subject IDs so that we could no longer identify which subject belonged in which category. Imagine you are given two sets of 24 labels. The first set has 14 labels with the word “woman” and 10 labels with the word “man.” The second set of labels has 11 labels with the word “dead” and 13 labels with the word “alive.” Under the null hypothesis, you are allowed to distribute the labels to sub-jects independently of one another. One label from each of the two sets per subject, please.
There are a total of ways you could hand out the labels.
of the assignments result in tables that are as extreme as our original table
(that is, in which 90% of the men survive) and in tables that are
more extreme (100% of the men survive). This is a very small fraction of the total, so we conclude that a difference in survival rates of the two sexes as extreme as the difference we observed in our original table is very unlikely to have occurred by chance alone. We reject the hypothesis that the survival rates for the two sexes are the same and accept the alternative hypothesis that, in this instance at least, males are more likely to profit from treatment (Table 2.1).
In the preceding example, we tested the hypothesis that survival rates do not depend on sex against the alternative that men diagnosed with cancer are likely to live longer than women similarly diagnosed. We rejected the null hypothesis because only a small fraction of the possible tables were as extreme as the one we observed initially. This is an example of a one-tailed test. But is it the correct test? Is this really the alternative hypothesis we would have proposed if we had not already seen the data? Wouldn’t we have been just as likely to reject the null hypothesis that men
14 11 10 0 Ê Ë Á ˆ¯˜ÊËÁ ˆ¯˜ 14 10 10 1 Ê Ë Á ˆ ¯ ˜Ê Ë Á ˆ ¯ ˜ 24 10 Ê Ë Á ˆ ¯ ˜
CHAPTER 2 HYPOTHESES: THE WHY OF YOUR RESEARCH 17
Survived Died Total
Men 9 1 10
Women 4 10 14
and women profit the same from treatment if we had observed a table of the following form?
18 PART I FOUNDATIONS
TABLE 2.1 Survial Rates of Men and Womena
a In terms of the Relative Survival Rates of the Two Sexes,
the first of these tables is more extreme than our original table. The second is less extreme.
Survived Died Total
Men 10 0 10
Women 3 11 14
Total 13 11 24
Survived Died Total
Men 8 2 10
Women 5 9 14
Total 13 11 24
Of course, we would! In determining the significance level in the present example, we must add together the total number of tables that lie in either of the two extremes or tails of the permutation distribution.
The critical values and significance levels are quite different for one-tailed and two-one-tailed tests; all too often, the wrong test has been employed in published work. McKinney et al. [1989] reviewed some 70 plus articles that appeared in six medical journals. In over half of these articles, Fisher’s exact test was applied improperly. Either a one-tailed test had been used when a two-tailed test was called for or the authors of the paper simply hadn’t bothered to state which test they had used.
Of course, unless you are submitting the results of your analysis to a regulatory agency, no one will know whether you originally intended a one-tailed test or a two-tailed test and subsequently changed your mind. No one will know whether your hypothesis was conceived before you started or only after you’d examined the data. All you have to do is lie. Just recognize that if you test an after-the-fact hypothesis without identify-ing it as such, you are guilty of scientific fraud.
When you design an experiment, decide at the same time whether you wish to test your hypothesis against a two-sided or a one-sided alternative.
Survived Died Total
Men 0 10 10
Women 13 1 14
A two-sided alternative dictates a two-tailed test; a one-sided alternative dictates a one-tailed test.
As an example, suppose we decide to do a follow-on study of the cancer registry to confirm our original finding that men diagnosed as having tumors live significantly longer than women similarly diagnosed. In this follow-on study, we have a one-sided alternative. Thus, we would analyze the results using a one-tailed test rather than the two-tailed test we applied in the original study.
Determine beforehand whether your alternative hypotheses are ordered or unordered.
Ordered or Unordered Alternative Hypotheses?
When testing qualities (number of germinating plants, crop weight, etc.) from ksamples of plants taken from soils of different composition, it is often routine to use the F ratio of the analysis of variance. For contin-gency tables, many routinely use the chi-square test to determine if the differences among samples are significant. But the F-ratio and the chi-square are what are termed omnibus tests, designed to be sensitive to all possible alternatives. As such, they are not particularly sensitive to ordered alternatives such “as more fertilizer more growth” or “more aspirin faster relief of headache.” Tests for such ordered responses at kdistinct treat-ment levels should properly use the Pitman correlation described by Frank, Trzos, and Good [1978] when the data are measured on a metric scale (e.g., weight of the crop). Tests for ordered responses in 2 ¥ C contin-gency tables (e.g., number of germinating plants) should use the trend test described by Berger, Permutt, and Ivanova [1998]. We revisit this topic in more detail in the next chapter.
DEDUCTION AND INDUCTION
When we determine a p value as we did in the example above, we apply a set of algebraic methods and deductive logic to deduce the correct value. The deductive process is used to determine the appropriate size of resistor to use in an electric circuit, to determine the date of the next eclipse of the moon, and to establish the identity of the criminal (perhaps from the fact the dog did not bark on the night of the crime). Find the formula, plug in the values, turn the crank, and out pops the result (or it does for Sherlock Holmes,4at least).
When we assert that for a given population a percentage of samples will have a specific composition, this also is a deduction. But when we make an
CHAPTER 2 HYPOTHESES: THE WHY OF YOUR RESEARCH 19 4
inductive generalization about a population based upon our analysis of a sample, we are on shakier ground. It is one thing to assert that if an observation comes from a normal distribution with mean zero, the proba-bility is one-half that it is positive. It is quite another if, on observing that half the observations in the sample are positive, we assert that half of all the possible observations that might be drawn from that population will be positive also.
Newton’s Law of gravitation provided an almost exact fit (apart from measurement error) to observed astronomical data for several centuries; consequently, there was general agreement that Newton’s generalization from observation was an accurate description of the real world. Later, as improvements in astronomical measuring instruments extended the range of the observable universe, scientists realized that Newton’s Law was only a generalization and not a property of the universe at all. Einstein’s Theory of Relativity gives a much closer fit to the data, a fit that has not been contradicted by any observations in the century since its formulation. But this still does not mean that relativity provides us with a complete, correct, and comprehensive view of the universe.
In our research efforts, the only statements we can make with God-like certainty are of the form “our conclusions fit the data.” The true nature of the real world is unknowable. We can speculate, but never conclude.
LOSSES
In our first advanced course in statistics, we read in the first chapter of Lehmann [1986] that the “optimal” statistical procedure would depend on the losses associated with the various possible decisions. But on day one of our venture into the real world of practical applications, we were taught to ignore this principle.
At that time, the only computationally feasible statistical procedures were based on losses that were proportional to the square of the difference between estimated and actual values. No matter that the losses really might be proportional to the absolute value of those differences, or the cube, or the maximum over a certain range. Our options were limited by our ability to compute.
Computer technology has made a series of major advances in the past half century. What required days or weeks to calculate 40 years ago takes only milliseconds today. We can now pay serious attention to this long neglected facet of decision theory: the losses associated with the varying types of decision.
Suppose we are investigating a new drug: We gather data, perform a statistical analysis, and draw a conclusion. If chance alone is at work yield-ing exceptional values and we opt in favor of the new drug, we’ve made
an error. We also make an error if we decide there is no difference and the new drug really is better. These decisions and the effects of making them are summarized in Table 2.2.
We distinguish the two types of error because they have the quite differ-ent implications described in Table 2.2. As a second example, Fears, Tarone, and Chu [1977] use permutation methods to assess several stan-dard screens for carcinogenicity. As shown in Table 2.3, their Type I error, a false positive, consists of labeling a relatively innocuous compound as carcinogenic. Such an action means economic loss for the manufacturer and the denial to the public of the compound’s benefits. Neither conse-quence is desirable. But a false negative, a Type II error, is much worse because it would mean exposing a large number of people to a potentially lethal compound.
What losses are associated with the decisions you will have to make? Specify them now before you begin.
DECISIONS
The hypothesis/alternative duality is inadequate in most real-life situa-tions. Consider the pressing problems of global warming and depletion of the ozone layer. We could collect and analyze yet another set of data and
CHAPTER 2 HYPOTHESES: THE WHY OF YOUR RESEARCH 21
The Facts Our Decision
No difference. No difference. Drug is better. Type I error:
Manufacturer wastes money developing ineffective drug. Drug is better. Type II error:
Manufacturer misses opportunity for profit. Public denied access to
effective treatment.
TABLE 2.2 Decision-Making Under Uncertainty
The Facts Fears et al.’s Decision
Compound not a Not a carcinogen. Compound a carcinogen.
carcinogen. Type I error:
Manufacturer misses opportunity for profit. Public denied access to
effective treatment. Compound a Type II error:
carcinogen. Patients die; families suffer; Manufacturer sued.
then, just as is done today, make one of three possible decisions: reduce emissions, leave emission standards alone, or sit on our hands and wait for more data to come in. Each decision has consequences as shown in Table 2.4.
As noted at the beginning of this chapter, it’s essential that we specify in advance the actions to be taken for each potential result. Always suspect are after-the-fact rationales that enable us to persist in a pattern of conduct despite evidence to the contrary. If no possible outcome of a study will be sufficient to change our mind, then perhaps we ought not undertake such a study in the first place.
Every research study involves multiple issues. Not only might we want to know whether a measurable, biologically (or medically, physically, or sociologically) significant effect takes place, but also what the size of the effect is and the extent to which the effect varies from instance to
instance. We would also want to know what factors, if any, will modify the size of the effect or its duration.
We may not be able to address all these issues with a single data set. A preliminary experiment might tell us something about the possible exis-tence of an effect, along with rough estimates of its size and variability. It is hoped that we will glean enough information to come up with doses, environmental conditions, and sample sizes to apply in collecting and eval-uating the next data set. A list of possible decisions after the initial experi-ment includes “abandon this line of research,” “modify the environexperi-ment and gather more data,” and “perform a large, tightly controlled, expensive set of trials.” Associated with each decision is a set of potential gains and losses. Common sense dictates that we construct a table similar to Table 2.2 or 2.3 before we launch a study.
For example, in clinical trials of a drug we might begin with some animal experiments, then progress to Phase I clinical trials in which, with the emphasis on safety, we look for the maximum tolerable dose. Phase I trials generally involve only a small number of subjects and a one-time or short-term intervention. An extended period of several months may be used for follow-up purposes. If no adverse effects are observed, we might decide to go ahead with a further or Phase II set of trials in the clinic in
22 PART I FOUNDATIONS
The Facts President’s Decision on Emissions Reduce emissions Gather more data Change
unnecessary No effect Economy disrupted Sampling cost
Burning of Sampling cost Decline in quality fossil fuels Decline in quality of of life responsible life (irreversible?) (irreversible?)
which our objective is to determine the minimum effective dose. Obvi-ously, if the minimum effective dose is greater than the maximum tolera-ble dose, or if some dangerous side effects are observed that we didn’t observe in the first set of trials, we’ll abandon the drug and go on to some other research project. But if the signs are favorable, then and only then will we go to a set of Phase III trials involving a large number of subjects observed over an extended time period. Then, and only then, will we hope to get the answers to all our research questions.
Before you begin, list all the consequences of a study and all the actions you might take. Persist only if you can add to existing knowledge.
TO LEARN MORE
For more thorough accounts of decision theory, the interested reader is directed to Berger [1986], Blyth [1970], Cox [1958], DeGroot [1970], and Lehmann [1986]. For an applied perspective, see Clemen [1991], Berry [1995], and Sox et al. [1988].
Over 300 references warning of the misuse of null hypothesis testing can be accessed online at the URL http://www.cnr.colostate.edu/ ~anderson/thompson1.html. Alas, the majority of these warnings are ill informed, stressing errors that will not arise if you proceed as we recom-mend and place the emphasis on the why, not the what, of statistical pro-cedures. Use statistics as a guide to decision making rather than a
mandate.
Neyman and Pearson [1933] first formulated the problem of hypothesis testing in terms of two types of error. Extensions and analyses of their approach are given by Lehmann [1986] and Mayo [1996]. For more work along the lines proposed here, see Selike, Bayarri, and Berger [2001].
Clarity in hypothesis formulation is essential; ambiguity can only yield controversy; see, for example, Kaplan [2001].
Chapter 3
Collecting Data
CHAPTER 3 COLLECTING DATA 25
T
HE VAST MAJORITY OF ERRORS IN STATISTICS—AND,not incidentally, in most human endeavors—arise from a reluctance (or even an inability) to plan. Some demon (or demonic manager) seems to be urging us to cross the street before we’ve had the opportunity to look both ways. Even on those rare occasions when we do design an experiment, we seem more obsessed with the mechanics than with the concepts that underlie it.In this chapter we review the fundamental concepts of experimental design, the determination of sample size, the assumptions that underlie most statistical procedures, and the precautions necessary to ensure that they are satisfied and that the data you collect will be representative of the population as a whole. We do not intend to replace a text on experiment or survey design, but to supplement it, providing examples and solutions that are often neglected in courses on the subject.
PREPARATION
The first step in data collection is to have a clear, preferably written state-ment of your objectives. In accordance with Chapter 1, you will have defined the population or populations from which you intend to sample and have identified the characteristics of these populations you wish to investigate.
You developed one or more well-formulated hypotheses (the topic of Chapter 2) and have some idea of the risks you will incur should your analysis of the collected data prove to be erroneous. You will need to
GIGO Garbage in, garbage out.
decide what you wish to observe and measure and how you will go about observing it.
Good practice is to draft the analysis section of your final report based on the conclusions you would like to make. What information do you need to justify these conclusions? All such information must be collected.
The next section is devoted to the choice of measuring devices, fol-lowed by sections on determining sample size and preventive steps to ensure your samples will be analyzable by statistical methods.
MEASURING DEVICES
Know what you want to measure. Collect exact values whenever possible.
Know what you want to measure. Will you measure an endpoint such as death or measure a surrogate such as the presence of HIV antibodies? The regression slope describing the change in systolic blood pressure (in mm Hg) per 100 mg of calcium intake is strongly influenced by the approach used for assessing the amount of calcium consumed (Cappuccio et al., 1995). The association is small and only marginally significant with diet histories (slope -0.01 (-0.003 to -0.016)) but large and highly significant when food frequency questionnaires are used (-0.15 (-0.11 to -0.19)). With studies using 24-hour recall, an intermediate result emerges (-0.06 (-0.09 to -0.03)). Diet histories assess patterns of usual intake over long periods of time and require an extensive interview with a nutritionist, whereas 24-hour recall, and food frequency questionnaires are simpler methods that reflect current consumption (Block, 1982).
Before we initiate data collection, we must have a firm idea of what we will measure.
A second fundamental principle is also applicable to both experiments and surveys: Collect exact values whenever possible. Worry about group-ing them in interval or discrete categories later.
A long-term study of buying patterns in New South Wales illustrates some of the problems caused by grouping prematurely. At the beginning of the study, the decision was made to group the incomes of survey sub-jects into categories, under $20,000, $20,000 to $30,000, and so forth. Six years of steady inflation later, the organizers of the study realized that all the categories had to be adjusted. An income of $21,000 at the start of the study would only purchase $18,000 worth of goods and housing at the end. The problem was that those surveyed toward the end had filled out forms with exactly the same income categories. Had income been tabulated to the nearest dollar, it would have been easy to correct for increases in the cost of living and convert all responses to the same scale.
But the study designers hadn’t considered these issues. A precise and costly survey was now a matter of guesswork.
You can always group your results (and modify your groupings) after a study is completed. If after-the-fact grouping is a possibility, your design should state how the grouping will be determined; otherwise there will be the suspicion that you chose the grouping to obtain desired results.
Experiments
Measuring devices differ widely both in what they measure and in the pre-cision with which they measure it. As noted in the next section of this chapter, the greater the precision with which measurements are made, the smaller the sample size required to reduce both Type I and Type II errors below specific levels.
Before you rush out and purchase the most expensive and precise mea-suring instruments on the market, consider that the total cost C of an experimental procedure is S+ nc, where nis the sample size and cis the cost per unit sampled.
The startup cost Sincludes the cost of the measuring device. cis made up of the cost of supplies and personnel costs. The latter includes not only the time spent on individual measurements but also the time spent in preparing and calibrating the instrument for use.
Less obvious factors in the selection of a measuring instrument include impact on the subject, reliability (personnel costs continue even when an instrument is down), and reusability in future trials. For example, one of the advantages of the latest technology for blood analysis is that less blood needs to be drawn from patients. Less blood means happier subjects, fewer withdrawals, and a smaller initial sample size.
Surveys
While no scientist would dream of performing an experiment without first mastering all the techniques involved, an amazing number will blunder into the execution of large-scale and costly surveys without a preliminary study of all the collateral issues a survey entails.
We know of one institute that mailed out some 20,000 questionnaires (didn’t the post office just raise its rates again?) before discovering that half the addresses were in error and that the vast majority of the remain-der were being discarded unopened before prospective participants had even read the “sales pitch.”
Fortunately, there are texts such as Bly [1990, 1996] that will tell you how to word a “sales pitch” and the optimal colors and graphics to use along with the wording. They will tell you what “hooks” to use on the envelope to ensure attention to the contents and what premiums to offer to increase participation.
There are other textbooks such as Converse and Presser [1986], Fowler and Fowler [1995], and Schroeder [1987] to assist you in wording ques-tionnaires and in pretesting questions for ambiguity before you begin. We have only two paragraphs of caution to offer:
1. Be sure your questions don’t reveal the purpose of your study; otherwise, respondents shape their answers to what they perceive to be your needs. Contrast “how do you feel about compulsory pregnancy?” with “how do you feel about abortions?”
2. With populations ever more heterogeneous, questions that work with some ethnic groups may repulse others (see, for example, Choi [2000]).
Recommended are web-based surveys with initial solicitation by mail (letter or post card) and email. Not only are both costs and time to com-pletion cut dramatically, but also the proportion of missing data and incomplete forms is substantially reduced. Moreover, web-based surveys are easier to monitor, and forms may be modified on the fly. Web-based entry also offers the possibility of displaying the individual’s prior responses during follow-up surveys.
Three other precautions can help ensure the success of your survey:
1. Award premiums only for fully completed forms.
2. Continuously tabulate and monitor submissions; don’t wait to be surprised.
3. A quarterly newsletter sent to participants will substantially increase retention (and help you keep track of address changes).
DETERMINING SAMPLE SIZE
Determining optimal sample size is simplicity itself once we specify all of the following:
• Desired power and significance level.
• Distributions of the observables.
• Statistical test(s) that will be employed.
• Anticipated losses due to nonresponders, noncompliant partici-pants, and dropouts.
Power and Significance Level
Understand the relationships among sample size, significance level, power, and precision of the measuring instruments.
Sample size must be determined for each experiment; there is no uni-versally correct value (Table 3.1). Increase the precision (and hold all other parameters fixed) and we can decrease the required number of observations.
Permit a greater number of Type I or Type II errors (and hold all other parameters fixed) and we can decrease the required number of observations.
Explicit formula for power and significance level are available when the underlying observations are binomial, the results of a counting or Poisson process, or normally distributed. Several off-the-shelf computer programs including nQuery AdvisorTM, Pass 2000TM, and StatXactTMare available to do the calculations for us.
To use these programs, we need to have some idea of the location (mean) and scale parameter (variance) of the distribution both when the primary hypothesis is true and when an alternative hypothesis is true. Since there may well be an infinity of alternatives in which we are inter-ested, power calculations should be based on the worst-case or boundary value. For example, if we are testing a binomial hypothesis p=1/2 against the alternatives p£2/3, we would assume that p =2/3.
If the data do not come from one of the preceding distributions, then we might use a bootstrap to estimate the power and significance level.
In preliminary trials of a new device, the following test results were observed: 7.0 in 11 out of 12 cases and 3.3 in 1 out of 12 cases. Industry guidelines specified that any population with a mean test result greater than 5 would be acceptable. A worst-case or boundary-value scenario would include one in which the test result was 7.0 3/7th of the time, 3.3 3/7th of the time, and 4.1 1/7th of the time.
The statistical procedure required us to reject if the sample mean of the test results were less than 6. To determine the probability of this event for various sample sizes, we took repeated samples with replacement from the two sets of test results. Some bootstrap samples consisted of all 7’s, whereas some, taken from the worst-case distribution, consisted only of
CHAPTER 3 COLLECTING DATA 29 Type I error (a) Probability of falsely rejecting the hypothesis when it is
true.
Type II error (1 -b[A]) Probability of falsely accepting the hypothesis when an alternative hypothesis A is true. Depends on the alternative A.
Power =b[A] Probability of correctly rejecting the hypothesis when an alternative hypothesis A is true. Depends on the alternative A.
Distribution functions F[(x -m)s], e.g., normal distribution.
Location parameters For both hypothesis and alternative hypothesis: m1, m2. Scale parameters For both hypothesis and alternative hypothesis: s1, s2. Sample sizes May be different for different groups in an experiment
with more than one group