Analysis of the efficiency in the Spanish National
Barley Breeding Program. Past results and
prospects for future improvements using
molecular markers
Elsayed Mansour Elsayed
Dipòsit Legal: L.293-2013
http://hdl.handle.net/10803/111291
Analysis of the efficiency in the Spanish National Barley Breeding Program. Past results and prospects for future improvements using molecular markers està subjecte a una llicència de Reconeixement-NoComercial-SenseObraDerivada 3.0 No adaptada de Creative Commons
Les publicacions incloses en la tesi no estan subjectes a aquesta llicència i es mantenen sota les condicions originals.
(c) 2013, Elsayed Mansour Elsayed
Nom/Logotip de la Universitat on s’ha
Analysis of the efficiency in the Spanish National
Barley Breeding Program. Past results and
prospects for future improvements using
molecular markers
PhD
Elsayed Mansour Elsayed
April 22, 2013
Analysis of the efficiency in the Spanish National
Barley Breeding Program. Past results and
prospects for future improvements using
molecular markers
This work was carried out at the Department of Genetics and Plant
Production, Aula Dei Experimental Station (EAAD), Spanish National
Research Council (CSIC)
Tutor
Prof. Ignacio Romagosa
Clariana
Department of Crop and Forest
Sciences, University of Lleida
Under the supervision of
Dr. Ernesto Igartua Arregui
Dr. Ana M. Casas Cendoya
Department of Genetics and Plant
Production, Aula Dei Experimental
Station (EEAD) - Spanish National
Research Council, CSIC
Thesis presented by
Elsayed Mansour Elsayed
to get the European PhD grade
of Lleida University
UNIVERSITAT DE LLEIDA
Escola Técnica Superior d’Enginyeria Agrária
Memoria presentada por Elsayed Mansour Elsayed, Ingeniero
Agrónomo, para optar al grado de Doctor Ingeniero Agrónomo
por la Universidad de Lleida
El Doctorando
AUTORIZACIÓN DE LOS DIRECTORES PARA LA PRESENTACIÓN
DE TESIS DOCTORAL
D. ERNESTO IGARTUA ARREGUI, Investigador Científico del Consejo Superior de Investigaciones Científicas y Dª ANA MARÍA CASAS CENDOYA, Científico Titular del mismo organismo
INFORMAN:
Que la tesis doctoral titulada “Analysis of the efficiency in the Spanish National Barley Breeding Program. Past results and prospects for future improvements
using molecular markers” ha sido realizada por el Ingeniero Agrónomo D. ELSAYED
MANSOUR ELSAYED, en el Departamento de Genética y Producción Vegetal, de la Estación Experimental de Aula Dei del Consejo Superior de Investigaciones Científicas bajo su dirección y reúne, a su juicio, las condiciones requeridas para optar al Grado de Doctor Ingeniero Agrónomo.
Zaragoza, Febrero de 2013
AUTORIZACIÓN DEL TUTOR ACADÉMICO PARA LA
PRESENTACIÓN DE TESIS DOCTORAL
D. IGNACIO ROMAGOSA CLARIANA, Catedrático de la Universidad de Lleida,
INFORMA:
Que la Tesis Doctoral titulada “Analysis of the efficiency in the Spanish National Barley Breeding Program. Past results and prospects for future improvements
using molecular markers” ha sido realizada por el Ingeniero Agrónomo D. ELSAYED
MANSOUR ELSAYED, en el Departamento de Genética y Producción Vegetal, de la Estación Experimental de Aula Dei del Consejo Superior de Investigaciones Científicas bajo su tutela y reúne, a su juicio, las condiciones requeridas para optar al Grado de Doctor Ingeniero Agrónomo
Lleida, Febrero de 2013
Acknowledgment
I would like to express my deep and sincere gratitude to Dr. Ernesto Igartua and Dr. Ana Casas for their admirable supervision, excellent work, availability at all times, fruitful and interesting discussions and giving me this great opportunity to achieve this thesis.
Also I would like to thank Dr. José Manuel Lasa and Dr. Pilar Gracia for their advice, and my colleagues of barley group in the Department of Genetics and Plant Production, EEAD-CSIC, Blanca Medina, Blanca Abad, Pili Becerrica, Pili Asín, Clarisa Gracia, Tere Acín, Vanesa Martínez, Carlos Pérez Cantalapiedra, Bruno Contreras, Cristina Silvar and Cristina Casao for their help and support.
I extend my sincere gratitude to Prof. Ignacio Romagosa for accepting tutoring of this thesis, and to Dr. Bill Thomas for his kind help and hospitality during my stay in The James Hutton Institute, and to Prof. Patrick Hayes and Dr. Alfonso Cuesta-Marcos for their kind help and hospitality during my stay in Oregon State University.
And I would like to thank my professors and colleagues in the Department of Agronomy, Faculty of Agriculture, Zagazig University, Egypt, for their continuing motivation and support.
And my special appreciation for my parents, my brothers, my sisters and my wife for their encouragement and continuing support.
List of the abbreviations used
A1: Albacete dry-land
A2: Albacete irrigated
AMMI: Additive main effect and multiplicative interaction model
ANOVA: Analyses of variance
ARE: Grain area
cM: Centimorgan
DHE: Days to heading
E: Environment (combinations of years and locations)
G: Genetic gain
GBS: Genotyping-by-sequencing
GEI: Genotype-by-environment interaction
GL: Genotype-by-location
GLY: Genotype-by-location-by-year
GRW: Growth habit
GY: Genotype-by-year
h2: Heritability
H: Realized heritability
ha Hectare
HEC: Hectolitre weight
L: Location
L1: Artesa
L2: Bell-lloc
L3: Gimenells
L4: Solsona
LEN: Grain length
LY: Location-by-year
MAS: Marker assisted selection
MAT: Maturity time
MET: Multi Environment Trials
PCA: Principal component axis
PHE : Plant height
POW: Powdery mildew
QTL: Quantitative trait loci
REML: Restricted maximum likelihood
RILs: Recombinant inbred lines
S: Selection differential
SNP: Single nucleotide polymorphism
SPO: Spot blotch
TGW: Thousand grain weight
V1: Valladolid capital
V2: Villahoz
V3: Ceinos
V5: Macotera
VIG: Early vigor
WID: Grain width
Y: Year
YLD: Grain yield
Z1: Sádaba
Z2: Vedado
Index
Summary / Resumen / Resum 1
Chapter 1: General Introduction 9 1.1 Economic importance 11 1.2 Taxonomy and diversity 12 1.3 Cytology and Genetics 13
1.4 QTL analysis 15
1.4.1 Genetic mapping 16 1.4.2 Molecular marker 18 1.4.3 Mapping populations 19 1.5 Genotype by environment interaction 20
1.6 Flowering date 22
1.7 References 24
Chapter 2: Objectives 35
Chapter 3: Progress in the Spanish National Barley Breeding Program 39
3.1 Introduction 41
3.2 Material and methods 43
3.3 Results 48
3.4 Discussion 56
3.5 References 60
Chapter 4: Relationship between genotype-by-environment interaction and vernalization requirement in barley grown in Spain 63
4.1 Introduction 65
4.2 Material and methods 67
4.3 Results 71
4.4 Discussion 83
Chapter 5: QTL for agronomic traits in an elite barley population
for Mediterranean conditions 89
5.1 Introduction 91
5.2 Material and methods 92
5.3 Results 97
5.4 Discussion 110
5.5 References 118
Chapter 6: Genomic regions affected by selection in a barley breeding program 123
6.1 Introduction 125
6.2 Material and methods 126
6.3 Results 129
6.4 Discussion 142
6.5 References 145
Chapter 7: General Discussion 153
Chapter 8: Conclusions 165
Index of Tables
Table 1.1. Barley cultivation area and production in Spain and Europe over the
last 10 years. 12
Table 3.1. Coordinates of the testing locations of the Spanish National Barley Breeding Program and nearby meteorological stations used to collect long term climatic data. 44
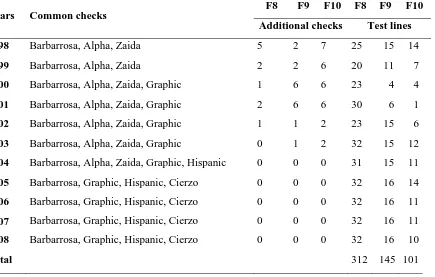
Table 3.2. Summary of lines and checks used in the advanced generations trials at the Spanish Barley Breeding Program. 45
Table 3.3. Grain yield expressed as percentage of checks and average productivity in different locations and provinces, in the last three generations (F8, F9 and F10) of the Spanish Barley Breeding Program from 1998 to 2008. Averages across provinces and overall average, calculated with REML, in bold type.
49
Table 3.4. Selection differential (S), genetic gain (G), and realized heritability (H, expressed as percentage of expected gain) calculated for groups of lines in two sets of consecutive generations (F8-F9 and F9-F10) tested in the same locations.
50
Table 3.5. Components of variance for grain yield in the Spanish Barley Breeding Program. Two periods (1996-2004 and 2005-2008) were chosen according to the presence of sets of common checks. 51
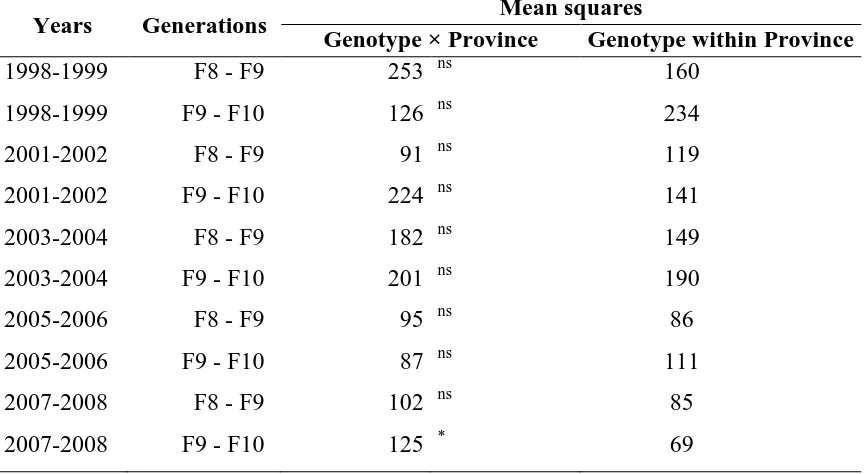
Table 3.6. Summary of the genotype-by-environment interaction factor for ten different analyses of variance for relative yield. The analyses were performed for ten sets of genotypes, which were balanced over two-year trials, either F8 and F9 or F9 and F10.
52
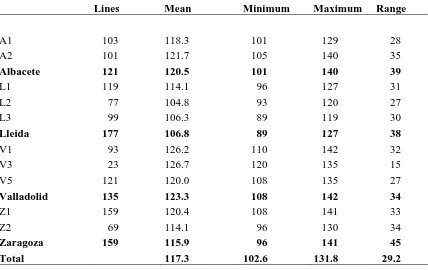
Table 3.7. Summary of number of lines, flowering date means, minimum, maximum, expressed as the number of days from January 1st”, and range of flowering dates for the breeding lines under study (checks excluded), by location and province. Means are REML estimates, whereas minimum, maximum and ranges were calculated with raw values. Averages across provinces and overall average in bold type.
53
Table 3.8. Results of the regression analyses between relative yield and flowering time in the trials during the period of the study. 54
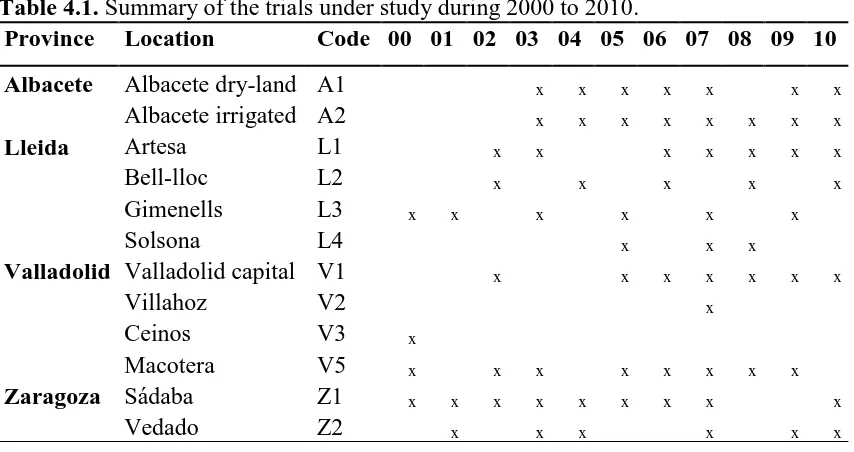
Table 4.1. Summary of the trials under study during 2000 to 2010. 68
Table 4.2. Summary of the check cultivars in advanced trials (F8, F9, F10) of the Spanish Barley Breeding Program during 2000 to 2010. 68
Table 4.3. Coordinates of the testing locations of the National Barley Breeding Program and nearby meteorological stations used to collect long term climatic data.
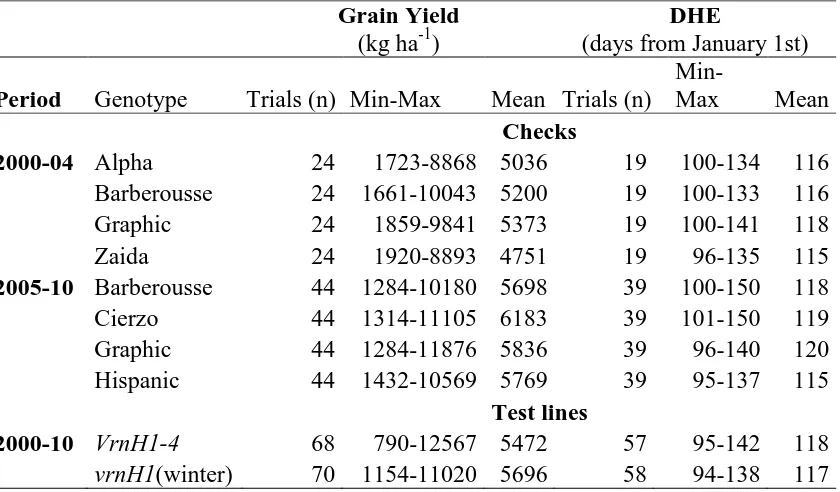
Table 4.4. Mean, minimum and maximum of the productivity average of grain yield and days to heading for the checks and test lines studied at multienvironment trials, in the Spanish Barley Breeding Program during the period 2000 to2010.
71
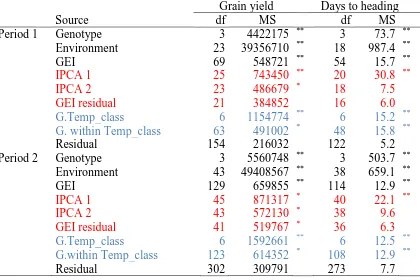
Table 4.5. Analysis of variance and AMMI for grain yield and days to heading of the genotypes across environment during the two time periods, 1 and 2. Colours indicate two different partitions of the GEI term. 72
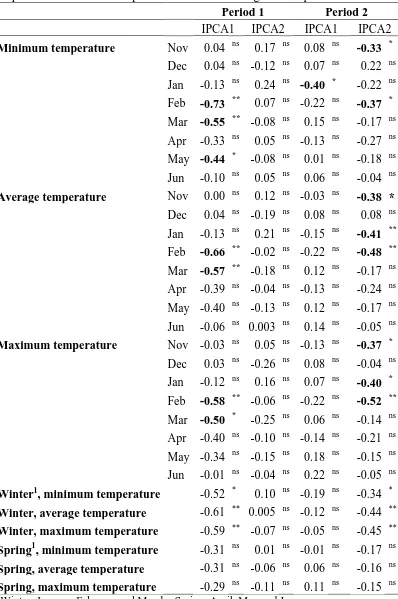
Table 4.6. Correlation coefficients between the first two principal components of the AMMI analyses for grain yield and the minimum, average, maximum monthly temperature and variables expressed as seasonal averages of temperatures.
74
Table 4.7. Correlation coefficients between the first two principal components of the AMMI analyses for grain yield and rainfall. 75
Table 4.8. Correlation coefficients between the first two principal components from the AMMI of days to heading and the minimum, average, maximum monthly temperature and variables expressed as seasonal averages of temperature and rainfall.
76
Table 4.9. Mean squares for relative grain yield and days to heading using as factors the two main alleles of VrnH1 identified in the advanced lines of the breeding program, across the three classes of winter temperatures ‘low’, ‘intermediate’ and ‘high’.
79
Table 4.10. Averages of grain yield and days to heading of the check cultivars across the field trials divided in classes according to their average
winter temperature. 81
Table 4.11. Genetic constitution for vernalization and photoperiod genes in the
cultivars under study. 83
Table 5.1. Description of the field trials. 93
Table 5.2. Traits measured or recorded at each of the five field trials. 94
Table 5.3. Descriptive statistics (mean, minimum, maximum, standard deviation and coefficient of variation) for the agronomic traits observed in the parents (Orria, Plaisant) and in the population of 112 RILs.
97
Table 5.4. Analysis of variance for the agronomic traits measured in five trials, for a population of 112 RILs from the cross Orria×Plaisant (degrees of freedom, df and mean squares, ms are presented). 99
Table 5.6. QTLs for agronomic traits detected by composite interval mapping in the RILs of ‘Orria’ × ‘Plaisant’ cross in the five trials. 106
Table 6.1. Description of the genotypes and markers under study. 127
Table 6.2. Selection history of the lines derived from three crosses between parents Orria and Plaisant in the Spanish barley breeding program. 130
Table 6.3. Average of relative grain yield (expressed as percentage of common check cultivars) of the lines derived from the three crosses of Orria and Plaisant, compared to the overall average of all lines derived from other crosses evaluated in the same trials.
130
Table 6.4. SSR markers used in the F2 population, number of genotypes at each marker locus, and X2 probability calculated for the observed allelic frequencies (probability of being originated from random assortment of alleles in absence of selection).
133
Table 6.5. SSR, SNP markers and flowering time genes evaluated in F8 lines. Genotypic and allelic frequencies, and X2 probability for the observed allelic frequencies (probability of being originated from random assortment of alleles in absence of selection).
134
Table 6.6. Number of GBS SNPs matched with unique or multiple genomic locations in the barley physical map. 137
Table 6.7. Markers or flowering genes chosen to relate the QTL or segregation distortion identified in the RIL population with GBS markers positioned in the barley physical map. Markers positioned in silico in the barley physical map. Numbering indicates tags included for these markers in Figs. 6.2 and 6.3.
Index of Figures
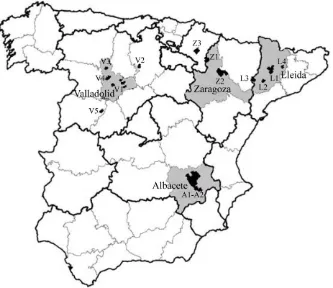
Figure 3.1. Location of the testing sites of the Spanish National Barley Breeding Program. Provinces (in grey) and locations (in black)
hosting field trials. 42
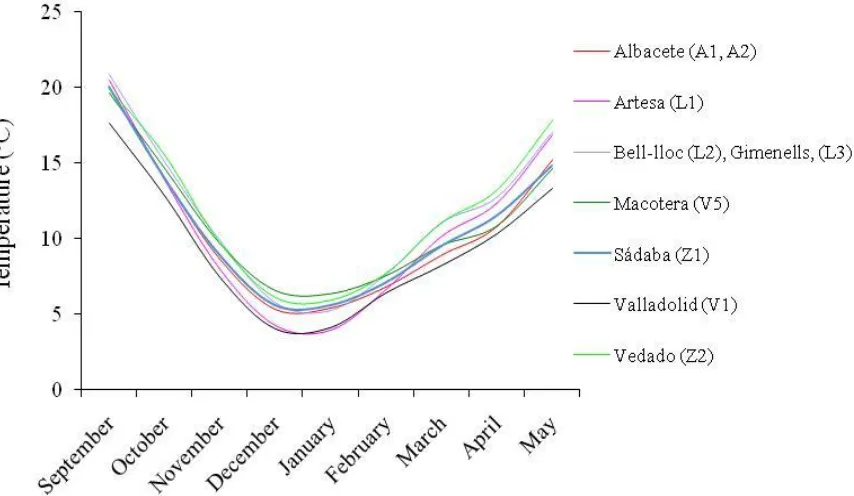
Figure3.2. Long term monthly average temperatures for the testing locations. 44
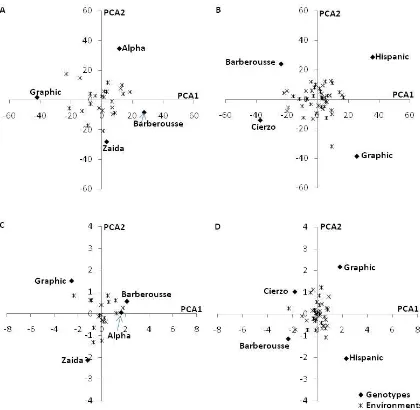
Figure 4.1. AMMI 2 model biplots for grain yield and days to heading of the winter and spring check cultivars during periods 1 (A grain yield, C days to heading) and 2 (B grain yield, D days to heading). 73
Figure 4.2. AMMI-2 model biplots for grain yield and days to heading of the check cultivars and the averages of the advanced lines (divided by the allele present at VrnH1, VrnH1-4 or vrnH1) during periods 1 (A grain yield, C days to heading) and 2 (B grain yield, D days to heading).
78
Figure 4.3. The averages of relative grain yield vs days to heading of the sets of advanced breeding lines, according to their VrnH1 alleles (VrnH1-4
or vrnH1), across the field trials divided in classes according to average winter temperatures. Vertical and horizontal segments represent the LSD (P<0.05) for days to heading and relative grain yield, respectively.
80
Figure 4.4. Relationship between relative grain yield and days to heading for the lines like Orria in VrnH1 (VrnH1-4) and for the lines that had typical winter vrnH1, and their response to temperature during winter.
82
Figure 5.1. Monthly average, minimum and maximum temperatures for the testing locations in Lleida (L), Zaragoza (Z), and Fiorenzuola d’Arda (F) during the field seasons 2008-09 and 2009-10. 93
Figure 5.2. Plot of the first two axis of a principal component analysis carried out with the variables days to heading, plant height, thousand grain weight and grain yield, measured at five field trials. 101
Figure 5.3. Linkage map of the RIL population from the cross between barley cultivars Orria and Plaisant. Map positions are given in centimorgans (cM), using the Kosambi function. The two major flowering time genes segregating in this population are highlighted in red font.
102
Figure 5.4. Segregation distortion in the Orria × Plaisant RIL population. Percentage of alleles from Orria in 112 field tested genotypes or 217
Figure 6.1. Frequencies of Orria alleles using 936 SNP markers with a genotype-by-sequencing system (bars). The shaded area represents the 99% percentile of frequencies that can be expected after sampling 936 markers that had not undergone selection (i.e., with 50:50 frequencies), with a standard deviation equal to the one derived from the distribution of frequencies observed. The percentile was calculated after running 1000 simulations.
136
Figure 6.2. Segregation distortion in 31 F8 lines of the cross Orria × Plaisant using the genotype-by-sequencing system. Percentage of alleles from Orria vs cumulative centimorgan (cM) in the consensus map published by IBSC (2012). At the bottom of the graph, black triangles indicate the position of other known markers in the physical map, numbered according to Table 6.7. Shaded areas indicated the regions with selection QTL declared.
140
Figure 6.3. Segregation distortion in 31 F8 lines of the cross Orria × Plaisant using the genotype-by-sequencing system. Percentage of alleles from Orria vs cumulative base pair (bp) in the physical map published by IBSC (2012). At the bottom of the graph, black triangles indicate the position of other known markers in the physical map, numbered according to Table 6.7. Shaded areas indicated the regions with selection QTL declared.
141
Index of Annexes
Annex 4.1. Monthly average temperature for the testing locations during barley growing season in period 1 and period 2.
171
Annex 4.2. Monthly average rainfall for the testing locations during barley
growing season in period 1 and period 2. 173
Annex 4.3. Productivity average of grain yield of the winter and spring genotypes in different trials, in the last three generations of the
Spanish Barley Breeding Program in period 1 (2000-2004). 175
Annex 4.4. Productivity average of grain yield of the winter and spring genotypes in different trials, in the last three generations of the
Spanish Barley Breeding Program in period 2 (2005-2008). 176
Annex 4.5. Days to heading average of the winter and spring genotypes in different trials, in the last three generations of the Spanish
Barley Breeding Program in period 1. 178
Annex 4.6. Days to heading average of the winter and spring genotypes in different trials, in the last three generations of the Spanish
Barley Breeding Program in period 2. 179
Annex 6.1. BOPA1 SNP markers and flowering time genes targeting the QTL regions for yield, heading date or plant height identified in the Orria x Plaisant RIL population. Closest marker to the QTL peak, tested markers in the F8 lines, position in the OxP map and in the consensus map of Muñoz-Amatriaín et al. (2011) are shown.
180
Annex 6.2. Primers used to amplify new SNP-derived markers. 181
Annex 6.3. Segregation distortion in 31 F8 lines of the cross Orria × Plaisant using the genotype-by-sequencing system. Percentage of alleles from Orria vs cumulative centimorgan (cM) in the consensus map published by IBSC (2012). At the bottom of each graph, black triangles indicate the position of other known markers in the physical map, numbered according to Table 6.7. Shaded areas indicated the regions with selection QTL. Top graph, all markers; intermediate graph, markers with unique position; bottom graph, markers with multiple positions in the physical map.
182
Annex 6.4. Segregation distortion in 31 F8 lines of the cross Orria × Plaisant using the genotype-by-sequencing system. Percentage of alleles from Orria vs cumulative base pair (bp) in the physical map published by IBSC (2012). At the bottom of each graph, black triangles indicate the position of other known markers in the physical map, numbered according to Table 6.7.
Shaded areas indicated the regions with selection QTL. Top graph, all markers; intermediate graph, markers with unique position; bottom graph, markers with multiple positions in the physical map.
Annex 6.5. Gracia MP, E Mansour, AM Casas, JM Lasa, B Medina, JL Molina-Cano, MA Moralejo, A López, P López-Fuster, J Escribano, FJ Ciudad, P Codesal, JL Montoya, E Igartua. 2012. Progress in the Spanish National Barley Breeding Program. Spanish Journal of Agricultural Research 10:741-751
Summary / Resumen / Resum
3
Summary
The overall objectives of this thesis were to test the efficiency of selection in the Spanish Barley Breeding Program and to find the most important genetic factors responsible for the advantage of elite material, to facilitate future selection.
The progress in the breeding programwas estimated restrospectively, using data generated in trials of the advanced generations (F8, F9, F10) over a long series of years. Progress in the program was evident, with increasing yields in each generation, and with advanced lines surpassing the checks in the last two generations. Although the genotype by environment interaction (GEI) found for grain yield was quite large, it showed no apparent underlying geographic patterns. However, the results of some locations hinted that environmental causes might be causing GEI.
The relationship between GEI and climatic variables was investigated in more detail using again retrospective data of 11 years of advanced generations of the breeding program, across 12 locations. An in-depth analysis of the check cultivars revealed that one of the apparent causes of grain yield GEI was the occurrence of differential genotypic responses to winter temperatures. The analysis of the main lines tested in the program confirmed that genotypes having different vernalization requirements reacted differentially to winter temperatures, and that this had an impact on grain yield. These results highlight the importance of defining appropriate patterns of adaptation to the prevailing climate.
5
Resumen
Los objetivos generales de esta tesis fueron evaluar la eficiencia de la selección en el Programa Nacional Español de Mejora de Cebada y encontrar los factores genéticos responsables de la ventaja del material elite, para facilitar la selección en el futuro.El progreso en el programa se estimó retrospectivamente, usando datos generados en los ensayos de las generaciones avanzadas (F8, F9, F10) a lo largo de una serie de años representativa. El progreso obtenido fue evidente, con rendimientos crecientes en cada generación, sobrepasando a los testigos en las dos últimas generaciones. Aunque se detectó una importante interacción genotipo-por ambiente (GEI) para el rendimiento, ésta no mostró patrones geográficos aparentes. Sin embargo, los resultados de algunas localidades indicaron que podría haber causas ambientales en la base de la GEI.
La relación entre la GEI y variables climáticas se investigó con más detalle utilizando los datos retrospectivos de 11 años de generaciones avanzadas del programa de mejora, correspondientes a 12 localidades. Un análisis de las variedades empleadas como testigos indicó la relación de la GEI con las diferentes respuestas de los genotipos a la temperatura invernal. El análisis de las líneas avanzadas del programa confirmó que los genotipos reaccionaron diferencialmente a las temperaturas de invierno según su necesidad de vernalización, y que esto afectó al rendimiento. Estos resultados mostraron la importancia de definir patrones apropiados de adaptación al clima imperante.
7
Resum
Els objectius generals d'aquesta tesi foren avaluar l'eficiència de la selecció al Programa Nacional Espanyol de Millora d’Ordi i trobar els factors genètics responsables de l'avantatge del material elit, per facilitar la selecció al futur. El progrés en el programa es va estimar retrospectivament, utilitzant dades generades als assajos de les generacions avançades (F8, F9, F10) al llarg d'una sèrie d'anys representativa. El progrés obtingut va ser evident, amb rendiments creixents a cada generació, sobrepassant els testimonis en les dues últimes generacions. Tot i que es va detectar una important interacció genotip-per ambient (GEH) per al rendiment, aquesta no va mostrar patrons geogràfics aparents. No obstant, els resultats d'algunes localitats han indicat que podria haver causes ambientals a la base de la GEH.
La relació entre la GEH i variables climàtiques es va investigar amb més detall utilitzant les dades retrospectives de 11 anys de generacions avançades del programa de millora, corresponents a 12 localitats. Una anàlisi de les varietats emprades com a testimonis va indicar la relació de la GEH amb les diferents respostes dels genotips a la temperatura hivernal. L’anàlisi de les línies avançades del programa va confirmar que els genotips van reaccionar diferencialment a les temperatures d'hivern segons la seva necessitat de vernalització, i que això va afectar el rendiment. Aquests resultats van mostrar la importància de definir patrons apropiats d'adaptació al clima imperant.
9
Chapter 1
11
Chapter 1: General Introduction
1.1. Economic importance
Barley, Hordeum vulgare L., is an important cereal crop, ranking fourth in the world in terms of planted area after only wheat, rice and maize (Xue et al. 2010). It is one of the main cereals of Mediterranean agriculture, and a founder crop of Old World Neolithic food production. It was probably the first species cultivated as a food crop for human consumption (Baik and Ullrich 2008).
Barley is regarded as an inferior staple compared to wheat, and is considered as the poor people’s bread. It is commonly grown under conditions inducing low productivity, such as dry conditions, poor soils and soil or water salinity, where it has a productive advantage over wheat. Because of these characteristics, it has been the principal grain produced in numerous stress-prone areas.
Barley was presumably first used as human food but later on evolved primarily into a feed, malting and brewing grain due in part to the rise in prominence of wheat and rice (Baik and Ullrich 2008). Historically, barley has been an important food source in many parts of the world, including the Middle East, North Africa and northern and eastern Europe (Iran, Morocco, Ethiopia, Finland, England, Denmark, Russia and Poland), and Asia (Japan, India, Tibet and Korea) (OECD 2004; Newman and Newman 2006). Food barley is generally found in regions where other cereals do not grow well due to altitude, low rainfall, or soil salinity.
The major use of barley today is mainly for livestock feed. Globally, up to 85% of barley produced is used for feeding animals, including cattle (beef and dairy), and poultry (Pickering and Johnston 2005; Setotaw et al. 2010). The second most important use of barley is for malt, which is used mostly in the making of beer and liquors, but is also a component in a variety of foods, such as biscuits, bread, cakes and desserts (Baik and Ullrich 2008). Barley has also minor uses in the pharmaceutical industry.
12
Barley ranks as the fourth most important cereal in the world, after wheat, maize and rice (FAOSTAT 2010). The barley cultivation area and the production in Spain and Europe in the last 10 years are shown in Table 1 (FAOSTAT 2010).
Table 1.1. Barley cultivation area and production in Spain and Europe over the last 10 years. Year Spanish cultivation area (million ha) Spanish production (million tons) European cultivation area (million ha) European production (million tons)
2000 3.28 11.06 27.58 84.02
2001 2.99 6.24 29.24 92.39
2002 3.10 8.36 29.13 91.30
2003 3.17 8.70 28.93 83.20
2004 3.18 10.64 28.90 96.51
2005 3.16 4.62 27.99 83.09
2006 3.20 8.14 29.73 88.85
2007 3.23 11.94 27.32 82.84
2008 3.46 11.26 29.21 105.37
2009 3.05 7.35 27.73 95.59
2010 2.88 8.16 22.95 73.49
1.2. Taxonomy and diversity
Barley, Hordeum vulgare L., belongs to the grass family Poaceae. The Poaceae
is the largest family of monocotyledonous plants. The genus Hordeum L. comprises 32 species (Bothmer et al. 1991). The progenitor of barley, H. vulgare ssp. spontaneum (C. Koch) Tell, is considered to be a subspecies of cultivated barley, as both types cross readily. Its origin can be traced back to the Fertile Crescent region, though other origins have also been postulated (Molina-Cano et al. 2002). Cultivated barley is almost completely self-pollinated with predominantly cleistogamous flowering behaviour (Jain 1976).
13
Cultivated barleys are commonly classified according to different agronomic or quality traits, such as growth habit, spike morphology, grain morphology, etc. One of the main classifications attends to the seasonal growth habit of the cultivars, for which three main types have been described: winter, spring and facultative. Winter barley is sown in autumn. It is tolerant to low temperature, it requires vernalization to promote flowering, and commonly displays a strong promotion to flowering in response to long days. Spring barley is essentially the opposite of the winter barley. It usually has minimal low temperature tolerance, does not require vernalization, and is insensitive to long photoperiods. Facultative barley actually represents a subclass of the winter growth habit, typically utilized to refer to genotypes that are as low temperature tolerant as winter varieties, but lack a vernalization requirement (von Zitzewitz et al. 2005). Several genes, that will be introduced later, underlie a complex genetic control of this trait. Another essential classification of barley cultivars is made attending to spike morphology. According to this, barley can be divided into two-rowed and six-rowed types, though intermediate types also exist. In two-row barley, the lateral spikelets are sterile, whereas in six-row barley all spikelets are fertile. There are two main genes controlling spike type, Vrs1 (Komatsuda et al. 2007) and Int-c (Ramsay et al. 2011).
1. 3. Cytology and Genetics
Barley is a diploid species with a low number of chromosomes (2n = 2x = 14). Barley is predominantly a self-pollinated crop. The seven chromosomes, identified and labeled based on their size and characteristics, are denominated 1H through 7H (Linde-Laursen et al. 1997). Its genome presents high homeology to wheat genomes A, B and D, and to the genomes of other grasses, allowing localization of chromosomal segments through synteny across species (Mayer et al. 2011).
14
Bacterial artificial chromosome (BAC) libraries are large DNA insert libraries of choice and an indispensible tool for map based cloning, physical mapping, molecular cytogenetics, comparative genomics and genome sequencing. BAC libraries representing more than 20 haploid genomes as a new resource to the barley research community have been constructed (Schulte et al. 2011).
Genotyping-by-sequencing (GBS) has been developed as a tool for QTL for linkage and association studies and genomics-assisted breeding in a range of species including those with complex genomes. GBS uses restriction enzymes for targeted complexity reduction followed by multiplex sequencing to produce high-quality polymorphism data at a relatively low per sample cost (Poland and Rife 2012; Poland et al. 2012).
High-throughput genotyping platforms (Illumina SNP and DArT) have also been implemented in barley. This will increase the identification of marker trait associations, and the subsequent identification of potential candidate genes (Sreenivasulu et al. 2008; Comadran et al. 2012). Several technology developments during the last years have led to the development of a ‘‘Genomic toolbox’’ with new and more efficient resources that support the establishment of robust genomic programs in the Triticeae (Feuillet and Muehlbauer 2009).
Genomics can provide support for crop improvement by extending the amount or nature of variation available for selection, by allowing a precise transfer of traits reducing linkage drag, or by accelerating the selection process to produce varieties more rapidly. Essentially, the various -omics platforms improve the ability to discover genes and pathways that control specific traits and provide screening and analysis platforms to support selection strategies (Langridge and Fleury 2011).
Barley is highly autogamous, has a long history of recombination events and conserved linkage disequilibrium at the cM scale (Caldwell et al. 2006). This means that fewer markers are required to survey the whole genome compared to outbreeding species such as maize (Remington et al. 2001).
15
polymorphism (SNP) map with 2943 loci are available at HarvEST (www.harvest-web.org; Muñoz-Amatriaín et al. 2011).
Additionally, the integration of genomic data into genebank documentation
systems and its combination with taxonomic, phenotypic and ecological data will usher
in a new era for the valorization of plant genetic resources (PGR) (Kilian and Graner 2012).
The access to important genomic resources is facilitating greatly the search for candidate genes. The last and most important resource recently made available to the research community is the access to an almost complete barley genome sequence. Though it still has some gaps, it is a very complete tool with an integrated and ordered physical, genetic and functional sequence resource that describes the barley gene-space in a structured whole-genome context (IBSC 2012).
1.4. Quantitative trait loci (QTLs) analysis
Many agriculturally important traits such as yield are controlled by numerous genes and are commonly known as quantitative traits (also ‘polygenic’, ‘multifactorial’ or ‘complex’ traits). The regions within genomes that contain genes associated with a particular quantitative trait are known as quantitative trait loci (QTL, Paterson et al. 1991). Since the development of molecular markers, it has become feasible to identify and localize genetically the underlying polygenes as QTLs and to utilize these QTLs for crop improvement (Bernardo 2008; Xu and Crouch 2008).
The general goals of QTL mapping in plants are, on one hand, to increase the biological knowledge of the inheritance and genetic architecture of quantitative traits and, on the other hand, to identify markers that can be used as indirect selection tools in breeding (Bernardo 2008). In the last two decades, the ability to transfer target genomic regions using molecular markers resulted in extensive QTL mapping experiments in most crops economically important, aiming at the development of molecular markers for marker assisted selection (Xu 2010).
16
trials (Xing et al. 2002). Also, they have spurred a revival of backcross procedures in breeding, because the precision of the transfer of genomic regions reduces linkage drag, a huge problem when using exotic germplasm sources (Tanksley and Nelson 1996; Pillen et al. 2004; Bauer et al. 2009).
The identification of QTLs based only on conventional phenotypic evaluation is not possible. The major breakthrough that made possible the identification of QTLs was the development of DNA (or molecular) markers in the 1980s (Guo and Nelson 2008). QTL identification consists of four components: a segregating population, segregating markers, phenotypic values for the individuals from measurement of trait(s) of interest and association of the phenotypic data for the trait with genotypic data using an appropriate statistical approach. QTL analysis is based on the principle of detecting an association between phenotype and the genotype of markers.
QTL are identified using statistical procedures that integrate genotypic and phenotypic data and are attributed to regions of the genome at specified levels of statistical probability. Thus, mapping QTL is not as simple as mapping a gene that affects a qualitative trait (Semagn et al. 2010). The conventional methods for QTL mapping in plants include first generating a population [F2, backcross (BC), recombinant inbred lines (RIL) or doubled haploid (DH)] from a biparental cross, genotyping the individuals with genetic markers across the genome, phenotyping the individuals for the trait of interest, and then analyzing the results via linkage mapping (Flint-Garcia et al. 2005).
Progress in high throughput molecular marker platforms providing good genome coverage (from hundreds to thousands) together with decreasing genotyping costs have awakened the interests of plant geneticists in using naturally occurring variation for identifying genomic regions involved in complex traits (Close et al. 2009). The numbers of molecular markers for crop plants such as barley has increased and their cost has decreased therefore the number of QTL studies have increased exponentially (Rae et al. 2007).
1.4.1. Genetic mapping
17
basis of the frequency of recombination of the genes, estimated from scoring genotypes of progeny of a cross (Kearsey and Pooni 1996). The recombination is first estimated for all markers that are segregating as expected, and then any marker that is linked to any other marker is placed in the same linkage group (Young 1996; Yin et al. 2003). The linear arrangement of markers into linkage groups, or chromosomes, provides the genetic map for locating QTL that are relative to intervals of markers (or statistically related sets of markers) (Doerge 2002).
Genetic map indicates the position and relative genetic distances between markers along chromosomes, which is analogous to signs or landmarks along a highway where the genes are “houses” (Collard et al. 2005). It places molecular genetic markers in linkage groups based on their co-segregation in a population. And predicts the linear arrangement of markers on a chromosome and maps are prepared by analysing populations derived from crosses of genetically diverse parents, and estimating the recombination frequency between genetic loci (Duran et al. 2009a). A genetic map provides a genetic representation of the chromosome on which the markers and QTL reside.
The genetic map can be used to localize QTL for a quantitative trait, as first demonstrated by Paterson et al. (1988). The construction of detailed genetic maps with high levels of genome allow detailed genetic analysis of qualitative and quantitative traits that enable localization of genes or quantitative trait loci (QTL) and facilitate the introgression of desirable genes or QTLs through marker-assisted selection (Yim et al. 2002). And also allow comparative mapping between different species in order to evaluate similarity between gene orders and function in the expression of a phenotype (Paterson et al. 2000).
18
Interval mapping is another approach for QTL analysis made popular by Lander and Botstein (1989), which uses an estimated genetic map as the framework for the location of QTL. The principle behind interval mapping is to test a model for presence of a QTL at many positions between two mapped marker loci. This model uses method of maximum likelihood or regression.
The method of composite interval mapping (CIM) has become popular for mapping QTLs and it was proposed as solution to SIM drawbacks. This method combines interval mapping with linear regression and includes additional genetic markers in the statistical model in addition to an adjacent pair of linked markers for interval mapping. The main advantage of CIM is that it is more precise and effective at mapping QTLs compared to single-point analysis and interval mapping, especially when linked QTLs are involved (Zeng 1994).
1.4.2. Molecular markers
Molecular markers represent one of the most powerful tools for the analysis of genomes and enable the association of heritable traits with underlying genomic variation (Duran et al. 2009a). They arise from different classes of DNA mutations such as substitutions (point mutations), rearrangements (insertions or deletions) or errors in replication of tandemly repeated DNA (Paterson 1996).
The environments have no effect on DNA level or structure, therefore DNA based molecular markers are more widely used than other markers types. A wide variety of techniques can be used to detect DNA variations (Collard et al. 2005).
19
The development of high-throughput methods for the detection of single nucleotide polymorphisms (SNPs) and small indels (insertion/deletions) has led to a revolution in their use as molecular markers. SNPs are increasingly becoming the marker of choice in genetic analysis and are used routinely as markers in agricultural breeding programs (Gupta et al. 2001).
SNPs have many applications in plant genetic studies. These include high-resolution genetic map construction (Rafalski 2002), diversity studies (Kilian and Graner 2012) or even gene identification (Comadran et al. 2012). The use of SNPs is becoming widespread with the increasing availability of crop genome sequence, the reduction in cost, and the increased throughput of SNP assays (Batley et al. 2007).
1.4.3. Mapping populations
There are different kinds of populations can be used effectively for QTL mapping. F2 populations are developed by selfing F1 individuals, which are developed from crossing two (usually) homozygous parents. Crossing F1 individuals with one of the parents develops backcross populations (Paterson 1996). Recombinant inbred lines (RILs) are formed by crossing two genotypes followed by repeated selfing to create a new set of inbred lines whose genome is a mosaic of the parental genomes (Broman 2005). And doubled haploid (DH) populations are produced by generating plants by anther or microspore culture followed by chromosome doubling (Thompson et al. 1991).
Each RIL and DH is an inbred line, and so can be propagated eternally. A panel of lines of this kind has a number of advantages for genetic mapping: one needs to genotype each line only once; one can phenotype multiple individuals from each line to reduce individual, environmental, and measurement variability; multiple phenotypes can be obtained on the same set of genomes. An additional advantage of RILs over DH is that, recombination is richer because the breakpoints in RILs are denser due to the occurrence of a larger number of meiosis compared with populations in which only one meiosis takes place, as is the case for DH, and greater mapping resolution can be achieved (Broman 2005).
20
ij j i
ij G E GE
P
respectively, while the segregation of both marker types is 1:1 in BC, DH and RIL. Using F2 can maximize the information of co-dominant markers, using DH or RIL can maximize the information obtained by dominant markers. BC and F2 are not eternal; therefore the source of tissue for DNA or protein is limited. Both DH and RIL populations can produce hundreds of identical seeds so that unchanging genotypes can be evaluated repeatedly over years and locations in multiple traits (Burr et al. 1988).
1.5. Genotype × Environment interaction
The aim of plant breeding is to create new genotypes with higher yield, and stable under various conditions of cultivation, particularly under conditions which are less favourable for plant growth and development (Arshad et al. 2003). Genotype by environment interaction (GEI) is said to occur when cultivars or genotypes respond differently to diverse environments (Yan and Kang 2003).
High GEI mean that genotypes grown in multienvironmental trials tend to react substantially differently to varying environmental conditions (Comadran et al. 2011). Gauch and Zobel (1996) explained the importance of GEI as: “Were there no interaction, a single variety would yield the most the world over, and furthermore the variety trial need to be conducted at only one location to provide universal results. And were there no noise, experimental results would be exact, identifying the best variety without error, and there would be no need for replication. So, one replicate at one location would identify that one best variety that flourishes worldwide”.
Plant breeders and geneticists, as well as statisticians, have a long-standing interest in investigating and integrating the genotypic effect (G) and Genotype by environment interaction effect (GEI), as the latter seriously impairs efforts in selecting superior genotypes relative to new crop introductions and cultivar development programs (Yan et al. 2000). The decisions about the commercial value of new crop varieties are usually based on data from Multi Environment Trials (MET) series, done over several locations and years, across the target environment (Smith et al. 2001). MET series are designed to cover the range of agro-ecological conditions that may occur in the target environment (Romagosa et al. 2009), and thus provide an unbiased set of data to support the selection process.
21
Here, Pij is the measured yield of each cultivar at each testing environment, is
the result of adding μ, the overall mean, an environment main effect (Ej), a genotype
main effect (Gi), and the genotype by environment interaction(GEij) (Yan and Kang
2003).
Understanding of the causes of GEI is important at all stages of plant breeding. It affects ideotype design, parent selection, and selection based on yield or other traits. It can help to identify traits that contribute to better cultivar performance and environments that facilitate cultivar evaluation. And also could be used to establish breeding objectives, identify ideal test conditions, and formulate recommendations for areas of optimal cultivar adaptation (Yan et al. 2001).
In the last decade, efforts to elucidate the genetic factors causing GEI have veered towards the use of molecular markers. Quantitative trait loci responsible for adaptation have been reported in several populations (Romagosa et al. 1996; Bezant et al. 1997; Zhu et al. 1999; Lanceras et al. 2004; Maccaferri et al. 2008). Zheng et al. (2010) have illustrated the identification of QTL specific for certain environments by the combined use of a set of probe genotypes to characterize 12 environments (in terms of water deficit, radiation, temperature or nitrogen stress) and the analysis of a wheat mapping population. In that study, genotype and QTL by environment interactions were partitioned using environmental covariates for those environments where kernel number and thousand kernel weight QTL were identified.
Identification of QTL is useful to explain the genetic regulation of phenotypes and may provide markers that can assist in plant breeding. However, many QTL studies have produced inconsistent results regarding their detection in different environments (Leflon et al. 2005), as a result of the presence of GEI. Therefore, understanding the genetic basis of the GEI is a key objective to find the genetic factors underlying adaptation of genotypes to specific environments (Zheng et al. 2010). The study of GEI using conventional biometrical procedures has benefited greatly from the development of molecular markers to measure individual genetic effects and dissect GEI into QTL × environment interactions (Emebiri and Moody 2006).
22
co-localized with loci for the trait mean expression, whereas others appeared at positions where no QTLs for the mean expression were found.
1.6. Flowering date
The transition from vegetative to reproductive growth is a critical developmental switch and a key adaptive trait in both crop and wild cereal species, because it ensures that plants set their flowers at an optimum time for pollination, seed development, and dispersal (Cockram et al. 2007). This transition is often difficult to see unless the plants are dissected. Thus, surrogate traits easily recordable by naked eye are used to monitor the advancement of plant growth. One of these traits is the date of flowering, also regarded as one of the most important adaptive characteristics of plants (Laurie 2009). At flowering, most of the newly produced carbohydrates are transported to the developing seed and resources accumulated in storage tissues during the vegetative growth phase are reallocated to the production of seeds (Brachi et al. 2010).
In cereals, as in many other species, the timing of this transition, commonly known as transition to flowering, is determined by seasonal changes that are sensed by the plant (Sung and Amasino 2004). The successful sexual reproduction in plants and ensuing development of seeds depends on flowering at the right time, therefore the maximum yield attainable in a growing season is determined during the pre-flowering period (Slafer 2003). Mechanisms that control flowering in response to environmental stimuli such as day length (photoperiod) and periods of low temperature (vernalization) are important adaptive factors and have major impacts on agriculture (Dunford el al. 2005).
23
flowering date to increase yield and extend the agricultural flexibility and ecogeographical range of crops (Cockram et al. 2007).
Therefore flowering date has been an important trait for improving crop productivity and adaptation (Lawn et al. 1995), and is a primary objective of all breeding programs around the world. The genetics and physiology of heading date have been investigated by many researchers over many years. This is also true for barley and other temperate cereals, in which flowering date is a highly variable phenotypic trait which major implications for adaptation to geographic regions and crop management practices (Slafer 2003). In Mediterranean environments flowering date is considered a key trait for the adaptation of barley because barley is often grown under semi-arid conditions. Therefore, barley breeding programs must include the objective of achieving an appropriate flowering date among their targets (Cuesta-Marcos et al. 2009).
24
1.7. References
Arshad, M., A. Bakhsh, A. M. Haqqani, and M. Bashir. 2003. Genotype-environment interaction for grain yield in chickpea (Cicer arietinum). Pak. J. Bot. 35: 181-186.
Baik, B. K, and S. E. Ullrich. 2008. Barley for food: Characteristics, improvement, and renewed interest. J. Cereal Sci. 48: 233-242.
Batley, J., and D. Edwards. 2007. SNP applications in plants. In: Association Mapping in Plants (Eds. N.C. Oraguzie, E. H. A. Rikkerink, S. E. Gardiner and H. N. De Silva) Springer NY, pp 95-102.
Bauer, A. M., F. Hoti, M. von Korff, K. Pillen, J. Léon, and M. J. Sillanpää. 2009. Advanced backcross-QTL analysis in spring barley (H. vulgare ssp. spontaneum) comparing a REML versus a Bayesian model in multi-environmental field trials. Theor. Appl. Genet. 119: 105-123.
Bernardo, R. 2008. Molecular markers and selection for complex traits in plants: learning from the last 20 years. Crop Science 48: 1649-1664.
Bezant, J., D. Laurie, N. Pratchett, J. Chojecki, and M. Kearsey. 1997. Mapping QTL controlling yield and yield components in a spring barley (Hordeum vulgare L.) cross using marker regression. Mol. Breed. 3: 29-38.
Brachi, B., N. Faure, M. Horton, E. Flahauw, A. Vazquez, M. Nordborg, J. Bergelson, J. Cuguen, and F. Roux. 2010. Linkage and association mapping of Arabidopsis thaliana flowering time in nature. PLoS Genet. 6:e1000940.
Broman, K. W., 2005. The genomes of recombinant inbred lines. Genetics 169:1133-1146.
Bothmer, R. von, N. Jacobsen, C. Baden, R. Jørgensen, and I. Linde-Laursen. 1991. An ecogeographical study of the genus Hordeum. Systematic and Ecogeographic Studies on Crop Genepools (IPGRI), nº 7, Rome, 129.
Burr, B., F. A. Burr, K. H. Thompson, M. C. Albertson, and C. W. Stuber. 1988. Gene mapping with recombinant inbreds in maize. Genetics 118: 519-526.
Caldwell, K. S., J. Russell, P. Langridge, and W. Powell. 2006. Extreme population-dependent linkage disequilibrium detected in an inbreeding plant species,
Hordeum vulgare. Genetics 172: 557-567.
25
(Hordeum vulgare L.) indicates that VRNH2 is a repressor of PPDH2 (HvFT3) under long days. J. Exp. Bot. 6: 1939-1949.
Casao, M. C., I. Karsai, E. Igartua, M. P. Gracia, O. Veisz, and A. M. Casas. 2011b. Adaptation of barley to mild winters: A role for PPDH2. BMC Plant Biol. 11:164.
Close, T. J., P. R. Bhat, S. Lonardi, Y. Wu, N. Rostoks, L. Ramsay, A. Druka, N. Stein, J. T. Svensson, S. Wanamaker, S. Bozdag, M. L. Roose, M. J. Moscou, S. Chao, R. Varshney, P. Szűcs, K. Sato, P. M Hayes, D. E. Matthews, A. Kleinhofs, G. J. Muehlbauer, J. DeYoung, D. F. Marshall, K. Madishetty, R. D Fenton, P. Condamine, A. Graner, and R. Waugh. 2009. Development and implementation of high-throughput SNP genotyping in barley. BMC Genomics 10:582.
Cockram, J., H. Jones, F. J. Leigh, D. O’Sullivan, W. Powell, D. A. Laurie, and A. J. Greenland. 2007. Control of flowering time in temperate cereals: genes, domestication and sustainable productivity. J. Exp. Bot. 58: 1231-1244.
Collard, B. C. Y., M. Z. Z. Jahufer, J. B. Brouwer, and E. C. K. Pang. 2005. An introduction to markers, quantitative trait loci (QTL) mapping and marker-assisted selection for crop improvement: The basic concepts. Euphytica 142: 169-196. Comadran, J., J. R. Russell, A. Booth, A. Pswarayi, S. Ceccarelli, S. Grando, A. M.
Stanca, N. Pecchioni, T. Akar, A. Al-Yassin, A. Benbelkacem, H. Ouabbou, J. Bort, F. A. van Eeuwijk, W. T. B. Thomas, and I. Romagosa. 2011. Mixed model association scans of multi-environmental trial data reveal major loci controlling yield and yield related traits in Hordeum vulgare in Mediterranean environments. Theor. Appl. Genet. 122: 1363-1373.
Comadran, J., B. Kilian, J. Russell, L. Ramsay, N. Stein, M. Ganal, P. Shaw, M. Bayer, W. Thomas, D. Marshall, P. Hedley, A. Tondelli, N. Pecchioni, E. Francia, V. Korzun, A. Walther, and R. Waugh. 2012. Natural variation in a homolog of
Antirrhinum CENTRORADIALIS contributed to spring growth habit and environmental adaptation in cultivated barley. Nat. Genet. 44: 1388-1392.
Cuesta-Marcos, A., A. M. Casas, P. M. Hayes, M. P. Gracia, J. M. Lasa, F. Ciudad, P. Codesal, J. L. Molina-Cano, and E. Igartua. 2009. Yield QTL affected by heading date in Mediterranean grown barley. Plant Breeding 128: 46-53.
26
Dunford, R. P., S. Griffiths, V. Christodoulou, and D. A. Laurie. 2005. Characterisation of a barley (Hordeum vulgare L.) homologue of the Arabidopsis flowering time regulator GIGANTEA. Theor. Appl. Genet. 110: 925-931.
Duran, C., N. Appleby, D. Edwards, and J. Batley. 2009a. Molecular genetic markers: discovery, applications, data storage and visualisation. Current Bioinformatics 4: 16-27.
Duran, C., N. Appleby, M. Vardy, M. Imelfort, D. Edwards, and J. Batley. 2009b. Single nucleotide polymorphism discovery in barley using autoSNPdb. Plant Biotechnology Journal 7: 326-333.
Emebiri, L. C, and D. B. Moody. 2006. Heritable basis for some genotype-environment stability statistics: inferences from QTL analysis of heading date in two-rowed barley. Field Crops Res. 96: 243-251.
FAOSTAT. 2010. http://faostat.fao.org
Faure, S., J. Higgins, A. Turner, and D. A. Laurie. 2007. The FLOWERING LOCUS T -like gene family in barley (Hordeum vulgare). Genetics 176: 599-609.
Feuillet, C., and G. Muehlbauer (eds) Genetics and Genomics of the Triticeae. 2009. Plant Genetics and Genomics: Crops and Models 7, Springer, 700 p.
Flint-Garcia, S. A., A. C. Thuillet, J. M. Yu, G. Pressoir, S. M. Romero, S. E. Mitchell, J. Doebley, S. Kresovich, M. M. Goodman, and E. S. Buckler. 2005. Maize association population: a high-resolution platform for quantitative trait locus dissection. Plant J. 44: 1054-1064.
Gauch, G. H., and R. W. Zobel. 1996. AMMI analysis of yield trials. In: Genotype by environment interaction. (Ed.) Kang, M. S. and Gauch, H. G. CRC Press, Boca Raton, FL. pp 85-122.
Guo, Z., and J. C. Nelson. 2008. Multiple-trait quantitative trait locus mapping with incomplete phenotypic data. BMC Genetics 9:82.
Gupta, P. K., J. K. Roy, and M. Prasad. 2001. Single nucleotide polymorphisms: a new paradigm for molecular marker technology and DNA polymorphism detection with emphasis on their use in plants. Curr. Sci. 80: 524-535.
Hackett, C. A. 2002. Statistical methods for QTL mapping in cereals. Plant Mol. Biol. 48: 585-599.
27
Jain, S. K. 1976. The evolution of inbreeding in plants. Ann. Rev. Ecol. Syst. 7: 469-495.
Kearsey, M. J., and H. S. Pooni. 1996. The genetical analysis of quantitative traits. Chapman and Hall, London.
Kikuchi, R., H. Kawahigashi, T. Ando, T. Tonooka, and H. Handa. 2009. Molecular and functional characterization of PEBP genes in barley reveal the diversification of their roles in flowering. Plant Physiol. 149: 1341-1353.
Kilian, B., and A. Graner. 2012. NGS technologies for analyzing germplasm diversity in genebanks. Briefings in Functional Genomics. 11: 38-50.
Komatsuda, T., M. Pourkheirandish, C. He, P. Azhaguvel, H. Kanamori, D. Perovic, N. Stein, A. Graner, T. Wicker, A. Tagiri, U. Lundqvist, T. Fujimura, M. Matsuka, T. Matsumoto, and M. Yano. 2007. Six-rowed barley originated from mutation in a homeodomain-leucine zipper I-class homeobox gene. Proc. Natl. Acad. Sci. USA 104: 1424-1429.
Lanceras, J., G. Pantuwan, B. Jongdee, and T. Toojinda. 2004. Quantitative trait loci associated with drought tolerance at reproductive stage in rice. Plant Physiol. 135: 384-399.
Lander, E. S., and D. Botstein. 1989. Mapping Mendelian factors underlying quantitative traits using RFLP linkage maps. Genetics 121: 185-199.
Langridge, P., and D. Fleury. 2011. Making the most of ‘omics’ for crop breeding. Trends Biotechnol. 29: 33-40.
Laurie, D. A. 2009. Developmental and reproductive traits in the Triticeae. In: Feuillet C., G. Muehlbauer (eds), Genetics and Genomics of the Triticeae, Plant Genetics and Genomics: Crops and Models 7: 591-609.
Laurie, D. A., N. Pratchett, J. H. Bezant, and J. W. Snape. 1995. RFLP mapping of five major genes and eight quantitative trait loci controlling flowering time in a winter × spring barley (Hordeum vulgare L.) cross. Genome 38: 575-585.
Laurie, D. A., S. Griffiths, R. P. Dunford, V. Christodoulou, S. A. Taylor, J. Cockram, J. Beales, and A. Turner. 2004. Comparative genetic approaches to the identification of flowering time genes in temperate cereals. Field Crops Res. 90: 87-99.
28
time to flowering in six annual crops. VI. Applications in crop improvement. Exp. Agric. 31: 89-108.
Leflon, M., C. Lecomte, A. Barbottin, M.-H. Jeuffroy, N. Robert, and M. Brancourt-Hulmel 2005. Characterization of environments and genotypes for analyzing genotype × environment interaction. Some recent advances in winter wheat and prospects for QTL detection. J. Crop Improv. 14: 249-298.
Linde-Laursen, I., J. S. Heslop-Harrison, K. W. Shepherd, and S. Taketa. 1997. The barley genome and its relationship with the wheat genomes. A survey with an internationally agreed recommendation for barley chromosome nomenclature. Hereditas 126: 1-16.
Loomis, R. S., and D. J. Connor. 1992. Crop ecology: productivity and management in agricultural systems. Cambridge University Press 538 p.
Maccaferri, M., M. C. Sanguineti, S. Corneti, J. L. A. Ortega, M. B. Salem, J. Bort, E. DeAmbrogio, L. F. G. Moral, A. Demontis, A. Eh-Ahmed, F. Maalouf, H. Machlab, V. Martos, M. Moragues, J. Motawaj, M. Nachit, N. Nserallah, H. Ouabbou, C. Royo, A. Slama, and R. Tuberosa. 2008. Quantitative trait loci for grain yield and adaptation of durum wheat (Triticum durum Desf.) across a wide range of water availability. Genetics 178: 489-511.
Malosetti, M., J. Voltas, I. Romagosa, S. E. Ullrich, and F. A. van Eeuwijk. 2004. Mixed models including environmental covariables for studying QTL by environment interaction. Euphtyica 137: 139-145.
Mayer, K. F. X., M. Martis, P. E. Hedley, H. Śimková, H. Liu, J. A. Morris, B. Steuernagel, S. Taudien, S. Roessner, H. Gundlach, M. Kubaláková, P. Suchánková, F. Murat, M. Felder, T. Nussbaumer, A. Graner, J. Salse, T. Endo, H. Sakai, T. Tanaka, T. Itoh, K. Sato, M. Platzer, T. Matsumoto, U.Scholz, J. Doležel, R.Waugh, and N. Stein. 2011. Unlocking the barley genome by chromosomal and comparative genomics. The Plant Cell 23: 1249-1263.
Molina-Cano, J., E. Igartua, A. Casas, and M. Moraleja. 2002. New views on the origin of cultivated barley. 15-29 in: Barley Science. Recent Advances from Molecular Biology to Agronomy of Yield and Quality, G. A. Slafer, J. L. Molina-Cano, R. Savin, J. L. Araus, I. Romagosa, eds. Haworth Press, Binghamton, NY.
29
R. D. Horsley, K. Makoto, D. Moody, K. Sato, M. P. Vallés, B. B. H. Wulff, G. J. Muehlbauer, J. Doležel, and T. J. Close. 2011. An improved consensus linkage map of barley based on flow-sorted chromosomes and single nucleotide polymorphism markers. The Plant Genome 4: 238-249.
Newman, C. W., and R. K. Newman. 2006. A brief history of barley foods. Cereal Foods World 51: 4-7.
Nilan, R. A. 1964. The cytology and genetics of barley. Washington State University Press, Pullman, WA.
OECD, 2004. Consensus document on compositional considerations for new varieties of barley (Hordeum vulgare L.): Key food and feed nutrients and anti-nutrients. Report No. 12, Environment Directorate, OECD, Paris.
Paterson, A. H. 1996. Making genetic maps. In: Paterson A. H. (ed.) Genome mapping in plants, San Diego, California: Academic Press, Austin, Texas. 23-39.
Paterson, A. H., J. E. Bowers, M. D. Burow, X. Draye, C. G. Elsik, C. Jiang, C. S. Katsar, T. Lan, Y. R. Lin, R. Ming, and R. J. Wright. 2000. Comparative genomics of plant chromosomes. Plant Cell 12: 1523-1539.
Paterson, A. H., E. S. Lander, J. D. Hewitt, S. Peterson, S. E. Lincoln, and S. D. Tanksley. 1988. Resolution of quantitative factors by using a complete linkage map of restriction fragment length polymorphisms. Nature 335: 721-726.
Paterson, A. H,, S. Damon, J. D. Hewitt, D. Zamir, H. D. Rabinowitch, S. E. Lincoln, E. S. Lander, and S. D. Tanksley. 1991. Mendelian factors underlying quantitative traits in tomato: comparison across species, generations, and environments. Genetics 127: 181-197.
Peighambari, S. A., B. Y. Samadi, A. Nabipour, G. Charmet, and A. Sarrafi. 2005. QTL analysis for agronomic traits in a barley doubled haploids population grown in Iran. Plant Sci. 169: 1008-1013.
Pickering, R., and P. A. Johnston. 2005. Recent progress in barley improvement using wild species of Hordeum. Cytogenet. Genome Res. 109: 344-349.
Pillen, K., A. Zacharias, and J. Léon. 2004. Comparative AB-QTL analysis in barley using a single exotic donor of Hordeum vulgare ssp. spontaneum. Theor. Appl. Genet. 108: 1591-1601.
30
Poland, J. A., P. J. Brown, M. E. Sorrells, and J. L. Jannink. 2012. Development of high-density genetic maps for barley and wheat using a novel two-enzyme genotyping-by-sequencing approach. PLoS ONE. 7:e32253.
Rae, S. J., M. Macaulay, L. Ramsay, F. Leigh, D. Matthews, D. M. O’Sullivan, P. Donini, P. C. Morris, W. Powell, D. F. Marshall, R. Waugh, and W. T. B. Thomas. 2007. Molecular barley breeding. Euphytica.158: 295-303.
Rafalski, J. A. 2002. Novel genetic mapping tools in plants: SNPs and LD-based approaches. Plant Sci. 162: 329-333.
Ramsay, L. J. Comadran, A. Druka, D. F, Marshall, W. T. B. Thomas, M. Macaulay, K. MacKenzie, C. Simpson, J. Fuller, N. Bonar, P. M. Hayes, U. Lundqvist, J. D. Franckowiak, T. J. Close, G. J. Muehlbauer, and R. Waugh. 2011.
INTERMEDIUM-C, a modifier of lateral spikelet fertility in barley, is an ortholog of the maize domestication gene TEOSINTE BRANCHED 1. Nat. Genet. 43: 169-172.
Remington, D. L., J. M. Thornsberry, Y. Matsuoka, L. M. Wilson, S. R. Whit, J. Doebley, S. Kresovich, M. M. Goodman, and E. S. Buckler. 2001. Structure of linkage disequilibrium and phenotypic associations in the maize genome. Proc. Natl. Acad. Sci. USA. 98: 11479-11484.
Romagosa, I., F. A. van Eeuwijk, and W. T. B. Thomas. 2009. Statistical analyses of genotype by environment data. In: Cereals (Carena MJ, ed). Handbook of Plant Breeding, Vol. 3. Springer, New York, USA, pp 291-331.
Romagosa, I., S. Ullrich, F. Han, and P. M. Hayes. 1996. Use of the additive main effects and multiplicative interaction model in QTL mapping for adaptation in barley. Theor. Appl. Genet.93: 30-37.
Sax, K. 1923. The association of size differences with seed-coat pattern and pigmentation in Phaseolus vulgaris. Genetics 8: 552-560.
Schulte, D., R. Ariyadasa, B. Shi, D. Fleury, C. Saski, M. Atkins, P. deJong, C. C. Wu, A. Graner, P. Langridge, and N. Stein. 2011. BAC library resources for map-based cloning and physical map construction in barley (Hordeum vulgare L.). BMC Genomics 12:247.
Semagn, K., A. Bjørnstad, and Y. Xu. 2010. The genetic dissection of quantitative traits in crops. E. J. Biotech.13: 1-45.