Universitat Politécnica de Catalunya
Hierarchical information representation and ecient
classication of gene expression microarray data
PhD Thesis
Student:
Mattia Bosio
Thesis advisors:
Philippe Salembier
Albert Oliveras Vergés
Acta de calificación de tesis doctoral Curso académico: 2013/2014
Nombre y apellidos MATTIA BOSIO
Unidad estructural responsable del programa
Resolución del Tribunal
Reunido el Tribunal designado a tal efecto, el doctorando / la doctoranda expone el tema de la su tesis doctoral
titulada:____________________________________________________________________________________
Hierarchical information representation and efficient classification of gene expression microarray data
Acabada la lectura y después de dar respuesta a las cuestiones formuladas por los miembros titulares del
tribunal, éste otorga la calificación:
NO APTO APROBADO NOTABLE SOBRESALIENTE
(Nombre, apellidos y firma)
Presidente/a
(Nombre, apellidos y firma)
Secretario/a
(Nombre, apellidos y firma)
Vocal
(Nombre, apellidos y firma)
Vocal
(Nombre, apellidos y firma)
Vocal
/
______________________, _______ de __________________ de _______________
El resultado del escrutinio de los votos emitidos por los miembros titulares del tribunal, efectuado por la Escuela
de Doctorado, a instancia de la Comisión de Doctorado de la UPC, otorga la MENCIÓN CUM LAUDE:
SÍ NO
(Nombre, apellidos y firma)
Presidente de la Comisión Permanente de la Escuela de Doctorado
(Nombre, apellidos y firma)
Summary
In the eld of computational biology, microarryas are used to measure the activity of thousands of genes at once and create a global picture of cellular function. Microarrays allow scientists to analyze expression of many genes in a single experiment quickly and eciently. Even if microarrays are a consolidated research technology nowadays and the trends in high-throughput data analysis are shifting towards new technologies like Next Generation Sequencing (NGS), an optimum method for sample classication has not been found yet.
Microarray classication is a complicated task, not only due to the high dimensionality of the feature set, but also to an apparent lack of data structure. This characteristic limits the applicability of processing techniques, such as wavelet ltering or other ltering techniques that take advantage of known structural relation. On the other hand, it is well known that genes are not expressed independently from other each other: genes have a high interdependence related to the involved regulating biological process.
This thesis aims to improve the current state of the art in microarray classication and to contribute to understand how signal processing techniques can be developed and applied to analyze microarray data. The goal of building a classication framework needs an exploratory work in which algorithms are constantly tried and adapted to the analyzed data. The developed algorithms and classication frameworks in this thesis tackle the problem with two essential building blocks. The rst one deals with the lack of a priori structure by inferring a data-driven structure with unsupervised hierarchical clustering tools. The second key element is a proper feature selection tool to produce a precise classier as an output and to reduce the overtting risk.
introducing new elements to the selection process like a reliability measure and a scoring system to better select the best feature at each iteration. The second feature selection approach is based on Ensemble learning, taking advantage of the microarryas feature abundance to implement a dierent selection scheme. New algorithms have been studied in this eld, improving state of the art algorithms to the microarray data characteristic of small sample and high feature numbers.
In addition to the binary classication problem, the multiclass case has been addressed too. A new algorithm combining multiple binary classiers has been evaluated, exploiting the redundancy oered by multiple classiers to obtain better predictions.
Resumen
En el campo de la biología computacional, los microarrays son utilizados para medir la actividad de miles de genes a la vez y producir una representación global de la función celular. Los microarrays permiten analizar la expresión de muchos genes en un solo experimento, rápidamente y ecazmente. Aunque los microarrays sean una tecnología de investigación consolidada hoy en día y la tendencia es en utilizar nuevas tecnologías como Next Generation Sequencing (NGS), aun no se ha encontrado un método óptimo para la clasicación de muestras.
La clasicación de muestras de microarray es una tarea complicada, debido al alto número de variables y a la falta de estructura entre los datos. Esta característica impide la aplicación de técnicas de procesado que se basan en relaciones estructurales, como el ltrado con wavelet u otras técnicas de ltrado. Por otro lado, los genes no se expresen independientemente unos de otros: los genes están inter-relacionados según el proceso biológico que les regula.
El objetivo de esta tesis es mejorar el estado del arte en la clasicación de microarrays y contribuir a entender como se pueden diseñar y aplicar técnicas de procesado de señal para analizar microarrays. El objetivo de construir un algoritmo de clasicación, necesita un estudio de comprobaciones y adaptaciones de algoritmos existentes a los datos analizados. Los algoritmos desarrollados en esta tesis encaran el problema con dos bloques esenciales. El primero ataca la falta de estructura, derivando un árbol binario usando herramientas de clustering no supervisado. El segundo elemento fundamental para obtener clasicadores precisos reduciendo el riesgo de overtting es un elemento de selección de variables.
campo se han estudiado diferentes algoritmos, mejorando alternativas ya existentes al escaso número de muestras y al alto número de variables, típicos de los microarrays.
El problema de clasicación con más de dos clases ha sido también tratado al estudiar un nuevo algoritmo que combina múltiples clasicadores binarios. El algoritmo propuesto aprovecha la redundancia ofrecida por múltiples clasicadores para obtener predicciones más ables.
Acknowledgments
Contents
1 Introduction 1
1.1 Microarray Data . . . 3
1.2 Problem statement . . . 5
1.3 Contributions . . . 7
1.3.1 Feature set enhancement with metagenes . . . 8
1.3.2 Feature selection . . . 9
1.3.3 Binary classication . . . 10
1.3.4 Multiclass classication . . . 11
1.4 Thesis organization . . . 11
2 State of the art 13 2.1 Hierarchical data representation . . . 13
2.1.1 Unsupervised learning . . . 14
2.1.2 Knowledge integration for clustering . . . 15
2.2 Feature selection . . . 17
2.2.1 Ensemble learning for feature selection . . . 20
2.3 Classiers . . . 21
2.4 Multiclass classication . . . 23
2.5 Discussion . . . 25
3 Hierarchical data representation 27 3.1 Treelets clustering . . . 29
3.2 Euclidean clustering . . . 32
3.4 Discussion . . . 36
4 Feature selection for binary classication 37 4.1 Wrapper feature selection . . . 38
4.1.1 The IFFS algorithm . . . 38
4.1.2 Fitness measure denition and feature ranking criteria . . . 40
4.2 Experimental results for wrapper feature selection . . . 47
4.2.1 Dataset cohort . . . 47
4.2.2 Clustering distance & scoring measure comparison . . . 48
4.2.3 Metagene generation rule comparison . . . 60
4.2.4 Classier comparison: LDA and linear SVM . . . 61
4.3 Ensemble feature selection . . . 63
4.3.1 The reference ensemble algorithms . . . 64
4.3.2 Microarray adaptations for thinning . . . 66
4.3.3 Ensemble algorithms comparison . . . 68
4.3.4 Comparison with state of the art . . . 69
4.3.5 Tuning the ensemble . . . 70
4.4 Summary . . . 73
5 Knowledge integration for hierarchical clustering 75 5.1 The knowledge database . . . 76
5.1.1 The hierarchical clustering process . . . 77
5.2 Biological similarity measures . . . 78
5.3 Combination of numerical and biological similarities . . . 82
5.4 Knowledge integration evaluation for classication . . . 83
5.4.1 Predictive power evaluation . . . 83
5.4.2 Biological relevance evaluation . . . 84
5.4.3 Comparison with state of the art . . . 87
5.5 Experimental results . . . 88
5.5.1 Prediction results evaluation . . . 88
5.5.3 Comparison with state of the art algorithms . . . 92
5.6 Summary . . . 93
6 Multiclass classication 95 6.1 ECOC algorithms and the OAA + PAA algorithm . . . 96
6.2 Experimental Protocol . . . 100
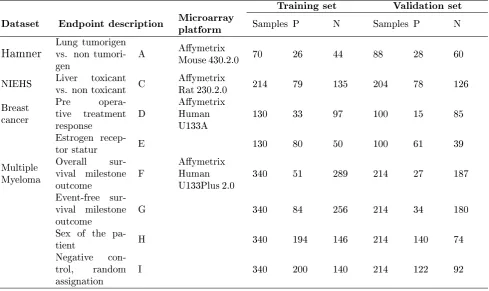
6.2.1 The analyzed microarray datasets . . . 101
6.3 Results . . . 101
6.4 Summary . . . 103
7 Conclusions 105 7.1 Microarray analysis: intersection between biology and signal processing . . 105
7.2 Contributions . . . 107
7.2.1 Hierarchical structure and metagenes . . . 107
7.2.2 Binary classication . . . 108
7.2.3 Knowledge integration model for metagene generation . . . 109
7.2.4 Multiclass classication . . . 110
List of Figures
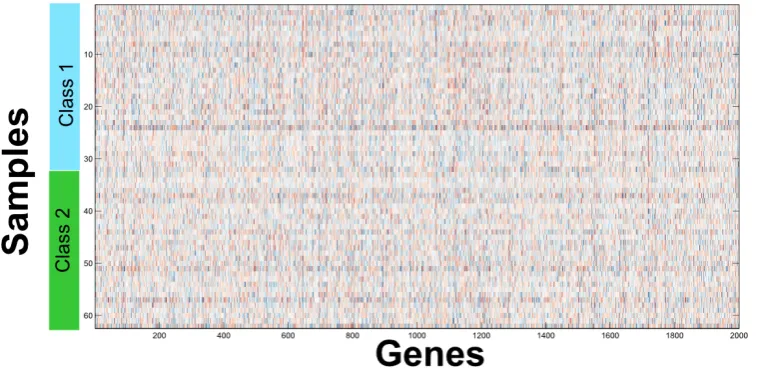
1-1 Microarray data visualization with heat map. Each columns represents a single gene, while each row represents a sample and it visualizes the lack of apparent regularity in a microarray dataset. . . 4 1-2 Current model framework for the binary classication case. The feature
set enhancement phase and the feature selection phase have been studied in multiple congurations. . . 7
3-1 Example of a dendrogram representing a hierarchical structure for microar-ray data. . . 28 3-2 General hierarchical clustering algorithm adopted in this thesis. . . 30 3-3 Example of how local PCA can be represented as a coordinate system
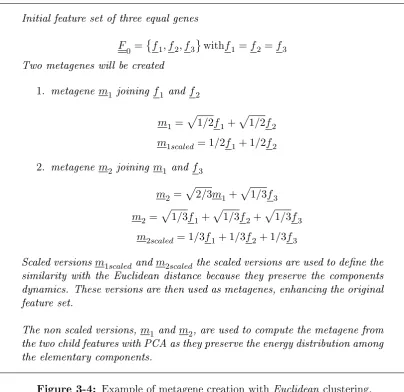
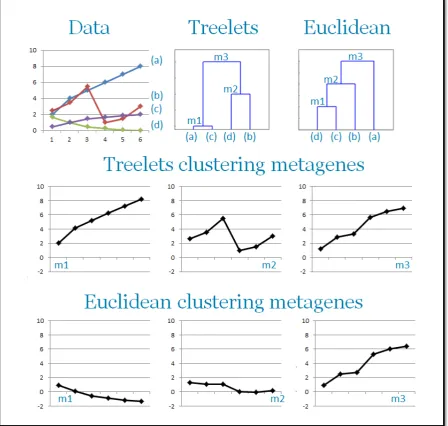
rotation and how the rst component well represents two similar features. . 32 3-4 Example of metagene creation with Euclidean clustering. . . 33 3-5 Example of metagene construction process dierences between Treelets and
Euclidean clustering. The vertical axis represent the gene expression value, while the bullets in the horizontal axis are the dierent samples. In the rst row the original data and the two obtained clustering trees are shown. In the second and third rows, the created metagenes with Treelets or Euclidean clustering are represented. . . 35
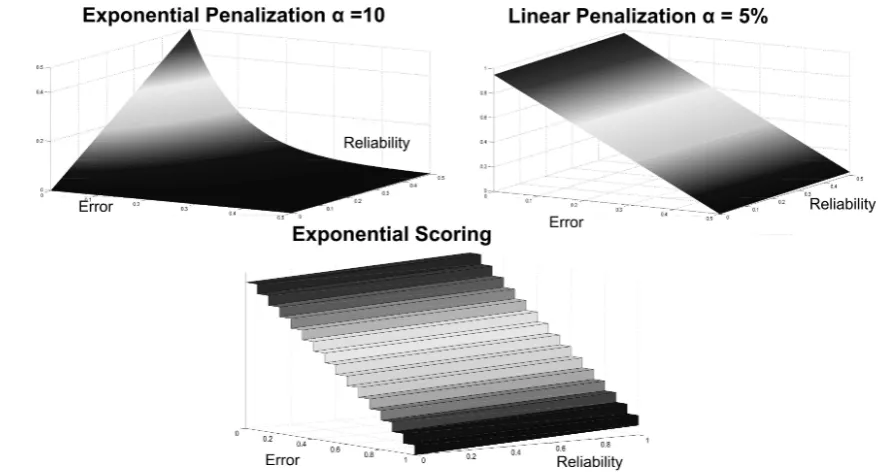
4-2 Example of how the reliability parameter can discriminate between two classiers with equal error rate. In both cases the error rate is 0 but, in the left part, classes are well separated, while in the right part, the classes are very close to each other. . . 43 4-3 Score surfaces in the error-reliability space depending on the three scoring
rules. . . 46 4-4 Mean MCC values comparison between MAQC results and the best
alter-natives for the dierent scoring techniques adopted. . . 53 4-5 Mean accuracy values comparison between MAQC results and the best
alternatives for the dierent scoring techniques adopted. . . 53 4-6 Boxplot of the obtained results along the 50 independent runs. Each
col-umn corresponds to a dierent endpoint. . . 55 4-7 Graphical illustration of the three synthetic models used to generate
fea-tures for feature pairs: Redundant, Synergetic and Marginal models are represented showing the densities for samples of two classes. . . 57 4-8 Hierarchical structure with the chosen metagene as root. In each node,
the obtained MCC value and error rate are showed when the node is used instead of the chosen metagene. The best values are obtained with the original feature, root node, but the substitution with one of its descendant does not severely degrade the performances. . . 59 4-9 Substitution results for the 205225_at probe set. In each node the obtained
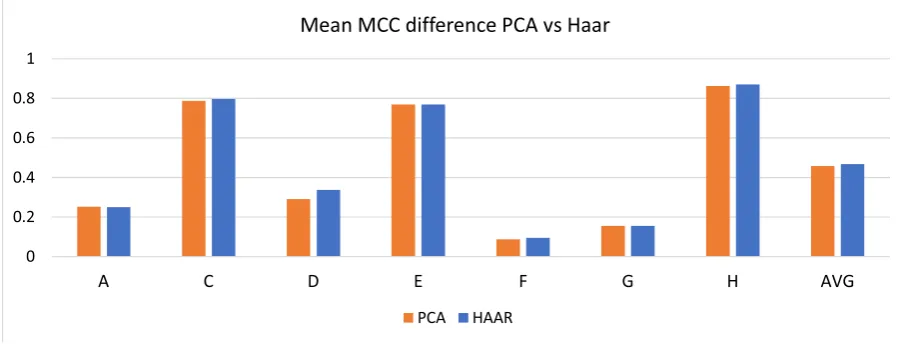
MCC value and error rate are showed when the node is used instead of the chosen probe set. The best values are obtained with the original feature, 205225_at and the best substitution is with the sibling node, Sibling Meta-gene. The root node has no available values because it cannot be chosen as a substitute for the 205225_at node. . . 60 4-10 Mean MCC results comparison between PCA and Haar metagene
genera-tion rules. . . 61 4-11 Mean MCC values on MAQC datasets comparing the LDA classier and
4-12 Pseudocode for the AID algorithm. . . 65 4-13 Mean MCC results comparison with state of the art results from [112] and
from Section 4.2.2. . . 69 4-14 Mean MCC results comparison among all the tested alternatives for
classi-er and nonexpclassi-ert condition. The values are the mean across the MAQC datasets. . . 72 5-1 Toy example of a small knowledge database matrix where each row is a
dierent gene while columns are attributes. Black dots represents that a gene has a specic attribute. . . 77 5-2 Toy example of the adopted ranking scheme using only two biological
rel-evance analysis tools combined with Borda count. . . 87 5-3 Score comparison with results from [84] on datasets D and E from MAQC
datasets. All the algorithms are sorted by increasing nal score, the black line. The best result is the one with the smallest overall score, which is G-pdf, consistently with the obtained results over a wider selection of datasets. 93 6-1 Example of OAO and OAA in a three classes problem with their associated
List of Tables
4.1 Microarray datasets used for classication. . . 49
4.2 MAQC mean MCC and mean Accuracy results . . . 51
4.3 Mean results adopting the lexicographic scoring scheme . . . 65
4.4 Mean results adopting the exponential penalization scoring scheme . . . 65
4.5 Mean results adopting the linear combination scoring scheme. . . 65
4.6 Statistical properties of the Monte Carlo simulation. . . 66
4.7 Results of the study based on synthetic data. The three subtables corre-spond to the three dierent data distributions. Each subtable is organized showing the values depending on the skewness value and the dierent size of the training set. The Train column contains the size of the training set, the MCC columns shows the mean MCC value across the dierent experi-mental conditions and Monte Carlo iterations while Std and #F columns contain the MCC standard deviation and the mean number of selected features respectively. . . 67
4.8 Mean MCC results from Monte Carlo simulation on MAQC datasets. The two algorithms dier from the metagene generation rule, PCA versus Haar basis decomposition. . . 67
4.9 MCC results comparing the studied AID and Kun algorithms. . . 68
4.10 Mean MCC results comparing the alternatives in terms of nonexpert nota-tion and adopted classier. . . 72
5.1 Biological similarity measures formulas. For each measure the original for-mula and its adapted version for continuous variables are presented. . . 81
5.3 Results from the biological evaluation of the gene signatures and the global ranking results. . . 91 6.1 Example of the ECOC representation of One Against All (OAA)
classica-tion in a 4 class case. Each bit is the output as a classier separating one class from the rest. . . 97 6.2 Code table for the OAA+PAA approach in a four classes scenario. There
Chapter 1
Introduction
The developed work in this thesis lies in the eld of automatic microarray data analysis-analysis and ts well the National Institute of Health, NIH, denition of bioinformatics
Bioinformatics: Research, development, or application of computational tools and approaches for expanding the use of biological, medical, behavioral or health data, including those to acquire, store, organize, archive, analyze, or visualize such data.
More in detail, this research work consists in developing a novel, global approach, with which high-throughput data like microarrays can be classied. To this end, signal pro-cessing techniques have been developed, applied and evaluated to improve the current results within the microarray analysis eld. In[110], the usefulness of signal processing techniques in the bioinformatics eld is well described:
to their important role in extracting, processing, and interpreting the infor-mation contained in genomic and proteomic data. It is our hope that signal processing methods will lead to new advances and insights in uncovering the structure, functioning and evolution of biological systems.
Signal processing techniques are key in the analysis process, since the problems to solve in the microarray data analysis are similar problems already faced in the telecommunication-related signal processing eld (e.g. analysis and compression of large data, noise cancel-lation, pattern detection, feature selection and classication). Moreover, a vast literature already exists, in which a whole plethora of algorithms from the signal processing world are taken, modied and adapted for the analysis of high-throughput data such as mi-croarrays. This thesis work aims to further improve the application of signal processing techniques to the analysis of a widely adopted tool like microarrays.
The main tasks treated in this thesis are the classication of incoming samples (e.g. to determine whether a microarray sample represents a person with a certain disease type or not), the relevant feature extraction of a microarray set (e.g. to identify the most discriminating genes between two classes) and the improvement of results interpretability from a biological point of view.
The developed techniques and tools focus on building a hierarchical data representa-tion for the gene expression data able to produce useful features for classicarepresenta-tion, either using only the numerical information from microarray, or by including previous biological knowledge to ease the results interpretation and to increase the biological coherence of the generated structure. Algorithms have been developed for the binary classication problem, which is by far the most studied task in classication. In this area, properly tuned feature selection algorithms have been developed and tested to take into account the microarray data characteristics. The multiclass classication has also been consid-ered by developing a novel ensemble classication technique combining multiple binary classier to obtain a more robust sample classication.
and inferences about phenomena inside the cell can be made [138]. In each microarray experiment, a large number of gene expressions are measured, typically tens of thousands, with a relatively small sample number. Microarrays are an extreme example of sample scarcity, or high-dimensionality of the feature set and this is a critical issue during the data analysis step.
The rst publication using microarrays for cancer classication is from Golub in 1999 [52], where a gene subset with large mean value dierence between classes and small vari-ance within each class has been selected from the initial dataset and used as a predictor classier. Since then, a wide variety of learning approaches have been proposed for mi-croarray data analysis, like for example data normalization and correction, classication or regulatory network identication.
1.1 Microarray Data
In the eld of computational biology, microarrays are used for gene expression proling, which is the measurement of the activity (the expression) of thousands of genes at once, to create a global picture of cellular function.
Microarrays allow scientists to analyze expression of many genes in a single experiment quickly and eciently. They represent a major methodological advance and are a powerful research tool, used by scientists to try to understand fundamental aspects of growth and development as well as to explore the underlying genetic causes of many human diseases. Microarrays data are usually visualized with the help of a heat map, like the example shown in Figure 1-1, in which genes are arranged as columns, while each row represents a sample. In gure 1-1, the samples are sorted by their classes: the rst 32 rows are from a class while the last 30 are from another. In the adopted color scheme, red values indicate high gene expression level, while blue values indicate low gene expression level. The heat map gives a visual summary of the collected genetic information and, at the same time, well visualizes the problem to be faced: there is too much information without an associated knowledge to easily discriminate between classes.
Figure 1-1: Microarray data visualization with heat map. Each columns represents a single gene, while each row represents a sample and it visualizes the lack of apparent regularity in a microarray dataset.
address the residual noise uctuation, benets would be obtained if the underlying data structure for the gene expression was found.
1.2 Problem statement
As anticipated in Section 1.1, microarray data characteristics can add complexity to the classication task:
• High feature set dimension with respect to the sample number also known as curse
of dimensionality [11];
• Lack of a priori known data structural relations;
• Residual measurement noise even after applying normalization techniques.
The main problem to be solved is how to develop an algorithm able to output a precise and reliable classier with repeatable result, considering the microarray data characteris-tics. Even if microarrays are a consolidated research technology nowadays and the trends in high-throughput data analysis are shifting towards new technologies like Next Gener-ation Sequencing (NGS) [102], an optimum method for sample classicGener-ation has not yet been found.
Omnibus, GEO, [41], thus it is possible to focus on the algorithmic aspect without being too conditioned by the data quality control like with the current state of NGS data analysis. In this way, algorithms can be developed for microarrays, compared with the best alternatives and later straightforwardly adapted to the next high-throughput sequencing technology with good chance of maintaining the performances.
In the literature a plethora of microarray classication methods have been developed and a review of the most popular alternatives is presented in Chapter 2. In almost every case, feature selection algorithms have been applied to reduce the impact of the feature number. The aim of the feature selection task is to choose a subset of relevant features for building robust learning models. By removing the most irrelevant and redundant features from the data, the feature selection helps to improve the predictive performance. In this way, the generalization capability and the model interpretability are enhanced.
The lack of structure aects the possibility to apply a whole set of learning techniques based on some proximity measure, being it spatial, spectral or functional. The lack of structure is also an issue for noise reduction techniques based on low-pass ltering: the lack of knowledge about features that are supposed to have a similar behavior limits the applicability of low pass operators. In order to extract a structure from the numerical data, unsupervised learning techniques have also been proposed in the literature, among which an important subset are the clustering techniques. The clustering operation denes sets of related genes by some similarity measure. A whole universe of alternatives exists, and a review of them is included in Chapter 2.
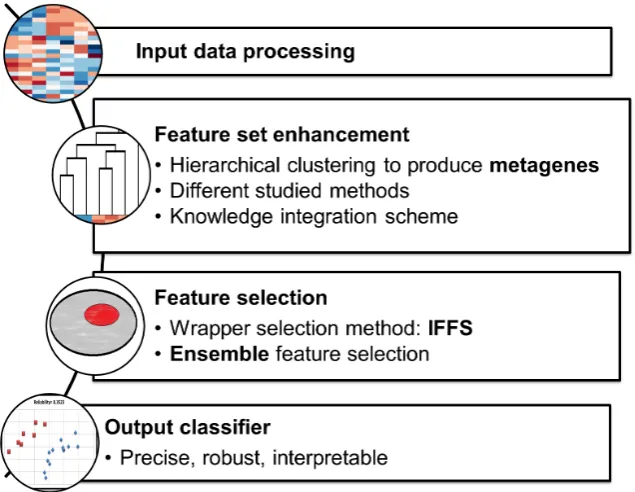
Figure 1-2: Current model framework for the binary classication case. The feature set en-hancement phase and the feature selection phase have been studied in multiple congurations.
Due to the large amount of data provided by Microarray technology, the data analysis and feature extraction steps need the application of automatic and ecient processing techniques. The framework proposed in this thesis for binary classication is visualized in Figure 1-2. The core of the algorithm is the two-step process following the data pre-processing. A rst phase infers a structure from the numerical data and produces new features called metagenes. Then, in a second step, dierent feature selection algorithms have been developed and compared. Finally, the algorithm output is the produced clas-sier. As far as the multiclass classication is concerned, the classication is obtained as a combination of multiple binary classiers and it is detailed in Chapter 6 .
1.3 Contributions
relevance. To achieve the proposed results, a variety of issues must be addressed to eectively extract information from the numerical data. The next sections describe the contributions from this thesis to each one of the faced microarray classication issues.
1.3.1 Feature set enhancement with metagenes
The rst step in the proposed framework is to process the original data and extract a new set of features called metagenes. The objective is to infer a structure and to create a set of metagenes to be added to the original gene expression values. The newly created metagenes can improve the classication ability by expanding the feature space and reducing the noise when summarizing local clusters of correlated genes. Furthermore, since a data structure is created, it can be used to interpret the obtained results or to look for alternatives in case of practical implementation problems.
Metagenes are built from hierarchical clustering and are obtained as linear combi-nation of the original features (i.e. gene expressions). This elaboration step aims at expanding the original feature set with useful alternatives. Algorithms like Tree Harvest-ing, [57], or Pelora, [35], highlight the usefulness of hierarchical clustering as a method to extract interesting new variables to expand the original feature set. The possibility to summarize groups of similar genes in a single feature as input for the classier has many advantages. First, the interpretability of the selected feature as a combination of corre-lated genes that may be involved in the same biological process. Second, the robustness to chance because a group of correlated genes useful for classication is less likely to be due to chance than an individual gene. Third and last, classifying with a cluster-representing feature can highlight linear relations among groups of correlated genes.
The unsupervised analysis algorithm applied in this work aims at extracting new features representative of the original set. A structure is assigned to the data based on a similarity metric (details are included in Chapter 3) and this has a double utility:
• It denes the neighbors1 of each gene, thus allowing a noise ltering eect when the
metagene is dened. The common behavior of a gene cluster is encoded into the representing metagene. The result is a new set of features which emphasizes the
common traits of gene groups, simultaneously reducing the residual noise on the measured values.
• It eases the results interpretation once the model is dened and also eases the
model redenition in case of practical inapplicability. Results can be more easily interpreted because, for each gene, groups of genes showing similar behavior are highlighted together with the extent of their similarity. The relations among genes are quantied by the similarity metric. About the practical issues once the model is dened, an example could be the high cost of a conrmation experiment for a specic gene. Thanks to the inferred structure by the clustering operation, alternatives to critical genes in the model can be found by looking at the produced tree.
The studied hierarchical clustering algorithm is one, but the actual inferred structure can change signicantly depending on how it is implemented. We have performed studies to compare dierent clustering implementations, changing the similarity metric or the metagene generation rule, switching from the local Principal Component Analysis, PCA, proposed in [78], to a Haar-base feature fusion. From this study it emerged how the metagene generation allows producing better classiers when compared to state of the art alternatives like those from [112].
Moreover, a knowledge integration scheme has been studied to include some specic prior knowledge in the clustering process. The objective is to produce a more interpretable and biologically meaningful clustering.
1.3.2 Feature selection
of which has benets and drawbacks, and a more detailed discussion is reported in Section 2.2. In this thesis, wrapper methods have been implemented. Innovation elements have been introduced inside the selection phase, considering the microarray data characteristics in order to improve the nal predictive ability. The main reason for modifying a feature selection algorithm is that, in microarray analysis, there is no fully reliable error estimator [19, 21, 20] due to the sample scarcity.
In addition to developing a novel wrapper algorithm, an indirect feature selection tech-nique has also been studied. More precisely, it is an ensemble techtech-nique for classication based on the accuracy in diversity algorithm from [8], which is detailed in Section 4.3. It iteratively classies samples with a majority voting scheme by selecting a subset of so called experts. Each expert has been chosen to be a classier trained on a single feature, gene expression or microarray, and this is why it is an indirect form of feature selection. By selecting a subset of experts, a subset of features is selected since they are used to train the ensemble experts. This form of feature selection results in a signicant improvement of the prediction properties of the classiers when compared to state of the art alternatives on publicly available data.
1.3.3 Binary classication
as linear combinations.
From the performed experiments, it has been observed, coherently with previously gath-ered results [19, 58, 112], how the adopted simple classication rules allow obtaining results comparable, or even better, than state of the art alternatives. This without needing any ne parameter tuning or complex training schemes. The LDA classier has been chosen as preferred method to compare all the dierent tested algorithm avors, in terms of hi-erarchical clustering algorithm, feature selection algorithm or the multiclass classication scheme. Even so, once one specic alternatives has been selected, implementations with SVM or KNN has also been considered to evaluate possible benets.
1.3.4 Multiclass classication
Multiclass cancer classication is still a challenging task in the eld of machine learning. A novel multiclass approach has been developed as a combination of multiple binary classiers. It is an example of Error Correcting Output Codes algorithms, applying data transmission coding techniques to improve the classication as a combination of binary classiers. ECOC codes showed interesting properties but suer of some issues which do not allow a remarkable prediction ability improvement. The proposed method combines the One Against All, OAA, approach with a set of classiers separating each class-pair from the rest, called Pair Against All, PAA. The OAA+PAA approach has been tested on seven publicly available datasets and compared with the common OAA approach and with state of the art alternatives. The obtained results showed how the OAA+PAA algorithm consistently improves the OAA results, unlike other ECOC algorithms presented in the literature which did not lead to better results than OAA.
1.4 Thesis organization
This thesis work is organized as follows:
• In Chapter 2, a review of the state of the art concerning the studied elements in
to oer a panorama of some of the most relevant developed algorithms.
• Chapter 3 presents the studied feature set enhancement algorithms to obtain a
hierarchical structure from the data and to generate new features called metagenes, from the base Treelets algorithm [78], to all the studied variants.
• Chapter 4, is the core of this thesis and it is dedicated to the binary classication
case. The studied feature selection algorithms are presented, as well as all the adaptations to the microarray scenario. In Chapter 4, the experiments to compare all the developed algorithms are presented, as well as the comparison with the state of the art.
• In Chapter 5, the knowledge integration scheme is introduced to explain how to
integrate the numerical data with a priori known biological information. The pro-posed integration framework has been compared among its alternatives, with the state of the art and with the original Treelets implementation from Chapter 3.
• In Chapter 6, the developed algorithm for the multiclass classication case is
pre-sented and compared with baseline algorithms and with state of the art alternatives.
Chapter 2
State of the art
Through the last years, many methods tackled the high-throughput biological data clas-sication problem with dierent angles, addressing the most relevant issues to produce an ecient classier which conjugates high prediction performance with robustness to over-tting and with an interpretable biological meaning. In this thesis, the classication task is addressed by implementing a system composed of three main parts: the hierarchical data representation, the feature selection and the classication rule. The state of the art about the three main parts of this thesis work is summarized here to oer a panoramic view of the available techniques, with their strengths and limitations.
2.1 Hierarchical data representation
2.1.1 Unsupervised learning
Unsupervised learning refers to the problem of trying to nd a hidden structure in unla-beled data. In the proposed framework, unsupervised learning techniques are implemented to nd a hierarchical structure for the gene expression data and to generate a new set of features called metagenes. Unsupervised learning encompasses many techniques that seek to summarize and to explain key features from the data. Approaches to unsupervised learning include clustering algorithms (e.g. k-means, mixture models, hierarchical clus-tering) or blind signal separation using feature extraction techniques for dimensionality reduction (e.g. Principal component analysis, Independent component analysis, Non-negative matrix factorization, Singular value decomposition), for a detailed survey about these and more techniques refer to [38, 58, 93].
metric). Taking advantage from the tree resulting from hierarchical clustering, Lee's work in [78] presents a multi-resolution representation and eigen-analysis of the original data through an iterative pairwise hierarchical clustering algorithm called Treelets. This method produces a tree in which, at each level, the two most similar features are chosen and replaced by a coarse-grained approximation feature and a residual detail feature. This characteristic from Treelets will be used in the metagene creation process because it allows a local representation of common behavior of a gene cluster and more details are provided in Section 3.1.
2.1.2 Knowledge integration for clustering
A relevant theme addressed in this thesis within the hierarchical data representation and metagene generation, is the opportunity to include prior biological knowledge to drive the hierarchical clustering process. A relevant issue with high-throughput biological data is how to extract reliable knowledge from the vast amount of available data [3]. A whole set of analysis tools have been developed to help the interpretation task and to infer relationships between the gene signatures and biological knowledge databases [115, 82, 27, 67, 30].
Including and integrating prior biological knowledge has gained importance in the omics data analysis eld throughout the years [3, 30]. Knowledge databases have been used in many directions, for example, to identify biologically relevant activated pathways by integrating Gene Ontology (GO) in the analysis process [105], or to integrate a gene ranking tool in the analysis [127]. Moreover, biological knowledge is also used in tools like Hanalyzer [77] to identify gene-to-gene relationships and facilitate the data interpretation. Knowledge integration for microarray classication has been recently applied in mod-ications of classication methods like Nearest shrunken centroids [122] and Penalized partial least squares (PPLS) [133] called mPAM and mPLS, respectively [117]. Both methods implicitly contain a mechanism for selecting genes based on a penalty applied according to the discriminatory power of the gene. In [134, 98, 49] too, the biological information has been used to improve the gene-ranking and the ltering feature selection, increasing the classication results interpretability and robustness.
information has been used to analyze the patient survival prediction rather than for clas-sication. The prior information in form of gene sets representing metabolic pathways has been used to summarize functionally related genes in a single variable called supergene by means of Supervised Principal Component Analysis (SPCA) [29]. In [25] the biological information is used to extract the common behavior of functionally related groups, gener-ating supergenes like in [28] to be used for feature selection as substitutes of the original gene expressions and applied to the microarray classication rather than regression.
A common trait of all these works is that including some prior biological knowledge led to more interpretable results from a biological viewpoint, easing the scientist's task to formulate new hypotheses.
In this thesis, the biological information integration has been studied in a more ex-tensive model than [25] or [77]. The information has been used to generate a whole hierarchical structure to generate a new set of features that do not substitute the original gene expressions. Moreover, in this work, the tested algorithms have been compared to a wide variety of state of the art classication algorithm on multiple publicly available datasets with a repeatable evaluation procedure recommended in [112].
Two key elements must be considered in including prior biological knowledge in a clustering process. The rst on is the knowledge database and the second is how to determine the concept of biological similarity, so to include it in the actual clustering algorithm.
Concerning the knowledge database, in the last years many online and publicly acces-sible repositories have been implemented and maintained. Some relevant examples are the Gene Ontology database, GO [6], which annotates genes by three categories: Biological Process, Cellular Component, and Molecular Function, the KEGG database [65] which is a database resource for understanding high-level functions and utilities of the biological system, the Molecular signature Database [115] or the DAVID knowledge base [60]. The last two datasets are collections of external knowledge databases, processed and ordered in a computer friendly form, easier to use for data mining application. For a more complete and thorough list of knowledge databases and analysis tools, refer to [3, 13].
to nding an appropriate similarity measure for the biological data, which usually are in a binary or categorical form. The fundamental issue is then to nd an appropriate cate-gorical data similarity measure that considers the characteristics of a knowledge database like sparsity and incompleteness of the available data. Examples of categorical measures used to evaluate the similarity in microarrays can be found in [14, 77].
2.2 Feature selection
Feature selection is the process of choosing relevant features from the data set with respect to the task to be performed. In addition to the main goal of obtaining predictive and generalizable classiers, two additional goals are pursued by feature selection: overcoming the curse of dimensionality and increasing the interpretability. The former is a concept introduced in [10] which is related to the relative amount of available training points and data dimensions. When there are too many dimensions compared to the available sample points, it is easy to nd data discriminative patterns which are accidental and not generalizable, falling into data overtting. The latter concept is related to making sense out of the data. A classication rule involving fewer features is easier to interpret and understand than a classier using thousands of genes.
The selection of the best feature subset could be a solved problem if the problem would not be unfeasible computationally. Optimum subset selection algorithms already exist [48, 95, 58], which consist in testing every possible feature subset and nally choosing the best one in terms of some cost function.
Being this unfeasible, less computationally expensive methods must be considered. Some of the existing methods are introduced in the following Section using a commonly adopted taxonomy from - [54, 108], which divides the algorithms in three classes: lters, wrappers and embedded. In Section 4.3, methods adopting a dierent feature selection strategy are described. They are called Ensemble methods and are introduced since some of them are used within this thesis.
each feature. Statistical tests like the Student t-test [38] or the Wilcoxon rank-sum test [131, 86] are commonly used as lters for feature selection. Filters methods typically have a short execution time because they are easy to calculate. The calculation speed is high because no classier needs to be trained in the ltering phase. The ltering operation usually follows a univariate paradigm: the feature score is determined by the feature values without analyzing possible multivariate interactions. This independent feature evaluation leads to a feature ranking list, from which the top scoring features are chosen to train the classier. Such univariate paradigm limits the interaction analysis in the classication phase, precluding a posterior interaction discovery by a multivariate classier. The feature preselection limits the classier to use features that usually are correlated, due to the univariate nature of the ltering phase selection. Numerous lter methods exist in the literature and for more details [75] can be referred as an exhaustive review.
popu-lation well tted for the classication task. This process, for its own nature, is random and strongly depends on the initial population, which can limit the solution space. That is why, usually, many parallel runs are needed to obtain a nal solution. Furthermore, as noticed in [104], the performance of evolutionary tends to degrade when the feature number increases.
The deterministic algorithms group includes many commonly used algorithms like the Sequential Forward Selection (SFS) [130] or Sequential Backward Selection (SBS) [87]. The SFS algorithm starts from an empty set of selected featuresY0 =∅, and sequentially
adds the featurefx that results in the highest objective functionJ(fx, Yk)when combined with the featuresYk ={fi|i selected before} that have already been selected. In this way Yk is a set composed of k sequentially selected features. The SBS algorithm is the opposite of SFS and starts by selecting all the p available features, Y0 ={f1. . . fp} and sequentially removing the worst feature from the subsetYk. The worst feature is the one whose removal fromYk allows to obtain the highest objective functionJ(Yk\fx).
Deterministic search strategies like SFS or SBS always choose the same feature set if the starting conditions do not change, thus ensuring the result replication in successive tests. Within this group, algorithms introducing exibility in the search have led to very competitive results [112, 39]. Common examples are the Sequential Floating Forward Selection algorithm (SFFS) [104], which is an evolution of SFS, allowing a backward cor-rection stage in the search process, or the Improved Sequential Floating Forward Selection [94] which additionally includes a replacing step. Details about SFFS and IFFS are in-cluded in Chapter 4, since they are the reference wrapper algorithms adopted for feature selection.
2.2.1 Ensemble learning for feature selection
In statistics and machine learning, ensemble methods use multiple experts to obtain bet-ter predictive performance than could be obtained from any of the constituent experts [103]. Ensemble techniques have been used in the literature to improve the stability and performance of feature selection and classication results [8, 136, 72]. In this thesis, a branch of ensemble techniques for classication has been studied to select a proper subset of classiers to merge and produce a global classication outcome for microarray samples. The idea is to use ensemble learning techniques by merging the prediction of a set of experts to produce a nal outcome with improved generalization and precision [72]. The idea behind ensemble learning techniques is that the ensemble prediction ability can improve the one of the single classiers. Many ensemble methods exist and they are applied in many research elds, for a review of ensemble methods and their applications in bioinformatic refer to [72, 97, 36]. To produce expert ensembles the adopted approaches in the literature can be categorized as follows, from [97]:
• Using dierent feature subsets for dierent experts • Using dierent sample subsets for the dierent experts
• Using dierent types of classiers to produce the dierent experts • Using dierent parameters for the same classier type
• Any combination of the above methods
Pareto-optimal search [72], the Convex-Hull search in a properly dened search space [72] or the accuracy in diversity algorithm (AID) [8]. Among these, the AID algorithm will be detailed in Section 4.3, because it is the base of all the developed ensemble selection algorithms in this thesis thanks to both its good results in [72], and to its computational cost which eases the implementation [8].
For a deeper discussion on the other ensemble generation categories, [72, 97] can be referred, as well as for the description of popular ensemble methods to improve feature selection stability like bootstrapping [58], boosting [58] and many other variants that have been developed in the literature.
2.3 Classiers
Sample classication assigns a class label to incoming samples following a precise rule. Such rule is obtained from a learning phase in which the classier is trained on known data with previously assigned labels. The high dimensionality of the feature set of microarrays is an issue since the vast majority of classiers are thought for cases in which the sample number is greater than the feature dimension. This problem is usually addressed through a feature selection operation and, sometimes, in developing new classiers as adapted versions for the new scenario. Some standard algorithms have been more commonly adopted among all the possible techniques [138] and for more detailed surveys refer to [38, 58, 74]. These techniques include from simpler classication rules like K nearest neighbor (KNN) or discriminant analysis, to more complex systems like support vector machines (SVM) or articial neural networks.
performances less stable [19, 112].
Another class of classiers are discriminant analysis methods, which assume that dif-ferent classes generate data based on dierent Gaussian distributions. The most popularly adopted algorithm among them is the Linear Discriminant Analysis (LDA). Linear dis-criminant analysis is also known as the Fisher disdis-criminant, named for its inventor, Sir R. A. Fisher [58]. It is a statistical learning method which nds the best linear combination of features to separate two or more classes, under the Gaussian distribution assumption of the sample classes, moreover it considers that all classes have the same covariance matrix. [58]. This classier usually obtains good predictive results with stable classi-cation boundary and reliable performance estimation [112, 19, 15] and for these reasons has been chosen as a reference classier throughout this thesis. Other relevant examples of discriminant analysis classiers are the Quadratic Discriminant Analysis [38], QDA, which removes the identical covariance matrix assumption and includes quadratic compo-nents to the classier training. It has also been used in microarray classication, [19]. It produces more exible classiers than LDA at a price of a higher computational cost. An important mention is also for a whole algorithm family born to overcome LDA limitation when the sample number is smaller than the classier dimension. To do so, regularization, shrinkage or diagonalization techniques have been applied to evolve the original LDA, and QDA. Some relevant examples are the regularized LDA introduced in Friedman's work in [96], or the diagonalized LDA, DLDA, [39, 137], or the Shrinkage-based DLDA [123], and some application of these methods in the microarray analysis [53, 111]. Further LDA evolutions are known as generalized discriminant analysis [9] and kernel discriminant anal-ysis,[81] is a kernelized version of linear discriminant analysis. Using the kernel trick, LDA is implicitly performed in a new feature space, which allows non-linear mappings to be learned to produce more complex classication boundaries. Such nonlinear classiers can be very powerful but there is an increased risk of overtting in a small sample scenario and it may be particularly tricky to obtain generalizable classiers.
separable, they might be transformed in a higher dimension space where data can be separable. SVM techniques encompass a universe of solution depending on the kernel function used for data transformation. Usually, the more complex the kernel, the more exible and sensible is the classier boundary. SVMs are commonly applied techniques and generally obtain good predictive results when linear, polynomial or Gaussian radial basis functions are used as kernels [58, 19, 112]. The SVM classiers are chosen as a very popular alternative in high-throughput data analysis due to their properties of robustness to overtting and good generalization properties [58]. Nevertheless, some of the best results are obtained when simple kernel are adopted [19], because the training of nonlinear SVM classiers is indeed very susceptible to model parameter choices, which are harder to setup properly when only few samples are available [125, 109].
Other relevant classiers are neural networks, which are a set of connected input/output units, like neurons in a biological neural network. There are many kinds of neural net-works and neural netnet-works algorithms, for a detailed introduction refer to [5]. Neural networks algorithms are usually tolerant to noisy data and obtain very good results on the training set when many samples are available. Drawbacks when using this kind of classiers are the high number of parameters that need to be determined (typically empir-ically) [138], the long learning time and the possible overtting due to the high complexity of the algorithm [19].
Conclusions from classier surveys in the context of microarray analysis agree that better classication accuracy can be obtained with simple and robust methods like LDA or SVM with simple kernels [138, 19, 58, 112] along with a proper feature selection method. Training error estimations done with simpler rules are more likely to be maintained in a validation scenario, with respect to very complex methods estimations [19, 112].
2.4 Multiclass classication
case, it is more complicated to obtain good prediction rates, especially when the class number is high and the class distribution is skewed [80, 114, 119, 128]. Many dierent approaches exist to tackle the problem and the majority proposes a combination of binary classiers. In [106] a review is presented and it is explained how, among the plethora of developed algorithms, the most commonly adopted approaches are two simple algorithms: the One Against All (OAA) and the One Against One (OAO).
The OAA algorithm is composed of N binary classiers, one for each sample class.
Each classier tries to separate one class from the rest and the nal classication is then performed by predicting using each binary classier, and choosing the prediction with the highest condence score. Supposing fi(x) is the condence for the ith classier in assigning the samples x to class i, the OAA decision is dened by Eq. 2.1
f(x) = arg max
i
(fi(x)) (2.1)
The OAO classiers builds N(N−1)classiers, one classier to distinguish each pair
of classes iandj. Letfij be the classier where classicorresponds to examples and class
j to negative so that fij =−fji. The nal classication can be dened from Eq.2.2.
f(x) = arg max
i
X
j
fij(x)
!
(2.2)
More recent works about multiclass classication like [119, 128] introduce more so-phisticated approaches applying data transmission algorithms for the sample classica-tion. These algorithms are named Error Correcting Output Codes (ECOC) algorithms, which adopt a global approach which compares the sample classication using N binary classiers as a transmission of N bit codeword over a noisy channel. Each binary classier is the receiver for one of the N bits of the codeword. The sample class is then assigned depending on the received bits. With this parallelism, data transmission ideas can be adopted to improve the "bit error rate". In detail, redundancy and error correcting codes have been applied for the multiclass scenario.
N-bits codewords. The application of LDPC codes for the multiclass classication is due to their outstanding performances in the data transmission eld [92], where they can approximate the Shannon limit. In [118], a recursive way to produce LDPC codes is studied to apply for the multiclass case. The LDPC codes are used as ECOC approach for the multiclass case in dierent scenarios, showing interesting prediction abilities and highlighting the possibility to improve the classication performances with the adoption of ECOC approaches.
The common ECOC approach consists in building a code table relating each of the M sample classes to a N bit codeword to produce a suitable binary matrix (i.e. Hamming code restrictions or LDPC restrictions). This focus works well for the bit transmission but it does not take into account the aim of the classication task, which is to distinguish among elements pertaining to dierent classes. In the code matrix generation, all the class partitions are equally suitable, so a binary classier separating one class from the rest can be chosen in the code table generation with the same probability of choosing a classier separating three classes, with scarce biological relation, from the rest. This feature can lead to very interesting numerical code tables which however does not translate into the expected error correcting improvements at the time to classify microarray samples [106].
2.5 Discussion
In this state of the art review, the most relevant methods for the key points of the proposed classication framework have been presented. Spanning from the unsupervised learning focused on inferring a hierarchical structure and on producing new features, to the most relevant feature selection techniques, to the applied classication rules and to the adaptation for the multiclass classication.
Many alternative solutions exist to tackle the classication problem in microarrays and it has been chosen to take top performing elements and to combine them. The aim is to develop an organic framework which combines several key elements, tailored on the microarray data characteristics to obtain good predictive classiers with generalization ability.
with a wrapper algorithm or with an ensemble selection technique. Both these alter-natives have greater potential than lter algorithms in nding multivariate interactions between features, and greater exibility than embedded methods in changing the adopted classication rule and they will both be detailed in Chapter 4.
Chapter 3
Hierarchical data representation
The hierarchical data structure inference is the rst step in the presented framework illustrated by Figure 1-2. The aim of this processing step is to obtain an ordered structure from the unordered microarray data and from the structure generation process, a new feature set is extracted and combined with the original gene expression data. As remarked in Section 1.1, the original data are gene expression measurements which suer from noise and are not endowed with a priori known structure. The noise eect can be minimized by inferring a structure from the numerical data. In such case, low-pass ltering techniques could be applied to correlated genes clusters.
The newly generated features are denominated metagenes, since they are aggregate patterns of gene expressions aiming at summarizing the common behavior of similar genes. The metagene notation has appeared with this denition in [61] in the context of the denition of breast cancer predictors. The metagene notion has since then been used to describe an aggregation of multiple gene expressions related by some closeness (numerical and/or biological), like for example in [31, 44].
To produce this new set of features, a hierarchical data representation is obtained through hierarchical clustering. Hierarchical clustering algorithms [93, 58] have been used for organizing and grouping the dataset variables because they oer an easily interpretable description of the data structure, clearly representable with a dendrogram as can be observed in Figure 3-1.
Figure 3-1: Example of a dendrogram representing a hierarchical structure for microarray data.
to form the clusters (i.e. the similarity metric) and to specify a generation rule for the metagene calculation as a combination of the individual genes. In this thesis, the chosen hierarchical clustering process is a bottom-up, pairwise approach based on Lee's work in [78], where an adaptive method for multi-scale representation and eigen-analysis of data called Treelets is presented. Treelets have been used as analysis tool to infer a hierarchical data structure both to analyze gene expression data [78, 17] and to create order to unstructured data in other research elds too [124]. Treelets has proven to be a powerful method to extract an underlying unknown structure from the data and this is why several variants of the original method from [78] have been tried in this thesis to analyze their potential in generating useful metagenes for classication.
The original implementation from [78] has been tested, as well as a set of alternatives to study possible improvements to the original algorithm. Among the innite number of possibilities, a set of focused modications have been chosen looking at previous results from [12, 71], and selecting those setups that may lead to better performances and that have a feasible computational implementation.
Component Analysis decomposition. Such a modication simplies the generation process by using constant combination weights to generate the metagene expression.
All the studied modications to the original Treelets algorithm have been tested and compared, to analyze possible benets for the predictive ability. The experiments setup and the results are included in Chapter 4.
3.1 Treelets clustering
The rst studied technique to infer a hierarchical structure from gene expression data is the original Treelets algorithm, thus it has been chosen to call it Treelets clustering.
The clustering tree is produced in a bottom-up pairwise approach. At each level: the two most similar features are chosen and replaced by two features, a coarse-grained approximation feature and a residual detail feature. Taking advantage of this multi-scale data representation, with Treelets clustering, at each iteration, the two features are replaced by one feature only, the approximation one, while the residual detail feature is discarded because it represents what is dierent between the two merged features. This new approximation feature is called metagene and it is obtained as a linear combination of the two joined features. Afterwards, the newly created metagene is used as a feature to be compared in the next iterations. If the initial condition is a feature set ofpindividual
genes, the nal outcome from the feature set enhancement process is a metagene set of
p−1 metagenes, one for each node in the hierarchical tree. This metagene set is then
added to the initial feature set.
In Figure 3-2, a pseudo code for the hierarchical clustering and the metagene generation process is detailed. It is a general algorithm, which can be used to describe any of the implemented algorithm variants. What dierentiates a clustering algorithm from another in this framework are either the similarity distance d(fa, fb) or the metagene generation
process g(fa, fb).
Original feature set G0={g1, . . . , gp}
Active feature set F =G
0
Metagene setM =∅
For i = 1 : p-1
1. Calculate pairwise similarity metricd(fa, fb) for all features in F
2. Find a,b : d(fa, fb) = max(d(·,·))
3. New metagenemi =g(fa, fb) generation:
mi=αafa+αbfb=
Pp
i=1βigi; α ∈ <2 β ∈ <p
Each metagene can be seen either as a combination of its two child features
{fa, fb} or as a linear combination of all the original featuresgi
4. Add the new metagene to the active feature set
F :=F ∪ {mi}
5. Remove the two featuresfa, fb from the active feature set
F :=F\{fa, fb}
6. Join the metagenemi to the metagene set
M :=M ∪ {mi}
end
Dene the new expanded feature set: F = G0 ∪M as the union of metagenes and
[image:49.595.68.511.90.576.2]original gene expression proles.
Figure 3-2: General hierarchical clustering algorithm adopted in this thesis.
metagene.
d(fa, fb) = < fa, fb >
kfakkfbk (3.1)
The Pearson correlation d(fa, fb) ∈ [−1, 1], measures the scalar product between two
features (i.e. numerator in Eq. 3.1), divided by the product ofl2norm of the two involved
invariant to a scaling factor: d(fa, fb) = d kfa, fb. The Pearson correlation assumes
value equal to 1 when two features have the exact same pattern, while a correlation value of −1 implies a perfect prole anticorrelation, dening the farthest possible point in the
similarity space spanned by the Pearson correlation.
About the metagene generation process with Treelets, the clustering process produces metagenes taking advantage of the multi-scale representation introduced in [78]. PCA can be described as a data representation and it is mathematically described as a change of basis in a vectorial space. It has been demonstrated that PCA can achieve a compact representation of the analyzed data. In its original formulation, PCA is a global feature transformation where the new representation is obtained as linear combination of its child features, but also as a linear combination of all the original components (in the microarray case it would be a combination of all the thousands of gene expressions). In Treelets clustering, PCA is instead used locally, inside each clustering step to produce a local data transformation, thus combining only two features at a time. In detail, for each node in the tree, a local Principal Component Analysis (PCA) [64] is applied on the child features. By this process, a hierarchical tree with multi-scale data representation is obtained. In each iteration, the local PCA calculates a Jacobi rotation on the two features
fa, fb [51] as in Eq. 3.2.
m=facosθL+fbsinθL (3.2)
d=facosθL−fbsinθL
In Eq. 3.2,θL is the rotation angle which decorrelates the two featuresfa and fb so that the two output features m and d will have 0 correlation. The m feature is the
coarse-grained approximation feature in [78] (i.e the rst principal component) and it is chosen as metagene in the Treelets clustering. On the other hand the d feature is the residual
detail feature, which is not taken into account for further processing. The fact that the local PCA can be seen as a Jacobi rotation is visualized in Figure 3-3 in a case of two very similar features. On the left, the initial two-dimensional space formed by the original features fa and fb is visualized. On the right hand side, instead, data are visualized in
Figure 3-3: Example of how local PCA can be represented as a coordinate system rotation and how the rst component well represents two similar features.
rst principal component (them feature chosen as metagene) represents well the common
behavior of the two analyzed features.
A note about the linear coecients calculated with PCA in the metagene creation algorithm in Figure 3-2: each metagene can be seen as a linear combination of all the individual genes, and PCA is an unitary transform so thatkβk2 = 1. This l2 norm equal
to 1 states that PCA is an energy conservative transformation and this eect translates
into producing metagenes of growing dynamic range as the number of represented genes grows.
The nal output of the Treelets clustering is a hierarchical tree with a metagene for each node. The original feature set is enhanced by the addition of new features able to summarize the common behavior of gene clusters. This characteristic can reduce the noise thanks to the low-pass ltering eect from the linear combination of similar features.
3.2 Euclidean clustering
The second metagene creation technique is called Euclidean clustering. It adopts an iterative process like the one explained in Figure 3-2, but it introduces changes in the similarity metric d(,) and in the metagene generation rule g(fa, fb) with respect to the
Treelets clustering technique.
Initial feature set of three equal genes
F0=f1, f2, f3 withf1=f2=f3
Two metagenes will be created
1. metagene m1 joining f1 and f2
m1 =p1/2f1+p1/2f2
m1scaled = 1/2f1+ 1/2f2
2. metagene m2 joining m1 andf3
m2=p2/3m1+p1/3f3
m2 =p1/3f1+p1/3f2+p1/3f3
m2scaled= 1/3f1+ 1/3f2+ 1/3f3
Scaled versionsm1scaled andm2scaled the scaled versions are used to dene the
similarity with the Euclidean distance because they preserve the components dynamics. These versions are then used as metagenes, enhancing the original feature set.
The non scaled versions, m1 andm2, are used to compute the metagene from
[image:52.595.107.512.90.482.2]the two child features with PCA as they preserve the energy distribution among the elementary components.
Figure 3-4: Example of metagene creation with Euclidean clustering.
Pearson correlation because the Euclidean distance can measure the point-wise closeness rather than the prole-shape similarity.
d fa, fb = −
fa − fb
2 (3.3)
The Euclidean distance has a dierent point of view with respect to the correlation mea-sure adopted in Treelets clustering and might be able to extract similarity related to the actual gene expressions rather than to their pattern.
The change in the similarity measure implies a modication in the metagene generation rule g(fa, fb). Due to the PCA transformation, which is energy conservative, a scaling
To properly compare genes expression values (and not their shape as with the Pearson correlation) with metagenes, the latter must be a pure weighted average of the genes. An illustrative example of how the metagene creation process is performed with Euclidean clustering is presented in Figure 3-4. In this gure, a toy example with an initial feature set of three equal genes is shown. It can be seen how the metagenes obtained with the sole PCA transformation are scaled weighted average of the genes, moreover with a scale factor proportional to the number of genes. This scaling factor is not an issue when the Pearson correlation is concerned, but it aects the Euclidean distance measurement.
To obtain a proper comparison between genes and metagenes, when a metagene mx
is created, two versions of it are used. The rst one is the same as in the Treelets case from the PCA transformation, while the second is a scaled version of the former
mxscaled =mx/kβk1 The scaled version mxscaled results to be a pure weighted average of
the genes and it is used in the pairwise similarity measurement as metagene. The non scaled version, instead, is maintained and it is used when a new metagene is built frommx
to preserve the energy distribution among the individual component, as can be observed in Figure 3-4.
The dierences in the similarity measure and in the generation rule lead to a dierent metagene set with respect to the Treelets clustering. To better visualize the dierences between the Treelets clustering and Euclidean clustering, Figure 3-5 is introduced. There, it can be observed how the dendrograms are quite dierent even if only 4 initial features are considered. As expected, in Treelets clustering, the prole-shape prevails in dening the merging features, while in Euclidean clustering, the point-wise distance rules the process. It can be observed how, out of the three metagenes m1 m2 and m3, only m3
has the same prole in both the clustering techniques. This is an expected result because the nal combination includes only three genes and the energy distribution among the individual components is determined in the same way by the two algorithms.
3.3 Haar wavelet for clustering
[55] to dene the metagene generation criterion g(·,·). In the Treelets original version,
each metagene is produced with a local PCA on the two merged features [78]. The stud-ied alternative proposes to substitute the PCA with a Haar transformation on the two merged features.
The main dierence between the two rules is in the linear combination weight assign-ment. Whether with PCA, the linear weights can be anything constrained to kαk2 = 1,
being αthe two dimensional coecient vector, with the Haar wavelet transformation, the
weights are xed and equal to √2/2. Such weighting dierence eases the structure
infor-mation storage and retrieval, because the only needed inforinfor-mation is the merging order, without caring about the coecient values. A side eect of the Haar basis transform is the generation of a completely dierent metagene set.
3.4 Discussion
In this Chapter, techniques to infer a hierarchical structure from microarray data have been described. The produced output are binary trees associating genes in dierent orders and producing dierent sets of metagenes.
This processing step is done to obtain new features more able to summarize the be-havior of related genes. To evaluate if this metagene generation process is useful and to decide which of the proposed alternative algorithms is the best, the inclusion of the metagenes in a classication framework must be done.