The Impact of the Mobile Phone on
Work/Life Balance
Preliminary Report
June 2007
RESEARCH TEAM
Professor Judy Wajcman, Australian National University Professor Michael Bittman, University of New England
Dr Paul Jones, University of New South Wales Dr Lynne Johnstone, Australian National University
Jude Brown, University of New England
TABLE OF CONTENTS
-1. EXECUTIVE SUMMARY ...1
2. RESEARCH AIMS AND BACKGROUND...3
3. RESEARCH METHODS...5
3.1 Survey design and sample...5
3.2 Profile of the internet-connected households ...6
4. MOBILE PHONES, OWNERSHIP, USE AND SERVICES ...8
4.1 Individual mobile phone ownership within households...8
4.2 Occupation and mobile phone ownership ...8
4.3 Personal income and mobile phone ownership ...9
4.4 Household mobile phone use by age...9
4.5 Who pays?...10
4.6 Purchasing decisions ...10
4.7 Choice of communication technology ...11
4.8 Awareness of mobile broadband...12
5. ACTUAL USE BASED ON PHONE LOG DATA ...12
5.1 Calls made - Who do they talk to? ...13
5.2 Text messages sent...14
5.3 Frequency of calls ...14
5.4 Patterns in time of calls...14
6. REPORTED REASONS FOR MOBILE PHONE USE...15
6.1 Perceived reasons for mobile phone use ...15
6.2 Reasons for making calls and sending SMS messages on the mobile phone...16
6.3 Reasons for ‘turning off’ your phone...16
6.4 Current and expected access to internet services using the mobile phone...17
7. MOBILE PHONE USE FOR WORK ...20
7.1 Perceived difficulty in doing job without a mobile phone ...20
7.2 ‘May be contacted’ during holiday ...21
7.3 Impact on workload and productivity ...22
8. WORK-FAMILY ISSUES ...22
8.1 Maintaining contact with extended family...22
8.2 Using the mobile phone to facilitate family/household coordination ...23
8.3 Balancing work and home/family/personal life ...23
8.4 Mobile phones, parents and the security of their children ...24
8.5 Importance of mobile phone in relationship of routinely separated couples ...24
9. PERCEIVED COSTS AND BENEFITS OF MOBILE PHONE OWNERSHIP ...24
9.1 Can I live without my mobile phone? ...24
9.2 Increased sense of personal security ...25
9.3 Effect on time pressure ...25
9.4 Effect on stress ...26
- LIST OF TABLES -
Table 1: Comparison of on-line survey sample with ABS population benchmarks...7
Table 2: Occupation and handset ownership ...9
Table 3: Income and handset ownership...9
Table 4: Reasons for choosing a communication modality ...12
- LIST OF FIGURES – Figure 1: Occupation by gender...8
Figure 2: Factors influencing choice of handset ...10
Figure 3: Factors influencing choice of network service provider ...11
Figure 4: Calls made by recipient ...13
Figure 5: Frequency of calls made...14
Figure 6: Frequency of calls by time of day ...14
Figure 7: Respondents’ use of phone functionality ...16
Figure 8: Proportion of people turning off their mobiles in each situation ...17
Figure 9: Currently accessed internet services...18
Figure 10: Perceived future use of mobile phone to access internet services...19
1. EXECUTIVE SUMMARY
Background
The AMTA/ARC study is an exciting collaboration to provide an evidence-based understanding of the social impact of the mobile phone on work/life balance. It is the first study that is specifically designed to provide nationally representative data on how mobile phones have become integrated into the everyday lives of Australians. This innovative project employs a purpose-designed questionnaire, a phone log and a time-diary. Together, this unique combination produces direct information about how people use their mobiles to manage and coordinate their lives.
This preliminary report presents data collected March to May 2007 from our sample of 1358 individuals from 845 on-line households. When the data from the off-line household sample are added in the coming months, the total sample will be more than 1,000 households.
Key Findings
• The lowest mobile phone use is found among those aged 60 years or more, but the mobile phone is so universally diffused that use is unaffected by income levels and occupation.
• The majority of users are subscribers and prepaid use is concentrated among those under 25 years. Around a quarter of managers and associate professionals have their bills paid by their employer, whereas in other occupations around 10% or less benefit from employer support.
• Cost is by far the major reason given for choice of handset, while there is no single factor which explains the choice of service provider.
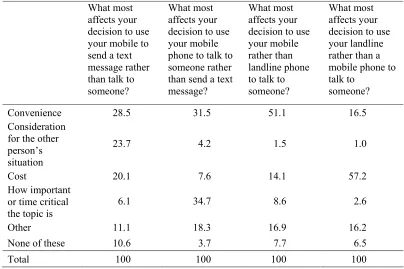
• ‘Convenience’ of the mobile phone is the reason most frequently given for choosing to talk on a mobile rather than a landline. ‘Cost’ is a major reason for preferring to talk using a landline rather than a mobile.
• There is a very high awareness of 3G (86% of males and 75% of females). But 61% of respondents indicate that they do not access internet services via their mobile phone. The lag in take-up is a topic for further research.
• Logs of actual calls made and SMS texts sent show that the predominant use of the mobile is for contacting family and friends, with work-related reasons far less important. Men make more calls for business purposes, while women use the mobile for social connectivity.
• Typically mobile phone users call relatively infrequently, with 28% making calls less than once a day.
• Perceived reasons for using a mobile are talk and messages. Other uses, including data transmission, are at this point minor.
• Asynchronous communication practices, such as turning off your mobile to avoid being disturbed, are common techniques. Ninety per cent of the
respondents ‘normally’ switch off their phone in the cinema, two- thirds switch off their phone at work meetings, and almost half turn off their phones in restaurants. Women are more reluctant than men to take their mobile phone on holiday ‘to talk to work colleagues’.
• A third of workers say that it would be difficult to do their job properly without their mobile. This is particularly the case for men.
• Half of employed respondents think that mobiles increase their workload, for 42% the effect is neutral, and a few (9%) think mobiles reduce their workload. This is offset by productivity gains. Over half (55%) of employed respondents indicate that job-related mobile calls increase their productivity.
• Over two-thirds of the respondents report that the mobile phone is an important medium for maintaining kinship ties, especially for women. The mobile is a device well suited to maintaining intimate relationships at a geographical distance.
• Conveying information about ‘timing of the arrival at home’ and ‘arranging to meet with other family members’ are the major uses of the mobile phone for micro-coordination. Among parents, ‘arranging to deliver goods or children’ and ‘finding out where children are’ is rated as important.
• More than half of the employed respondents believe that the mobile helps them to balance their family and working lives. Very few report that the mobile phone has a negative impact on their work-life balance.
• The mobile phone is an indispensable part of the everyday life of Australians. More than 90% report that their lives could not ‘proceed as normal’ if they were suddenly without their mobile phone.
• Carrying a mobile phone makes most people (75%) feel more secure.
• When asked about the impact of the mobile phone on their sense of time pressure, 39% report that the mobile reduces time pressure, while 33% report it increases pressure.
• Most people (59%) find that the mobile phone does not affect their level of stress. Of those who report that it has some impact, respondents are three times more likely to say that it reduces their stress level.
2. RESEARCH AIMS AND BACKGROUND
No other device has been diffused as rapidly as the mobile phone, but its social impact is unknown. This project aims to provide a sound empirical research base for
assessing the impact of the mobile phone on work/life balance. In particular, it examines the ways in which the mobile phone affords perpetual social contact. The project is based on collaboration between university-based researchers and the peak organization of mobile phone service providers, the Australian Mobile Telecommunication Association (AMTA), under the umbrella of the Australian Research Council Linkage grant scheme. AMTA’s mission is ‘to promote an environmentally, socially and economically responsible and successful mobile
telecommunications industry in Australia’. The collaboration follows a workshop held in May 2004, jointly sponsored by AMTA and the Academy of the Social Sciences in Australia.
The invention and diffusion of information and communication technologies are said to be revolutionising work and family life. Wireless mobile devices increase the scope for work and family flexibility by enabling the micro-coordination of time, tasks, and schedules. This is particularly significant as people are now working at times and places outside of the traditional workday and place. It is widely believed that technologies like the mobile phone and e-mail are blurring boundaries between personal life and the workplace. While for some commentators these developments represent a threat to the quality of modern life, for others they represent new opportunities for integrating the spheres of work and family.
To date, social research on the mobile phone has been limited and has yet to be consolidated into a body of evidence about its social impact. Worldwide there are now over 1.7 billion mobile phones, more even than fixed line phones. The overseas research focus up to now, however, has largely been on the internet and little research of any kind into digital technologies has been done in Australia. This project will, for the first time in Australia, empirically examine the social impact of mobile
industry depends upon high quality research on how Australians benefit from owning mobile technologies. The research findings have the potential to influence the type and range of wireless services that will best serve Australians in the future. The effects of technological innovation are often less than straightforward. If there was ever a clear illustration of the inherent unpredictability of technological change, it is the history of the fixed line telephone. The early phone, like the mobile, was
designed for business and professional purposes. The major use of the landline by women as a tool for maintaining social ties was unanticipated, as was the heavy use of mobiles by adolescents exchanging SMS text as well audio messages. In both cases, it was consumers rather than designers who discovered what was to become the typical pattern of use. Like other technologies, the mobile phone is flexible and contains contradictory possibilities. The future impact of the mobile phone on how Australians balance their work and home lives is thus unknown and ripe forempirical
investigation. The team of researchers brought together for this project combine leading-edge expertise in the social aspects of information and communication technologies, the study of time-use, and communications policy.
This report is based on a preliminary analysis of the first data to become available. The data are from the on-line component of the Phase 1 survey. It has been available to us for only a few weeks. The preliminary analysis undertaken here is to provide all the project partners with some indicative data at the earliest possible opportunity. In the coming month data from the off-line component of this survey will be integrated into a combined dataset representative of all Australian households. In the meantime, the results reported here should be treated as provisional, and may be subject to changes as more data come in. Planning for Phase 2 of the study has already begun, and as new data becomes available there will be further communications of relevant findings.
of communication, awareness of 3G capabilities, and take-up of 3G services. The report continues by presenting some preliminary analysis of the unique data on actual phone use, retrieved from respondents’ own handsets. In the next section, we present an analysis of respondents’ perceptions of their patterns of mobile phone use and preliminary data on the importance of mobile phones in the workplace and for managing their personal lives (including work/family balance). Finally, we explored how respondents feel about the relative balance of the social costs and benefits of mobile phone technology.
3. RESEARCH METHODS
The research project has two phases:
Phase 1 – A sample survey of all Australian adults living in private dwellings. Phase 2 – A study of the use of mobiles in work settings.
This report deals with the first round of analysis of Phase 1 data.
3.1 Survey design and sample
Seventy-five per cent of the Phase 1 sample was recruited from the ‘Your Voice’ on-line panel maintained by ACNielsen. This panel is recruited using off-on-line methods (gathering respondents from other face-to-face and telephone surveys conducted by the ACNielsen). The characteristics of the panel match those of the total population which is on-line. The latest ABS data indicates that in2005-06, 60% of Australian households had home internet access, but broadband is fast increasing and the current proportion of Australian households on-line is probably closer to75%.The remaining 25% of the sample were recruited by telephone.
The survey consists of three components - a questionnaire, a phone log and a light time diary. The questionnaire asked respondents about the following areas: ownership and use of mobile phones; the perceived impact of mobile phone use on work and life balance (including measures of the quality of life); perceived effects on work and work/family spillover; effects on social support networks; and the phone’s role in coordination and control.
The mobile phone log asked respondents to give details about their ten most recent phone calls and text messages, both those that they made and those they received. Information was collected on whom the call/text message was to or from (for example, spouse, work colleague, service provider), the gender of the caller, and the date and time of the call.
The third component of the survey was a 24 hour light time diary, consisting of a grid format with a list of 30 predetermined activities and a range of context indicators in the rows, and time, divided into 15 minute intervals, in the columns. Activities were grouped under the headings: personal care, eating, housework, work for paid job, education, voluntary work, care for others, leisure and travel. Context indicators were used to describe where the person was (home, main place of work, other indoors, outdoors), who they were with (alone, spouse, other adult, child) and whether they used a piece of technological equipment (landline, mobile phone, email, internet, Blackberry). For each 15 minute interval, respondents could choose up to three activities. The diary covered a 24 hour period beginning at 4am. Respondents chose the day that the diary was to be completed.
3.2 Profile of the internet-connected households
3.2.1 Representativeness of on-line sample
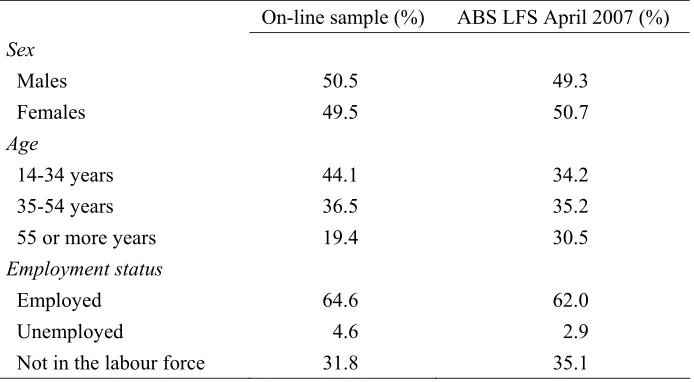
Table 1: Comparison of on-line survey sample with ABS population benchmarks
On-line sample (%) ABS LFS April 2007 (%)
Sex
Males 50.5 49.3
Females 49.5 50.7
Age
14-34 years 44.1 34.2
35-54 years 36.5 35.2
55 or more years 19.4 30.5
Employment status
Employed 64.6 62.0
Unemployed 4.6 2.9
Not in the labour force 31.8 35.1
Since April is the month in the middle of the data collection period and census data is currently only available for 2001, the Australian Bureau of Statistics (ABS) Labour Force Survey (LFS) of April 2007 was chosen as the appropriate benchmark against which to judge the representativeness of the sample. The on-line method of sampling reproduces the sex ratio of the Australian population in 2007 with a very slight bias (1%) towards male, as shown in Table 1.
When the Phase 1 data collection is complete (July/August 2007), that is, when both the on-line and off-line sample data are available, weights based on these ABS benchmarks will be calculated to further refine the accuracy of already relatively robust population estimates based on the AMTA/ARC Phase 1 sample.
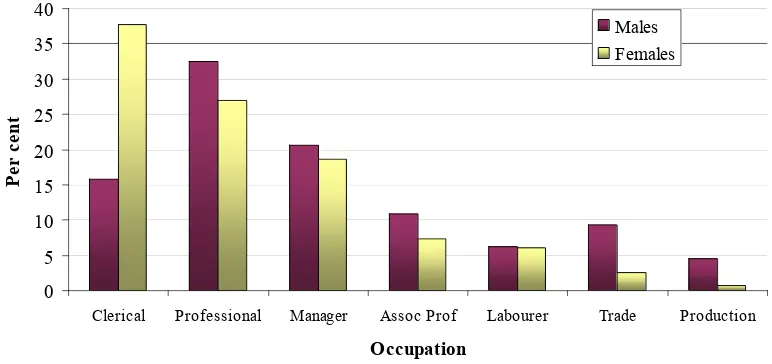
3.2.2 Number of workers and proportions by occupation
Figure 1: Occupation by gender
0 5 10 15 20 25 30 35 40
Clerical Professional Manager Assoc Prof Labourer Trade Production
Occupation
P
er ce
nt
Males Females
4. MOBILE PHONES, OWNERSHIP, USE AND SERVICES
4.1 Individual mobile phone ownership within households
More than 88% of individuals own at least one mobile phone, 10% have two phones, while few (1.4%) have more than two. Moreover, two-thirds have owned a mobile phone for more than 5 years.
Use of a mobile phone varies with age. Among 14 to 17 year olds, only 12% do not regularly use a mobile. Mobile phone use peaks in the age range 18 to 39 years, where 94% regularly use a phone, and falls to a lower level among mid-aged adults (85%). The lowest number of regular users (73%) of mobile phones is found among those aged 60 years or more.
4.2 Occupation and mobile phone ownership
Mobile phones were initially marketed as business tools for managers whose time is very costly. When mobile phone ownership is analysed by occupation (See Table 2), the highest level of ownership is found not among managers but among tradespeople. Presumably, having a single contact number, independent of the site they are currently working on, has proved a boon to tradespeople. Apart from labourers, phone use is widely diffused among all population groups, providing a first clue that the
Table 2: Occupation and handset ownership
None One Two Three Four + Total
Occupation
Manager 7.5 75.1 14.5 1.2 1.7 100
Professional 6.1 78.0 14.5 0.8 0.8 100
Assoc Prof 6.2 74.1 19.8 0.0 0.0 100
Trade 3.6 78.2 16.4 1.8 0.0 100
Clerical 7.1 84.1 8.4 0.4 0.0 100
Production 8.0 80.0 4.0 8.0 0.0 100
Labourer 20.4 72.2 7.4 0.0 0.0 100
4.3 Personal income and mobile phone ownership
[image:12.612.106.470.408.532.2]Table 3 shows the association between income and handset ownership. Regardless of position in the income distribution, most Australians own at least one mobile phone. Being in the highest income bracket is associated with a higher likelihood of owning many handsets.
Table 3: Income and handset ownership
None One Two Three Four + Total
Income quintiles
1st 16.7 78.1 4.7 0.0 0.5 100
2nd 16.2 74.4 8.2 0.9 0.3 100
3rd 13.8 77.8 7.1 0.9 0.4 100
4th 8.8 77.0 13.2 0.7 0.3 100
5th 6.8 75.3 15.3 1.4 1.4 100
4.4 Household mobile phone use by age
4.5 Who pays?
The majority of respondents under the age of 25 use ‘a pre-paid plan paid by me or my parents’ while the majority above that age meet the cost of using their phone through ‘regular billing by my network paid by me or my parents’. Around a quarter of managers and associate professionals claim that the ‘my employer pays my mobile phone bills’, whereas for other occupations around 10% or less benefit from employer support.
4.6 Purchasing decisions
4.6.1 Choice of mobile phone
[image:13.612.124.505.459.668.2]Respondents were asked to rate the importance of five factors as influences on their choice of mobile phone handset. As shown in Figure 2, the cost of the handset was by far the most important factor influencing choice (85%), while the image of the phone (21%), for example, as portrayed in media advertising, was the least important. Importantly, more than 40% of individuals regard all factors other than cost as neither important nor unimportant in their choice of handset.
Figure 2: Factors influencing choice of handset
0 20 40 60 80 100
Cost Style Upgrading Other Image
Reason
P
er c
en
t
4.6.2 Choice of network service provider
[image:14.612.120.496.273.464.2]Respondents were asked to rate the importance of five factors on their choice of network service provider. By comparison with factors influencing their choice of handset, there is no single dominant factor influencing their choice of service provider (See Figure 3). The cost of the package and the network coverage and to a lesser extent the reputation of the service provider influence the choice of service provider. On the other hand, perhaps surprisingly, download speed was unimportant for a high proportion of people (36%), more than all other unimportant factors combined.
Figure 3: Factors influencing choice of network service provider
0 20 40 60 80 100
Cost of package
Network coverage
Reputation Same as family use
Download speed Reason
P
er ce
nt
Important Neither Unimportant
4.7 Choice of communication technology
Table 4: Reasons for choosing a communication modality
What most
affects your decision to use your mobile to send a text message rather than talk to someone?
What most affects your decision to use your mobile phone to talk to someone rather than send a text message?
What most affects your decision to use your mobile rather than landline phone to talk to someone?
What most affects your decision to use your landline rather than a mobile phone to talk to
someone?
Convenience 28.5 31.5 51.1 16.5 Consideration
for the other person’s situation
23.7 4.2 1.5 1.0
Cost 20.1 7.6 14.1 57.2
How important or time critical the topic is
6.1 34.7 8.6 2.6
Other 11.1 18.3 16.9 16.2
None of these 10.6 3.7 7.7 6.5
Total 100 100 100 100
4.8 Awareness of mobile broadband
There is a very high awareness of mobile broadband (3G), with 86% of males and 73% of females saying that they are aware of the technology. A topic for further investigation is why the take-up of the new functionalities of the mobile phone has lagged so far behind the availability of the technology. Obvious candidate factors for exploration are consumer tastes, the age of handsets in use and pricing regimes, relative to other modes of accessing similar services.
5. ACTUAL USE BASED ON MOBILE PHONE LOG DATA
Respondents produced an accurate log of their incoming and outgoing
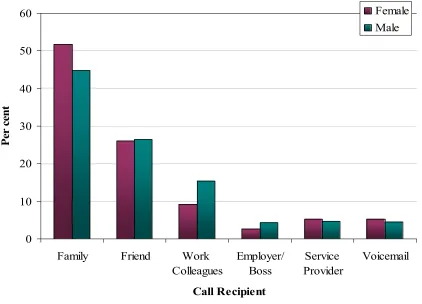
5.1 Calls made - Who do they talk to?
An analysis of calls made is shown in Figure 4. This analysis reveals that only a small proportion (16%) of the 9,714 calls made were work-related. Conversely, the mobile phone is used overwhelming for contacting family (48%) and friends (26%). The remainder of calls are to service providers or to pick up messages from voicemail (less than 10%).
[image:16.612.121.543.363.667.2]Among calls to family members, for both men and women, the highest proportion is calls to one’s spouse (18%). Women are disproportionately likely to phone their children (11%), parents (12%) and extended family (11%). On the other hand, in general, men are more likely to use the mobile for work-related calls, and this holds true even when employment is taken into account. Employed men devote 23% of their calls to work-related purposes, while for employed women the percentage is 15%.
Figure 4: Calls made by recipient
0 10 20 30 40 50 60
Family Friend Work
Colleagues
Employer/ Boss
Service Provider
Voicemail
Call Recipient
P
er cen
t
5.2 Text messages sent
Drawing again on the phone log data, family (45%) and friends (43%) are by far the most common recipients of text messages. This finding is overwhelmingly true for both males and females. Within families, texting between spouses constitutes the highest volume of text messages.
5.3 Frequency of calls
[image:17.612.124.512.324.575.2]Somewhat unexpectedly, the typical user of the mobile phone makes relatively few calls (see Figure 5). The highest proportion of respondents makes less than 1 call per day.
Figure 5: Frequency of calls made
0 5 10 15 20 25 30 35 40 45
< 1 1 to 2 3 to 4 5 to 6 7 to 8 9+
Number of calls per day
Pe
r c
en
t
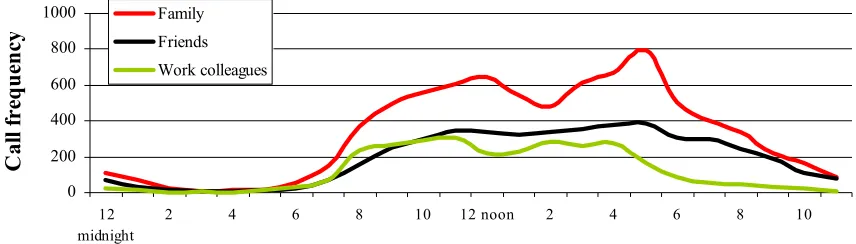
5.4 Patterns in time of calls
are less frequent in the morning than in the afternoon, rising at the time school ends, and having a pronounced peak before the evening meal. Throughout the evening, family calls are at a much higher level than work-related calls. This pattern is consistent with the use of the mobile phone for microcoordination of family affairs. Contacting friends reaches a peak at mid-morning and remains sustained throughout the afternoon and early evening. During the entire evening, communications with friends are at a higher rate than work-related calls. The heavy use of the mobile in the evening for contacting family and friends (and not job-related tasks) is consistent with our view that the main purpose of the mobile phone is for social contact.
Figure 6: Frequency of calls by time of day
0 200 400 600 800 1000
12 midnight
2 4 6 8 10 12 noon 2 4 6 8 10
Time of day
C
al
l f
re
que
nc
y FamilyFriends Work colleagues
6. REPORTED REASONS FOR MOBILE PHONE USE
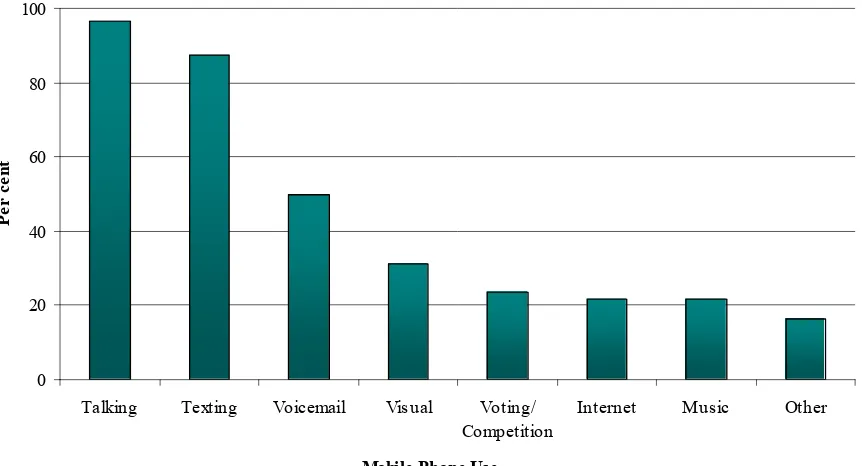
6.1 Perceivedreasons for mobile phone use
Figure 7: Respondents’ use of phone functionality
0 20 40 60 80 100
Talking Texting Voicemail Visual Voting/ Competition
Internet Music Other
Mobile Phone Use
P
er
cen
t
6.2 Reasons for making calls and sending SMS messages on the mobile phone
Calls on the mobile phone are predominantly for social or leisure purposes (32%) or for managing home and family (29%). Other interpersonal contacts account for 15% of the reasons for making calls and only 24% of calls are related to work or study. There are differences between men and women in the purposes for which calls are made. Over a third of men (38%) use their mobile phone to make calls for work or study activities, whereas only 11% of women use it for this purpose. Social uses of the phone account for the remaining 89% of women’s calls. If anything, text messages are even more socially oriented and a smaller proportion of both men’s (15%) and
women’s (5%) texts are devoted to work or study.
6.3 Reasons for ‘turning off’ your phone
phones in other work situations, and in order to concentrate. As might be expected from the literature on mobile phone usage in leisure situations, less than a fifth of respondents turn off their phone during leisure activities. Here again the contradictory nature of the affordances of the mobile phone are apparent. On the one hand, mobile communications facilitate the organisation and coordination of social and leisure activities. On the other hand, unwanted or unexpected phone calls that demand attention represent undesirable disruptions to the quality of leisure time.
Figure 8: Proportion of people turning off their mobiles in each situation
0 20 40 60 80 100
Cinema/ T heatre
Meetings at work
Resturant Other work Conentrate Leisure Other home Meals
at home
Never
P
ercen
t
6.4 Current and expected access to internet services using the mobile phone
6.4.1 Internet services currently accessed by mobile phone
As mentioned earlier, there is a very high awareness of 3G (86% of males and 75% of females). But 61% of respondents indicate that they do not access any internet
18 -Figure 9: Currently accessed internet services
0 10 20 30 40 50 60 70
None of these
Email Information
services
Banking
Down-loading
Location services
Send/ receive
Video
Shopping Watching
TV
Chat room
Internet Services Currently Used
P
er ce
[image:21.612.80.703.146.344.2]19 -Figure 10: Perceived future use of mobile phone to access internet services
0 10 20 30 40 50 60
None of these
Send/receive email
Information services
Location services
Banking Video Downloading Watching
TV
Shopping Chat room
Perceived future use of mobile phone access to the internet
P
er cen
[image:22.612.84.721.145.347.2]6.4.2 Perceived future use of mobile phone to access internet services
When asked about their intentions if they had an internet capable phone, half of the respondents say that they would not use any of these services, about a third indicate an interest in using it for email, a fifth for weather information, an eighth for location services, and a similar proportion for banking and sport, news and current affairs and for downloading games, music or movies (See Figure 10). Less than one in ten indicate an interest in consuming video, less than one in twenty-five might watch live or on-demand television, and an even smaller proportion would visit chat rooms.
7. MOBILE PHONE USE FOR WORK
Up to this point, we have presented data based on our entire sample (N=1358). From this juncture, we turn our attention to the smaller number of respondents who are employed (N=877).
7.1 Perceived difficulty in doing job without a mobile phone
Employed respondents were asked ‘How hard would it be for you to do your job without a mobile phone (or other mobile device)?’ This question taps into the necessity of using mobile communication in the workplace and the degree of disruption that would be caused by the absence of this technology. Results are presented in Figure 11. Overall, over 57% of the workers thought that it would be ‘very easy’ or ‘moderately easy’ to do their job without a mobile phone. Conversely, one third (35%) thought it would be ‘difficult’ or ‘moderately difficult’ to work successfully without their mobile. A mere 8% thought it would be ‘impossible’ to do their job properly without a mobile phone.
Figure 11: Difficulty of doing job without a mobile phone
0 20 40 60 80 100
Male Female
P
er cen
t
Impossible Difficult
Moderately difficult Moderately easy Very easy
The majority of clerical workers and labourers thought it would be ‘very easy’ to successfully complete their work without a mobile phone while, on balance, approximately half of managers, professional workers and tradespersons thought it would be difficult, or in extreme cases impossible, to do their job without a mobile phone.
7.2 ‘May be contacted’ during holiday
A key feature of the work/life boundary is the practice of taking holidays, away from both the workplace and the drudgery of home. This spatial separation is the defining feature of holidays and indeed leisure activities. The mobile phone, as noted earlier, is uniquely designed to function independently of location. Consequently, the notion of being ‘out of touch’ while away on holiday no longer applies automatically. Mobile phone users can now choose whether to stay connected or enforce the customary break in communicative contact.
likely as women (31%) to be using their mobile phone to talk to their work colleagues while on holiday. It appears that employed women are more concerned than men to prevent the encroachment of work into holiday time.
Managers are the most likely (59%) to take their phone on holiday to conduct business, whereas only 30% of clerical workers do the same.
7.3 Impact on workload and productivity
Half of employed respondents see mobiles as increasing their workload, for 42% the effect is neutral, and for a few (9%) the mobile reduces their workload. Men (57%) are roughly twice as likely as women (33%) to say that the mobile phone increases their workload. This is offset by productivity gains. Over half (55%) of employed respondents indicate that job-related mobile calls increase their productivity. The majority of women consider that the mobile phone has a neutral effect on their productivity, while men are more positively disposed, especially tradespersons.
8. WORK-FAMILY ISSUES
8.1 Maintaining contact with extended family
Respondent were asked ‘How important are the following in maintaining contact with your extended family’ and invited to rate various communication modalities on a five point scale, ranging from ‘very important’ to ‘very unimportant’. The mode of communication respondents consider most salient for maintaining contact with extended family were, in order of importance, the landline (83%), face-to-face visits (76%), the mobile phone (66%), followed by emails (61%), texting (48%), and then a large gap to the traditional modality of letter writing (23%) and the newest
Regardless of the communication medium, women are more likely than men to consider maintaining contact with family ‘very important’. In our study we found that 86% of females consider that the landline is either ‘important’ or ‘very important’. Interestingly, nearly two-thirds of the women who regard the landline as a useful way of maintaining contact chose the most extreme positive response category of ‘very important’. The same pattern holds for mobile phones and emails. This is consistent with the literature on the gendering of the telephone that has demonstrated that maintaining kinship relations is traditionally a task undertaken by women.
8.2 Using the mobile phone to facilitate family/household coordination
We asked respondents in multi-person households: ‘How significant are the following reasons for using your mobile phone to facilitate family/household coordination?’. Specifically, respondents rated ‘planning meals’; ‘arranging to meet with
family/household members’; ‘arranging to deliver goods or children’; ‘finding out where children are’ and ‘informing when to expect me home’ on a five point scale ranging from ‘very important’ to ‘very unimportant’. The greatest importance is attached to information about the timing of the arrival at home (81%) and arranging to meet with other family members (82%). Among parents, ‘arranging to deliver goods or children’ and ‘finding out where children are’ is rated as important by 63% and 58% respectively. Mobile phones are rated as either ‘very important’ or ‘important’ for planning meals by just a third of the respondents, while almost two-thirds suggest that the mobile phone was either neutral or unimportant for planning meals.
8.3 Balancing work and home/family/personal life
Employed respondents were asked to rate ‘What impact has the use of your mobile phone had on your ability to balance your work and home/family/personal life?’ on a five point scale, ranging from ‘increased a lot’ to ‘decreased a lot’. Very few
8.4 Mobile phones, parents and the security of their children
Much has been made of the fact that parents are using the mobile phone to monitor their children’s whereabouts. Increased security is proffered as a major reason for buying a mobile for children. So the question arises, does the presence of a mobile phone connection assuage parents’ anxiety about their children staying out late. One might presume that the sex of the child might make a big difference, but this is not the case. Respondents were asked; ‘If you had a teenage son, would you allow him to stay out later if he had a mobile phone?’ and ‘If you had a teenage daughter, would you allow her to stay out later if she had a mobile phone?’. Perhaps surprisingly there is little difference in responses according to whether the teenager is male or female. In both cases, around 30% would permit their child to stay out late if they had a phone. It could be that parents are more concerned with setting unambiguous boundaries for teenage behaviour and this produces limits to remote monitoring by mobile devices.
8.5 Importance of mobile phone in routinely separated couple relationships
Instead of the transmission of specific information being the crucial element of making a mobile phone call, in many cases the call itself is what is important. Keeping in touch while physically apart is an expression of intimacy. Through the mobile phone, people can be apart and yet very close. In order to gain some insight into this possible use, we asked respondents: ‘If you and your partner are routinely apart for more than a day at a time, how important is the mobile phone in maintaining the quality of your relationship?’ and invited them to respond on a five point scale ranging from ‘very important’ to ‘very unimportant’. Approximately three-quarters of both men and women consider the mobile phone to be either very important or important in maintaining the quality of their relationship while geographically separated.
9. PERCEIVED COSTS AND BENEFITS OF MOBILE PHONE OWNERSHIP
9.1 Can I live without my mobile phone?
Mobile phones have become so thoroughly indispensable that life may be
perceived as so disruptive that everyday life cannot proceed as normal. In order to measure the extent of people’s dependence on the mobile phone, we asked
respondents: ‘How much would you miss your mobile phone if it disappeared today?’. Respondents were asked to choose between: ‘I wouldn’t miss it at all because my daily life could proceed as normal’; ‘I would miss it sometimes’; ‘I would miss it often enough that my daily life could not proceed as normal’; ‘I would miss it often’; ‘I would miss it an extreme amount’.
Less than 10% of the sample answer that they would be unaffected and their lives ‘would proceed as normal’ if they were suddenly without their mobile phone. By contrast, half of the respondents indicate that their daily lives could not ‘proceed as normal’ if they were without their mobile. Of these, the overwhelming majority would miss the mobile phone either ‘often’ or ‘extreme amount’. A similar question, asked of 1061 American cell phone users, found that 65% said that they would find it ‘very hard’ or ‘somewhat hard’ to give up their cell phone, while 21% answered that it would be ‘not at all hard’ (Pew Internet and American Life Project2002). Although this survey was conducted several years prior to ours, on this evidence, it would appear that the mobile phone is more thoroughly integrated into the everyday lives of Australians than it is for Americans.
9.2 Increased sense of personal security
Another indication of people’s feelings about the mobile phone is the sense of security they derive from carrying a mobile. Three-quarters of respondents said that carrying a mobile phone makes them feel more secure. If security is a crucial element for happiness, then having a mobile may make people happier.
9.3 Effect on time pressure
To explore the role of the mobile in relation to its effect on people’s sense of time pressure, we also asked respondents: ‘Does the mobile phone make you feel less time pressured?’. Ten per cent answered ‘Yes, a lot less’; 29% answered ‘Yes, a little less’; 15% answered ‘No, not much less’; 18% ‘No, not at all’ and 28% were unsure.
9.4 Effect on stress
To investigate the impact of the mobile phone on stress, respondents were asked: ‘Does the mobile phone make you feel more or less stressed?’ For the majority (59%) the mobile phone had made no change, while 22% said ‘somewhat less stressed’. Nine per cent responded that the mobile phone had made them ‘significantly less stressed’; and the same proportion said ‘somewhat more stressed’; and a mere 1% answered that the mobile phone made them ‘significantly more stressed’.
We then asked employed respondents ‘How often do you find your work stressful?’. Six per cent answered ‘always’; 23% ‘often’; ’49% ‘sometimes’; 18%’hardly ever’; 3% ‘never’ and 1% who couldn’t choose.
9.5 Effect on quality of leisure
Enquiries to: Dr P. Lynne Johnstone