Characterization and quantitation of soybean proteins in commercial soybean products by capillary electrophoresis
10
0
0
Texto completo
(2) 2004. C. García-Ruiz et al.. Louis, MO, USA); sodium hydroxide, sodium sulfate anhydrous, and urea were supplied from Panreac (Barcelona, Spain); methylhydroxyethylcellulose (MHEC) was furnished from Aldrich (Milwaukee, WI, USA). All solutions were prepared with HPLC-grade water (Milli-Q system; Millipore, Bedford, MA, USA). The soybean protein isolate (SPI), taken as standard, was from ICN (Aurora, OH, USA); soybean milk, soybean infant formulas, soybean flour, and textured soybean were purchased from local markets in Alcalµ de Henares and Madrid (Spain).. 2.2 Apparatus The capillary electrophoresis instrument was a 279A-HT model from Applied Biosystems (Norwalk, CT, USA), equipped with a UV detector, a temperature-controlled capillary compartment, and an autosampler. Data treatment was performed with a Turbochrom acquisition system (Perkin Elmer, Norwalk, CT, USA). The fused-silica column, 60 cm (40 cm to the detector) ´ 50 mm ID (360 mm OD), was obtained from Polymicro Technologies (Phoenix, AZ, USA). The temperature was kept constant and equal to 30oC. Injection was performed by vacuum (67.73 kPa for 1 s).. 2.3 Procedure Buffers were prepared as follows: (i) salts, acids (trisodium citrate, CHES, boric acid and disodium phosphate), and additives (sodium sulfate, MHEC and urea) were weighed and dissolved in HPLC-grade water; (ii) solutions were sonicated for a few minutes; (iii) pH was adjusted to the selected value with a concentrated solution of sodium hydroxide (borate and CHES buffers) or with the appropriate acid (citric acid or phosphoric acid) in the case of citrate and phosphate buffers; (iv) once prepared, these separation media were sonicated for 5 min and filtered before injection. Sample solutions were prepared by weighing and dissolving the adequate amount of soybean product in each separation medium; sonication was for 5 min, and centrifugation at 3000 rpm for 5 min. The clear sample solution obtained was injected in the electrophoretic system. Typically, analyses were performed automatically with the equipment described before, using a run sequence in order to improve reproducibility of retention times. At the beginning of the day, the column was first rinsed with HPLC-grade water (5 min), followed by 0.1 M sodium hydroxide (5 min), and finally HPLC-grade water (5 min). The protocol used to perform each analysis was: (i) 2 min rinse with HPLC-grade water; (ii) 2 min rinse with 0.1 M sodium hydroxide; (iii) 2 min rinse with HPLC-grade water; (iv) 4 min rinse with the separation medium (buffer and additives); (v) hydrodynamic sample. Electrophoresis 1999, 20, 2003±2012 injection from the sample vial; (vi) sample separation run for 7±10 min with the separation medium in inlet vial. All steps (i±vi) were made with the separation medium in the outlet vial. During the separation step (vi), inlet and outlet buffers were renewed for each sample; however, for preliminary experiments they were reutilized for four injections.. 2.4 Quantitative analysis For quantitative analysis of real samples, conditions were: 0.05 M phosphate buffer (pH 8)/1 M urea; detection wavelength, 254 nm, and applied voltage, 20 kV. Quantitative analysis of real samples derived from SPI and soybean seeds was achieved with the method of standard additions. For this purpose, four solutions (except for infant formulas for which, due to the complexity of the matrix, five solutions were considered) were prepared by taking the same amount of soybean product and increasing amounts of SPI (ranging from 1.5 to 4.5 mg/mL). Peak areas were integrated by setting the baseline from valley to valley.. 2.5 Data treatment The linearity in the calibration plots was tested by leastsquares regression analysis carried out with a Univariate Linear Calibration Program [13] and by the procedure described by Dorschel et al. ( 5% tolerance) [14].. 3 Results and discussion Some preliminary experiments were performed in order to select the experimental conditions enabling the analysis of soybean proteins. The SPI standard was injected under different experimental conditions in which the nature and concentration of the separation buffer and its pH, detection wavelength, and the applied voltage were modified. Two buffers of inorganic nature (borate and phosphate) and two others of organic nature (citrate and CHES) were employed with and without additives such as sodium sulfate, MHEC, and urea. Sodium sulfate was used as modifier of the electroosmotic flow (EOF) because the increase of ionic strength of the buffer decreases the EOF and improves resolution [15]. MHEC was used to prevent adsorption of proteins to the inner wall of the capillary [12, 15]. Urea, a denaturing agent for proteins, was used at low concentration (1 M; except for citrate buffer for which a 6 M urea concentration was added) to increase protein solubilization [15, 16]. Citrate buffer was used with urea and MHEC as additives at different pH ranging from 2.6 to 3.5. In the conditions.
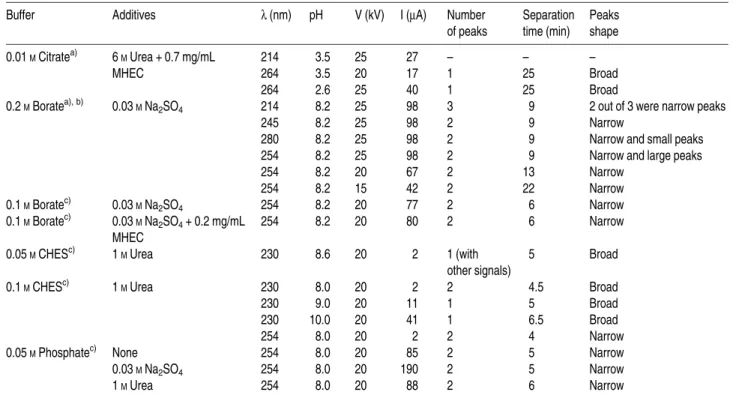
(3) Electrophoresis 1999, 20, 2003±2012. CE of soybean proteins. 2005. Table 1. Results of some preliminary experiments in which SPI was injected in a CE system Buffer. Additives. l (nm). pH. V (kV). I (mA). 0.01 M Citratea). 6 M Urea + 0.7 mg/mL MHEC. 0.2 M Boratea), b). 0.03 M Na2SO4. 0.1 M Boratec) 0.1 M Boratec). 3.5 3.5 2.6 8.2 8.2 8.2 8.2 8.2 8.2 8.2 8.2. 25 20 25 25 25 25 25 20 15 20 20. 27 17 40 98 98 98 98 67 42 77 80. 0.05 M CHESc). 0.03 M Na2SO4 0.03 M Na2SO4 + 0.2 mg/mL MHEC 1 M Urea. 214 264 264 214 245 280 254 254 254 254 254 230. 8.6. 20. 2. 0.1 M CHESc). 1 M Urea. 0.05 M Phosphatec). None 0.03 M Na2SO4 1 M Urea. 230 230 230 254 254 254 254. 8.0 9.0 10.0 8.0 8.0 8.0 8.0. 20 20 20 20 20 20 20. 2 11 41 2 85 190 88. Number of peaks. Separation time (min). Peaks shape. ± 1 1 3 2 2 2 2 2 2 2. ± 25 25 9 9 9 9 13 22 6 6. ± Broad Broad 2 out of 3 were narrow peaks Narrow Narrow and small peaks Narrow and large peaks Narrow Narrow Narrow Narrow. 1 (with other signals) 2 1 1 2 2 2 2. 5. Broad. 4.5 5 6.5 4 5 5 6. Broad Broad Broad Narrow Narrow Narrow Narrow. a) Sample injection, 67.73 kPa for 2 s b) Capillary, 75 cm (50 cm to the detector) ´ 50 mm ID (360 mm OD) c) Sample injection, 67.73 kPa for 1 s specified in Table 1, the injection of the SPI standard at two different detection wavelengths was performed. At 214 nm (corresponding to the maximum absorption of peptide bonds) no signal was detected and at 264 nm (corresponding to the maximum in the absorption spectra of the SPI standard in citrate buffer against the same citrate buffer as blank) one broad peak was obtained at about 25 min. Such bad results could be expected since at acid pH, soybean proteins would be positively charged and they could be adsorbed into the inner wall of the capillary (negatively charged). When borate, CHES, and phosphate buffers were used at basic pH (pH ~ 8) with different additives (Table 1), two peaks were obtained when the SPI standard was injected. In this case, short analysis times were obtained (Fig. 1). Migration times for peaks 1 and 2 of SPI were about 4 and 6 min for borate and phosphate buffers, respectively, and even shorter for the CHES buffer (about 3 and 4 min). These results were obtained using a detection wavelength of 254 nm; however, other detection wavelengths were also investigated for these buffers. In fact, in addition to 214 nm and the maximum absorption wavelength of SPI in each buffer (202 nm for borate buffer, 230 nm for CHES buffer and 233 nm for phosphate buffer), wavelengths corresponding to the maximum absorp-. tion of certain amino acids were investigated: 245 nm (cystine), 254 nm (phenylalanine), and 280 nm (aromatic amino acids such as tyrosine and tryptophan). As an example, Fig. 2 shows the effect of the detection wavelength on the analysis of SPI with a borate buffer. As in the case of phosphate and CHES, 254 nm was found to be the best wavelength in order to obtain maximum signal and minimum baseline noise together with good resolution. A comparison of the results obtained at acid pH values with citrate buffer and at basic pH with borate, phosphate, and CHES buffers showed the convenience of using basic pH. At these pH values, soybean proteins are negatively charged (isoelectric points close to 4.8 and 6.4) and the adsorption to the negatively charged inner wall of the capillary is minimum. However, when pH values higher than 8 were investigated, results did not improve. In fact, when the pH was increased over 8, the signal obtained for SPI deteriorated and current intensity increased. Therefore, pH 8 was considered appropriate to analyze soybean proteins. Finally, although different values of applied voltage ranging from 15 to 25 kV were tested (see Table 1), a value of 20 kV was chosen in order to decrease analysis time without excessively increasing the current intensity..
(4) 2006. C. García-Ruiz et al.. Electrophoresis 1999, 20, 2003±2012. Figure 1. Electropherograms corresponding to the injection of SPI with different separation media. Conditions: detection wavelength, 254 nm; applied voltage, 20 kV; injection by vacuum, 67.73 kPa for 1 s; temperature, 30oC; concentration of SPI, as basis, 6 mg/mL; capillary, 60 cm (40 cm to the detector) ´ 50 mm ID (360 mm OD). Separation media: (a) 0.1 M borate buffer, 0.03 M sodium sulfate, 0.2 mg/mL MHEC (pH 8.2); (b) 0.1 M CHES buffer, 1 M urea (pH 8); (c) 0.05 M phosphate buffer, 1 M urea (pH 8).. 3.1 Characterization of commercial soybean products All of the above-mentioned preliminary results enabled us to select the best experimental conditions to analyze soybean proteins: borate, CHES or phosphate buffers at pH close to 8 using a detection wavelength of 254 nm and an applied voltage of 20 kV. These initial conditions were applied to characterize commercial soybean products. However, other conditions such as buffer concentration or the additive©s nature were to be selected. In order to characterize commercial soybean products by capillary electrophoresis, some of the experimental conditions used in the preliminary study and included in Table 1 were chosen: a 0.1 M borate buffer with 0.03 M sodium sulfate and 0.2 mg/mL MHEC, a 0.1 M CHES buffer with 1 M urea and a 0.05 M phosphate buffer with 1 M urea. These buffers were used to inject into the capillary electrophoresis system the SPI standard and commercial soybean derivatives such as soybean milk (liquid and powdered), infant formulas, soybean flour, and textured soybean.. Similar results were obtained in the case of SPI with borate, CHES and phosphate buffers (as shown in Fig. 1). However, when commercial soybean products were injected, electropherograms obtained with borate and CHES buffers presented a higher complexity than those obtained with phosphate buffer due to the increase in the baseline noise and the number of signals from the sample matrix, especially for infant formulas, the composition of which is more complex than that of the other samples. Figure 3 shows the electropherograms obtained with phosphate buffer for four different kinds of soybean milks (two powdered and two liquid) made from a soybean protein isolate. In these samples, the two peaks of soybean proteins can be identified, obtaining a higher number of signals for the powdered than for the liquid soybean milk according to their more complex composition. Especially for the powdered soybean milk, these electropherograms are similar to that obtained for SPI (Fig. 1), which is the second major peak. However, the contrary is observed for those products directly derived from soybean seeds and not from a soybean protein isolate (soybean flour,.
(5) Electrophoresis 1999, 20, 2003±2012. CE of soybean proteins. 2007. Figure 2. Electropherograms showing the effect of the detection wavelength on the analysis of the SPI with a borate buffer. Conditions: 0.2 M borate buffer, 0.03 M sodium sulfate (pH 8.2); applied voltage, 25 kV; injection by vacuum, 67.73 kPa during 2 s; temperature, 30oC; concentration of SPI, as basis, 2 mg/mL; capillary, 75 cm (50 cm to the detector) ´ 50 mm ID (360 mm OD). Detection wavelength: (a) 214 nm; (b) 245 nm; (c) 254 nm; (d) 280 nm. textured soybean, and milk from soybean seeds). Figure 4 shows the electropherograms obtained with phosphate buffer for three products directly derived from soybean seeds. These electropherograms are characterized by their simplicity and by the fact that the first peak is the major one, and not the second as for SPI. Finally, electropherograms corresponding to infant formulas were the most complex according to the composition of the sample. Since phosphate buffer showed greater possibilities to study commercial soybean samples, this buffer was chosen to carry out quantitative analysis of soybean proteins in this kind of products.. 3.2 Quantitative analysis In order to achieve the quantitative analysis of real samples, the method of external standard was first employed using the SPI as standard. However, quantitation of soybean proteins in these products using the addition of the areas of two peaks as well as the area of one of the two peaks obtained for each sample, and interpolating these values in the calibration plot, gave rise to a higher soybean protein content than that indicated on the label of each product. In order to investigate the existence of matrix effects, calibration was performed by the method.
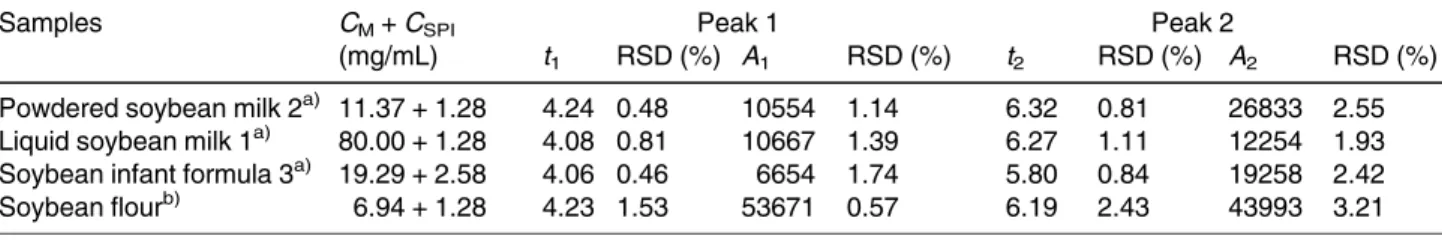
(6) 2008. C. García-Ruiz et al.. Electrophoresis 1999, 20, 2003±2012. Figure 3. Electropherograms corresponding to four types of soybean milk manufactured from SPI. Conditions: 0.05 M phosphate buffer, 1 M urea (pH 8); detection wavelength, 254 nm; applied voltage, 20 kV; injection by vacuum, 67.73 kPa for 1 s; temperature, 30oC; capillary, 60 cm (40 cm to the detector) ´ 50 mm ID (360 mm OD). Concentration, as basis: (a) powdered soybean milk 1, 8.4 mg/ mL; (b) powdered soybean milk 2, 12.2 mg/mL; (c) liquid soybean milk 1, 99.6 mg/mL; (d) liquid soybean milk 2, 102 mg/mL. of standard additions and the slopes of the two calibration plots (methods of external standard and standard additions) were compared. Results showed that the two slopes were significantly different (P < 0.05), indicating the existence of matrix effects. Consequently, the method of standard additions was chosen to carry out quantitative analysis of soybean products. This method was employed using the total area (the addition of the areas of two peaks) as well as the area of the second peak.. To evaluate the precision of this method, repeatability and reproducibility were studied. The repeatability in migration time and peak area was determined (as relative standard deviation, RSD) for five consecutive injections of some representative samples (powdered soybean milk 2, liquid soybean milk 1, soybean infant formula 3, and soybean flour). The results (grouped in Table 2) show that the RSD was less than 2.4% for the migration time and less than 3.2% for the peak area. On the other hand,.
(7) Electrophoresis 1999, 20, 2003±2012. CE of soybean proteins. 2009. Figure 4. Electropherograms corresponding to three products directly derived from soybean seeds. Concentration, as basis: (a) soybean flour, 7.5 mg/mL; (b) textured soybean, 7.5 mg/mL; (c) liquid soybean milk 3, 95.5 mg/mL; Experimental conditions as in Fig. 3.. Table 2. Evaluation of repeatability of migration times and peak areas employing the calibration by the method of standard additions (5 determinations) Samples. CM + CSPI (mg/mL). Powdered soybean milk 2a) 11.37 + 1.28 Liquid soybean milk 1a) 80.00 + 1.28 Soybean infant formula 3a) 19.29 + 2.58 Soybean flourb) 6.94 + 1.28. t1. Peak 1 RSD (%) A1. RSD (%). t2. Peak 2 RSD (%) A2. RSD (%). 4.24 4.08 4.06 4.23. 0.48 0.81 0.46 1.53. 1.14 1.39 1.74 0.57. 6.32 6.27 5.80 6.19. 0.81 1.11 0.84 2.43. 2.55 1.93 2.42 3.21. 10554 10667 6654 53671. a) Derived from SPI b) Derived from soybean seeds CM, sample concentration expressed as dry basis CSPI, SPI concentration expressed as dry basis and corrected by the purity of the standard. 26833 12254 19258 43993.
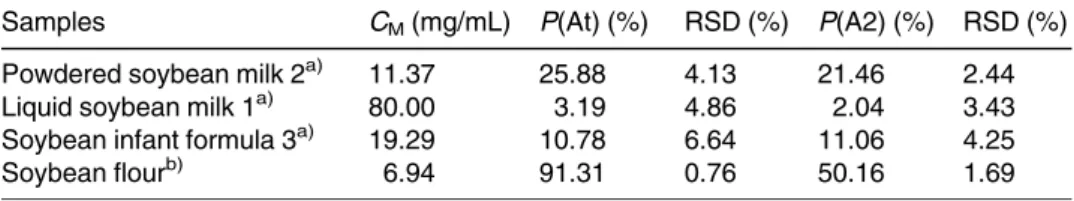
(8) 2010. C. García-Ruiz et al.. Electrophoresis 1999, 20, 2003±2012. Table 3. Evaluation of reproducibility employing the calibration by the method of standard additions (5 individual determinations) Samples a). Powdered soybean milk 2 Liquid soybean milk 1a) Soybean infant formula 3a) Soybean flourb). CM (mg/mL). P(At) (%). RSD (%). P(A2) (%). RSD (%). 11.37 80.00 19.29 6.94. 25.88 3.19 10.78 91.31. 4.13 4.86 6.64 0.76. 21.46 2.04 11.06 50.16. 2.44 3.43 4.25 1.69. a) Derived from SPI b) Derived from soybean seeds CM, sample concentration expressed as dry basis P(At) (%), soybean protein content determined from the total peak area P(A2) (%), soybean protein content determined from the area of peak 2. Table 4. Quantitative analysis of soybean proteins in different commercial soybean products Sample a). Powdered soybean milk 1 Powdered soybean milk 2a) Liquid soybean milk 1a) Liquid soybean milk 2a) Soybean infant formula 1a) Soybean infant formula 2a) Soybean infant formula 3a) Soybean infant formula 4a) Soybean flourb) Textured soybeanb) Liquid soybean milk 3b) Liquid soybean milk 4b) Liquid soybean milk 5b). CM (mg/mL). P(At) (%). RSD (%). P(A2) (%). RSD (%). P.L.(%). P.Kj.(%). 7.45 11.37 99.60 102.00 19.25 19.04 19.26 19.34 6.94 6.91 95.80 103.00 110.10. 35.44 23.14 3.51 3.24 17.44 15.67 11.19 8.72 95.33 95.51 11.25 11.47 5.43. 1.37 1.22 7.97 0.01 3.09 11.10 1.70 4.81 4.24 0.48 7.85 0.43 6.64. 34.19 20.86 2.26 2.16 12.25 12.52 11.38 9.58 47.81 54.60 4.63 3.21 3.02. 0.35 0.59 7.08 0.46 3.42 14.85 1.74 3.54 1.46 3.08 9.31 1.87 9.37. 35 21.3 3.3 3.1 14.7 15 14 14.3 38 54 3.8 3.7 3.6. 34.81 22.31 2.89 2.82 14.70 14.30 14.00 14.30 51.65 55.61 ± ± 3.70. a) Derived from SPI b) Derived from soybean seeds CM, sample concentration expressed as dry basis P(At) (%), soybean protein content determined from the total peak area P(A2) (%), soybean protein content determined from the area of peak 2 P.L. (%), protein content indicated on the label of the product P.Kj (%), protein content determined by the Kjeldahl method (average of six determinations) [9] reproducibility for the same samples was measured as the RSD obtained for the five values of concentration obtained when five individual analyses were performed for a given sample. Results obtained measuring the total area (adding the areas of peaks 1 and 2) and the area of the second peak are shown in Table 3. The RSD was less than 6.6% in the first case and less than 4.2% in the second. Since the characteristics of the analytical method developed were acceptable, quantitative analysis of soybean proteins in different commercial samples was achieved. Table 4 groups the results obtained concerning the soybean protein content for different commercial products using total area (the addition of the areas of peaks 1 and 2) and the area of the second peak and the calibration by. means of the method of standard additions. Two groups of products were analyzed: a group of infant formulas and powdered and liquid milk manufactured from a soybean protein isolate and a group of products directly derived from soybean seeds (soybean flour, textured soybean, and different types of liquid milk). Table 4 shows how the area of the second peak, corresponding to soybean proteins, enables their correct quantitation in the commercial products studied, especially for those samples derived from soybean seeds. Generally, the content obtained for these proteins is in good agreement with the value indicated on the label of the product and with the protein content measured by the Kjeldahl method (average of six determinations) [9]. The greatest differences between the protein content obtained by the CE method and the Kjeldahl method correspond to those samples with a higher.
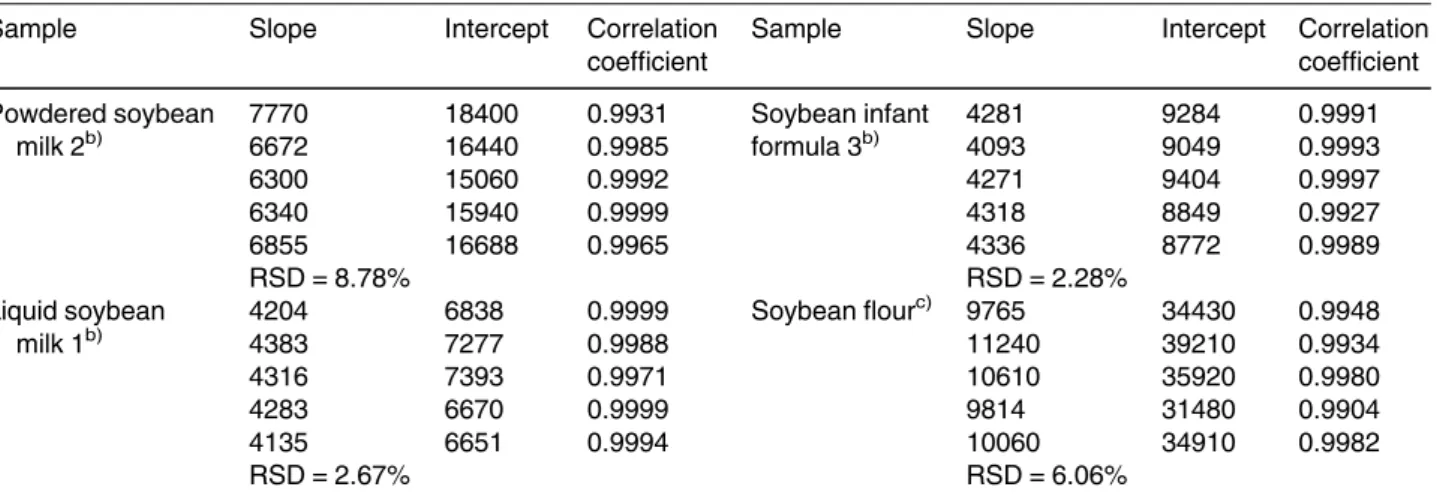
(9) Electrophoresis 1999, 20, 2003±2012. CE of soybean proteins. 2011. In order to evaluate the robustness of the method, the slopes of the calibration lines obtained with the method of standard additions (by peak 2) were compared. Table 5 shows the characteristics of these calibration lines and the RSDs obtained for the slopes, which in all cases were less than 8.8%. Accuracy was evaluated calculating the recovery (%) of soybean proteins found when a known quantity of the SPI was added to a real sample of a soybean product. As representative samples, soybean powdered milk 2 (derived from SPI) and soybean flour (derived from soybean seeds) were considered. Table 6. amount of additives such as vitamins or amino acids which increase the value of protein content obtained from total nitrogen (Kjeldahl method). Therefore, the proposed CE method is an interesting possibility for evaluating the real soybean protein content of a sample. Quantitation with total area is not recommended, especially not for those products derived directly from soybean seeds. As mentioned above, in such a case, a great increase in the area of the first peak was obtained, probably due to a coelution of other components existing in these products with the first peak of soybean proteins.. Table 5. Slopes, intercepts, correlation coefficients, and robustness (expressed as RSD for slopes values) corresponding to the calibration straight lines obtained by the method of standard additionsa) Sample. Slope. Intercept. Correlation coefficient. Sample. Slope. Intercept. Correlation coefficient. Powdered soybean milk 2b). 7770 6672 6300 6340 6855 RSD = 8.78% 4204 4383 4316 4283 4135 RSD = 2.67%. 18400 16440 15060 15940 16688. 0.9931 0.9985 0.9992 0.9999 0.9965. Soybean infant formula 3b). 9284 9049 9404 8849 8772. 0.9991 0.9993 0.9997 0.9927 0.9989. 6838 7277 7393 6670 6651. 0.9999 0.9988 0.9971 0.9999 0.9994. Soybean flourc). 4281 4093 4271 4318 4336 RSD = 2.28% 9765 11240 10610 9814 10060 RSD = 6.06%. 34430 39210 35920 31480 34910. 0.9948 0.9934 0.9980 0.9904 0.9982. Liquid soybean milk 1b). a) Based on the measurement of the area of peak 2 in the electropherogram of SPI and samples b) Derived from SPI c) Derived from soybean seeds. Table 6. Recovery for the powdered soybean milk 2 (derived from SPI) and soybean flour (derived from soybean seeds) by the CE methoda) Sample. CM (mg/mL). Amount of SPI added to the sample (mg)b). Total protein concentration (mg/mL). Protein concentration found by the CE method (mg/mL)c). Recovery (%). Powdered soybean milk 2 (21.46 mg/100 mg)d). 11.37. 0.86 1.72 2.58. 3.30 4.16 5.02. 3.22 (9.63)e) 3.84 (1.75) 4.76 (5.04). Soybean flour (50.16 mg/100 mg). 6.94. 0.86 1.72 2.58. 4.34 5.20 6.06. 4.44 (0.56) 5.22 (2.59) 5.63 (2.52). 97.58 92.31 94.82 Mean value: 94.90 (2.64) 102.30 100.38 92.90 Mean value: 98.53 (5.04). a) b) c) d). Experimental conditions as in Fig. 3 and calibration by the method of standard additions using the area of peak 2 Expressed as dry basis and corrected by the purity of the standard Mean value corresponding to two individual injections Mean value of soybean protein concentration, expressed as dry basis, found by analyzing five individual samples by the CE method e) RSD in % CM, sample concentration expressed as dry basis.
(10) 2012. C. García-Ruiz et al.. Electrophoresis 1999, 20, 2003±2012. shows the results obtained when the amount of SPI added to these samples was increased and measured by the CE method. Recoveries obtained (mean of two individual determinations) were 94.9% for the powdered soybean milk 2 and 98.5% for soybean flour.. [4] Peterson, R. E., Wolf, W. J., J. Chromatogr. 1988, 444, 263±268.. 4 Concluding remarks. [6] Oomah, B. D., Voldeng, H., Fregeau-Reid, J. A., Plant Foods Hum. Nutr. 1994, 45, 251±263.. This work shows for the first time that CE can be used to characterize and quantify soybean proteins in different commercial soybean products for human consumption. The CE method developed used a 0.05 M phosphate buffer (pH 8) modified with 1 M urea and UV detection at 254 nm. In these conditions, a rapid separation of soybean proteins was achieved (separation times less than 7 min) and characterization and quantitation of soybean proteins in real samples were successfully performed. The authors thank the University of Alcalµ de Henares (project E002/98) and the Comunidad Autónoma de Madrid (project COR 0035/94 and 06G/047/96) for financial support and C. Marina for linguistic assistance. Received November 24, 1998. 5 References [1] García, M. C., Torre, M., Marina, M. L. Laborda, F., CRC Crit. Rev. Food Sci. Nutr. 1997, 37, 361±391. [2] Ladodo, K. S., Borovik, T. E., in: Waggle, D. H., Steinke, F. H., Volgarev, M. N. (Eds.), New Protein Foods in Human Health: Nutrition, Prevention, and Therapy, CRC Press, Boca Raton 1992, pp. 85.. [3] Ashoor, S. H., Stiles, P. G., J. Chromatogr. 1987, 393, 321±328.. [5] Peterson, R. E., Wolf, W. J., Cereal Chem. 1992, 69, 101±104.. [7] García, M. C., Torre, M., Laborda, F., Marina, M. L., J. Chromatogr. A 1997, 758, 75±83. [8] García, M. C., Marina, M. L., Torre, M., Anal. Chem. 1997, 69, 2217±2220. [9] García, M. C., Torre, M., Marina, M. L., J. Chromatogr. Sci. 1998, 36, 527±534. [10] García, M. C., Marina, M. L., Torre, M., J. Chromatogr. A 1998, 822, 225±232. [11] Wong, T. M., Carey, C. M., Lin, S. H. C., J. Chromatogr. A 1994, 680, 413±417. [12] Kanning, M., Casella, M., Olieman, C., LC-GC Int. 1993, 6, 701±706. [13] Blanco, M., BoquØ, R., Cela, R., Coello, J., Maspoch, S., Ortíz, M. C., Riba, J., Rius, F. X., Ruíz, A., Sarabia, L. A., Tomµs, X., Avances en Quimiometría Prµctica, Servicio de Publicación e Intercambio Científico, Santiago de Compostela 1994. [14] Dorschel, C. A., Ekmanis, J. L., Oberholtzer, J. E., Warren, Jr., F. V., Bidlingmeyer, B. A., Anal. Chem. 1989, 61, 951A±968A. [15] Oda, R. P., Landers, J. P., in: Landers, J. P. (Ed.), Handbook of Capillary Electrophoresis, CRC Press, Boca Raton 1993, pp. 10. [16] Nishi, H., Matsuo, M., J. Liq. Chromatogr. 1991, 14, 973±986..
(11)
Figure
Documento similar