Diagnosis of Induction Motors fed by Voltage Source
Inverters using Additive Models. Influence of the
operating conditions.
Duque-Perez; O; Garcia-Escudero, L.A.; Moriñigo-Sotelo, D.; Gardel, P.E.;
Perez-Alonso, M
Abstract –. Condition monitoring of induction motors fed by Voltage Source Inverters is challenging since the influence of the supply complicates the use of methods valid for utility fed motors. When trying to obtain a fault detection scheme valid for any kind of supply and at any operating frequency is necessary to analyze the influence of the different operating conditions. To obtain generic conclusions, a statistical analysis has been performed over the data obtained in a controlled laboratory experiment where a hole was progressively drilled into a rotor bar. Additive models have been obtained to stand out the influence of the operating conditions over the fault signatures. Conclusions useful for condition monitoring are drawn.
Index Terms – Additive Models, Analysis of variance, Condition monitoring, Converters, Fast Fourier transforms, Fault diagnosis,
Induction motors, Predictive maintenance, Spectral analysis, Statistical analysis.
I. INTRODUCTION
Induction motors are essential in many industries. Their simplicity and ruggedness are outstanding advantages and make them by far the most commonly used type of motor in sizes ranging from fractional horsepower to grades of industrial applications [1]. However, owing to the thermal, electrical and mechanical stresses, mechanical failures are unavoidable in induction motors [2].
The need to increase reliability against possible faults has attracted considerable interest in fault diagnosis of induction motors in recent years [3,4]. The main aim of a condition monitoring system is to detect incipient faults before a potentially harmful machine failure occurs since a faulty motor means a reduction on production, a cost increase and a hazard to people and machinery [5,6]. It is necessary that the method has low missed and false alarms rates, in order to discriminate among various machine conditions, classifying faulty modes from normal modes. Approaches which allow relatively unskilled operators to make reliable decisions without a diagnosis specialist to examine data and diagnose problems are desirable [7].
In order to fulfill this objective, a robust condition monitoring technique was proposed in [8], which was based on statistical tools to detect incipient faults in induction motors related to rotor cage asymmetries. This technique is based on Motor Current Signature Analysis (MCSA) [9], which is currently considered as a standard in preventive maintenance basically due to the advantages of using non-invasive sensors [10]. More precisely, it was developed an expert system that makes use of the Fast Fourier Transform to obtain the spectrum of the motor line current [11,12] and a multiresolution technique using wavelet functions [13-16] to detect significant peaks in the spectrum and to measure the height of these peaks with respect to the ‘‘baseline” signal. Finally, a Quality Control approach based on robust multivariate control charts is applied to detect a progressive deterioration of the rotor cage [17,18].
This technique has been successfully applied to the early detection of broken bars in induction motors fed by a sinusoidal voltage supply. Nevertheless, the introduction of VSI-fed (Voltage Source Inverters) motors in applications where variable speed and torque are needed has produced significant changes in the field of diagnostics needing further research in order to overcome various challenges such as noise (inherent floor noise reduces the possibility of true fault signature recognition using line current spectrum) [19,20], dynamically changing excitation frequency and the fact that fault signatures can significantly change from open-loop to closed-loop VSI operation. All these influences complicate the utilization of frequency analysis methods. VSI-fed motor faults have been analyzed and initial results are given in literature [21–27] but further investigation is still required [28].
The amplitude of the field harmonics is also affected by the supply voltage, what makes any of the anomalies more noticeable as the supply voltage increases, provided that the machine is not working under saturation condition. This is very important, and it must be taken into account, particularly, with controlled-speed induction motors, when this control is based on voltage regulation, keeping constant the voltage/frequency ratio. Therefore, to develop a generic method valid for any supply and at different operating conditions, further considerations must be taken into account.
With this goal, in this paper it is analyzed the suitability of the fault signatures obtained from the stator current to diagnose rotor faults in induction motors fed by different supplies. First, statistical tools such as Boxplots and Analysis of Variance (ANOVA) are used to analyze the data obtained from a case-study in which a cage fault condition has been provoked by drilling
a hole in one of the bars of an induction motor. Different fault conditions have been obtained by progressively making the hole deeper. Second, Additive models are obtained which, as it is shown in Section V, are easy to interpret but much more general than linear models.
The aim of the analysis is to examine the potential of the data to perform a condition monitoring task and the influence on the diagnosis of the motor (two motors of different rated powers have been tested), supply (five supplies have been used, utility supply and four different power converters) and load (the motors have been tested from low load to full load). It is evaluated the capacity to distinguish among four different rotor bar states: healthy, incipient fault (corresponding to a 6mm depth hole), half-broken bar and full broken bar.
II. DETECTION OF BROKEN ROTOR BARS IN VSI-FED INDUCTION MOTORS
Induction motor failure through broken rotor bars (where cracking is experienced in the rotor conductors) is common in many industrial applications. One of the reasons for this type of failures is that large starting currents occur when cooling is at minimum what results in thermal and mechanical stresses being at a maximum. The incidence of this failure mode is greatest when the start-up time is relatively long and when frequent starts are required as part of a heavy duty cycle [29].
Although broken rotor bars do not initially cause an induction motor to fail there can be serious secondary effects [30]. In fact, broken rotor bars can be a major problem for some users [31].
When cage winding is symmetrical and assuming purely and balanced sinusoidal voltage supply, there is only a forward rotating field at slip frequency with respect to the rotor. If a rotor asymmetry occurs, there will be a resultant backward rotating field at slip frequency with respect to the forward rotating rotor. This backward rotating field induces a voltage and a current
in the stator winding at (1-2s)f1 frequency, where s is the motor slip and f1 is the fundamental frequency. This induced current
is the cause of torque and speed pulsations, which at the same time induce new electromotive forces in the stator, and as a
result, new counter currents are produced at frequency (1+2s)f1. This process goes on indefinitely, until it is damped and a pair
of new sidebands appears around the main frequency f1[32].
When induction motors are supplied by a VSI, line current will contain time harmonics, depending their number, frequency and amplitude on the switching strategy of the semiconductors. These time harmonics will generate new airgap spatial harmonics or will modify the amplitude of the existing ones. That is, in addition to the characteristic motor spectrum, new harmonics will be introduced, related to the fault condition, to the driven load or to the system performance. So, the current spectrum is affected by many factors, including:
Motor characteristics (stator connection, design and application).
Electric supply.
Fault condition.
In this case, where a motor with a cage asymmetry is fed with a non-sinusoidal voltage supply, the process is very similar to a motor with balanced sinusoidal one [33]. There are sidebands around the frequencies of time-harmonics of line current, at
frequencies (k±2ns)f1where k is the order of the line current time harmonics and n is any positive integer. The number of
sidebands will increase progressively, but their amplitude will decrease as they move away from the main frequency, although the magnitude of this amplitude attenuation will depend on machine and driven load inertia and the building characteristics of the motor, which, in turn, depend on its purpose or application.
Depending on the value of n there are there is the first, second, third, .., sideband around each harmonic. Nevertheless, except
for fully developed faults, the sidebands of order bigger than one are much attenuated. Therefore, for every line current harmonic there are two fault signatures corresponding to the lower sideband harmonic (LSH) and upper sideband harmonic (USH).
III. CASESTUDY
A controlled laboratory experiment was designed in which a large number of tests was carried out on two induction motors with the specifications shown in Table I. Motor M1 was fed from three different sources, utility supply (UT), a Voltage Source Inverter by Telemecanique (TE) and a Power Converter by Lucas Nülle (LN). Motor M2 was also fed from three different sources: utility supply (UT), a Power Converter by Allen Bradley (AB) and a Power Converter by Siemens (SM). Both motors were loaded with a magnetic powder brake.
TABLEI
SPECIFICATIONS OF THE TESTED MOTORS
Motor Rated power (kW)
Rated voltage (V)
Rated current (A)
Rated speed (rpm)
Pole pairs
M1 0.75 3x230/400 1.9 1395 2
M2 1.1 3x230/400 2.6 1415 2
To collect and analyze data, a Fluke Hall Effect probe, a PCI-6250 M DAQ board by National Instruments, LabView and MATLAB were used. The data acquisition resolution was 80 kHz. Four rotor conditions (Table II) were tested by progressively drilling a hole into one of the rotor bars. For each supply, 200 tests were performed, in a broad range of load conditions.
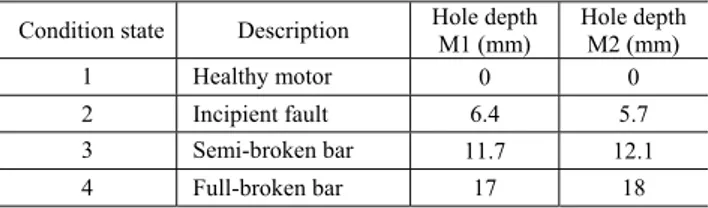
TABLEII
Condition state Description Hole depth M1 (mm) Hole depth M2 (mm)
1 Healthy motor 0 0
2 Incipient fault 6.4 5.7
3 Semi-broken bar 11.7 12.1
4 Full-broken bar 17 18
Matlab was used to process the line current consumed by the motor and registered in each test. The Power Spectral Density (PSD) is estimated from the signal applying the Hanning Window in order to reduce the spectral leakage. The function provided by Matlab has been modified with the goal of obtaining a Normalized PSD so that the amplitude of the fundamental frequency is always 0 dB.
As it has been mentioned in the introduction, condition monitoring of motors fed by VSIs is more challenging than for the utility supply case. Therefore, more research is necessary in this field. One of the difficulties of this task is the fact that the spectrum is highly affected by the specific VSI used. To illustrate this, the Power Spectral Density of the line current consumed by motor M1 with a full broken bar in the rotor under two different supplies is shown in Fig. 1. The top figure corresponds to a utility supply. Fault sidebands around the main harmonic are clearly seen and noise level is very low. The current PSD of the same motor fed by an Altivar 66 power electronic converter (TE) is represented in the bottom figure. Although operating conditions are similar in both tests (slip: 2.6%), it is very remarkable that the noise level is very high when the motor is fed with the Altivar 66. Additionally, an interharmonic appears between the lower sideband and the main harmonic. Consequently, it is more difficult to identify the fault signature in the current spectrum [34,35]. Similar conclusions can be drawn for motor M2 (Fig. 2).
Fig. 1. Normalized PSD around main harmonic. Motor M1 with a full-broken bar. Supplies UT and TE.
Fig. 2. Normalized PSD around main harmonic. Motor M2 with a full-broken bar. Supplies UT and AB.
IV. STATISTICAL ANALYSIS OF THE RESULTS
In this section, the statistical analysis results are shown with the aim of drawing relevant conclusions for the implementation of a condition monitoring expert system for induction motors with different types of electrical supply.
A. General analysis
First, several boxplots are shown and analyzed as a useful way of graphically comparing data.
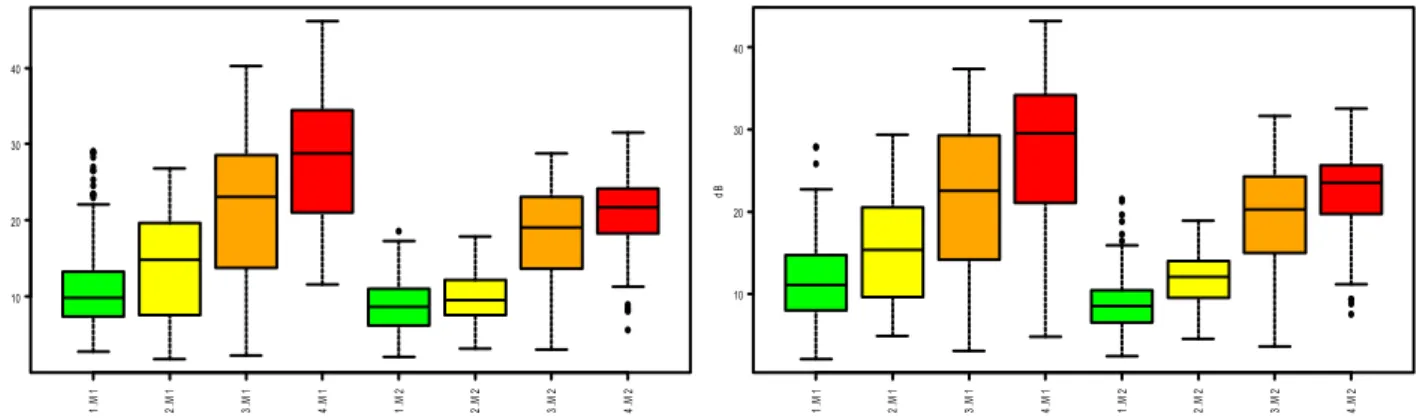
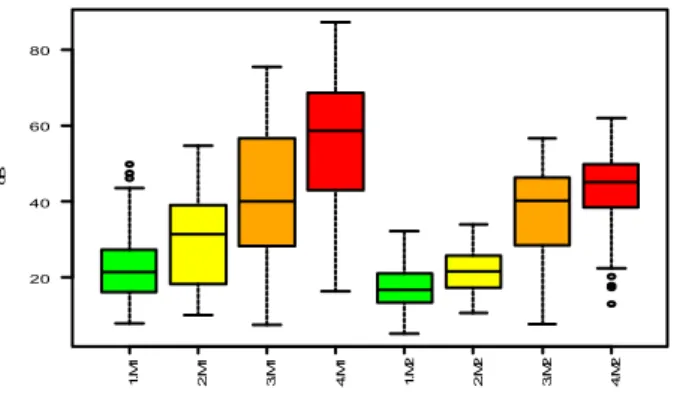
Fig. 3 shows the boxplots of the amplitude of the signature faults around the main harmonic for both tested motors, the four condition states including the three different supplies for each motor and all motor operating conditions. Motor M1 data are more spread out indicating a larger variance and causing an overlapping of the boxes.
An ANOVA has been performed to study the statistical significance of the considered variables. Table III shows the results for the data presented in Fig 3. An interesting result of this analysis is that all considered variables are significant. That is, there are differences among the four condition states (condition state 1, healthy motor, has been taken as reference category), which indicate that these data may be used to perform a condition monitoring task. In addition, there are significant differences between both motors (Motor M1 is considered the reference) that must be taken into account when developing an expert system that will be used with motors with different characteristics (even though data have been normalized so that the amplitude of the
fundamental frequency is always 0 dB). These conclusions arise from the "rule" that small p-values indicate significant
differences for the corresponding expected mean values.
The boxplots and ANOVA show that the fault signatures have potential to discriminate among the four condition states. Nevertheless, Fig. 3 show an overlapping among the boxes, which indicate that some operating conditions can be tricky to distinguish between a healthy state and an incipient fault one, between an incipient fault and a semi broken bar, and between the semi broken and the full broken bar.
Fig. 3. Boxplots of the amplitude of the broken bar signature fault for LSH (left) and USH (right) of the first sideband for both motors and four condition states.
TABLEIII
ANALYSIS OF VARIANCE.MOTORS M1 AND M2.LSH.
Estimate Std. Error t P-value (Intercept) 11.9338 0.3336 35.768 < 2e-16 *** Motor M2 -3.8749 0.3446 -11.244 < 2e-16 *** Condition 2 1.8392 0.4683 3.928 9.06e-05 *** Condition 3 9.8605 0.4687 21.038 < 2e-16 *** Condition 4 14.7252 0.4742 31.050 < 2e-16 *** Signif. codes: 0 ‘***’ 0.001 ‘**’ 0.01 ‘*’ 0.05 ‘.’ 0.1 ‘ ’ 1
Residual standard error: 5.984 on 1214 degrees of freedom Multiple R-squared: 0.5314, Adjusted R-squared: 0.5298 F-statistic: 344.1 on 4 and 1214 DF, p-value: < 2.2e-16
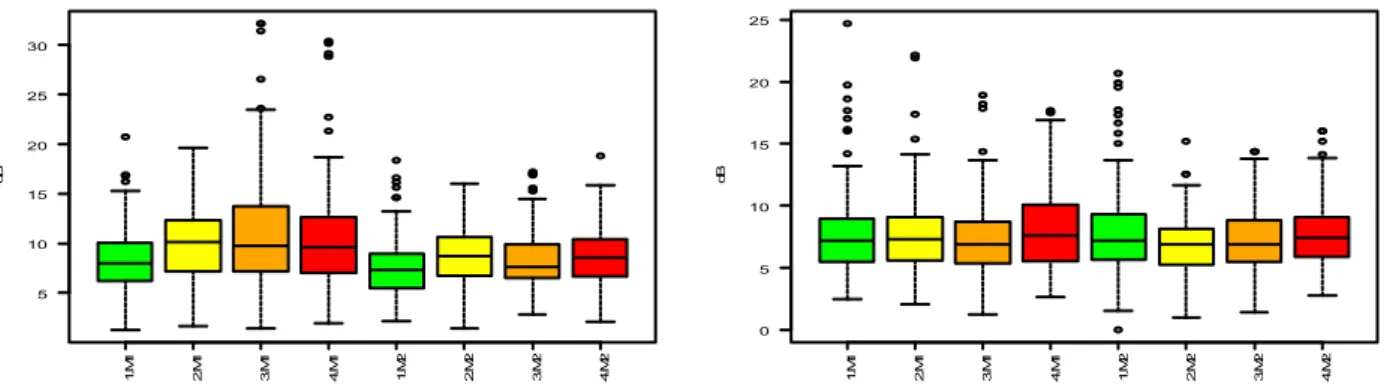
Figs. 4 and 5 show the boxplots corresponding to the sidebands around the fifth and seventh harmonic, respectively. From these plots it can be inferred that the LSH around the fifth harmonic can be useful as a fault signature to complement the information provided by the signatures around the main harmonic. However, this is not the case for the rest of fault signatures, at least, when the data obtained with all the different operating conditions are analysed together.
1.
M
1
2.
M
1
3.
M
1
4.
M
1
1.
M
2
2.
M
2
3.
M
2
4.
M
2
10 20 30 40
dB
1.
M
1
2.
M
1
3.
M
1
4.
M
1
1.
M
2
2.
M
2
3.
M
2
4.
M
2
10 20 30 40
Fig. 4. Boxplots of the amplitude of the broken bar signature fault for LSH (left) and USH (right) around the fifth harmonic for both motors and four condition states.
Fig. 5. Boxplots of the amplitude of the broken bar signature fault for LSH (left) and USH (right) around the seventh harmonic for both motors and four condition states.
It has to be taken into account that in this analysis we are mixing data from two different motors, six supplies and different load conditions. To allow us to be more conclusive, the analysis has to consider the influence of the different operating conditions. Section IV.B analyses the influence of the supply and IV.C the influence of the load.
B. Influence of the supply on the signature faults
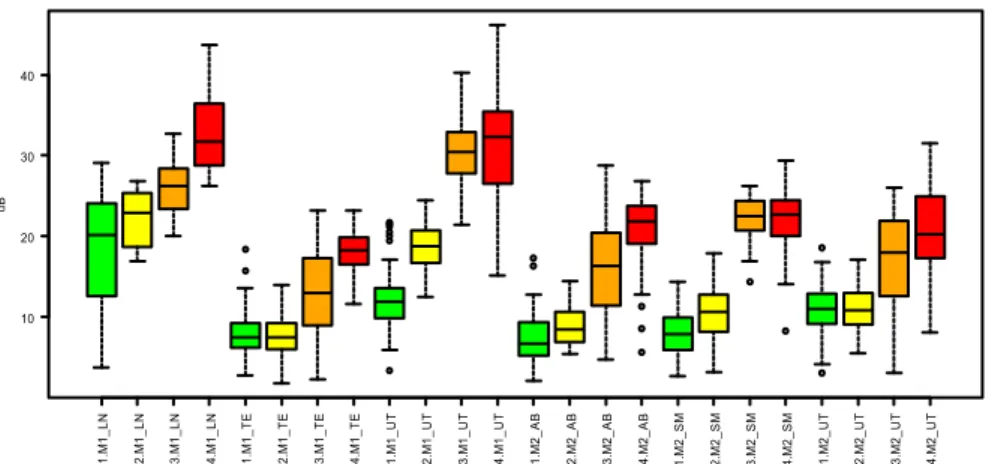
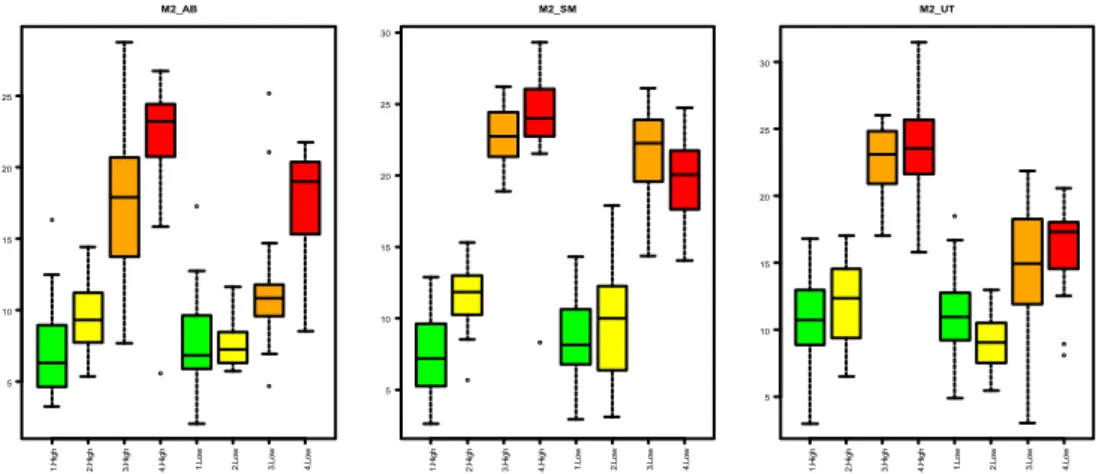
Next, data are segregated according to motor and supply to point out the diagnostic differences due to the supply. Again, boxplots for the amplitude of LSH (Fig. 6) and USH (Fig. 7) of the first sideband are shown. Tables IV-VII present the results of the ANOVA for both motors. Now, the type of supply is included in the analysis as a variable. Several interesting conclusions can be drawn from these figures and tables. The most obvious one is that results are not similar for all the motors and supplies.
Focusing on motor M1 and UT supply, the evolution of the fault severity can be clearly traced by registering these peaks. Even an incipient fault can be clearly observed because boxes for healthy motor and incipient fault do not overlap. Nevertheless, the peak amplitudes characterizing half-broken bar condition are so high (and therefore, so clearly observed) that it can be difficult to differentiate this state from a full broken bar one (boxes for states 3 and 4 overlap).
When the motor is fed by the LN supply, the amplitude of the fault peaks shows a behavior somehow similar to the UT supply. It is remarkable that when only LSH is considered, the ANOVA tells us that there is no significant difference between both supplies, although this is not the case for USH. Taking into account only LSH, boxes for condition states 1 and 2 overlap, although half-broken and complete broken bar condition states can be clearly observed. On the contrary, boxes for condition states 1 and 2 do not overlap when only LSH is considered.
The condition monitoring is more challenging when the motor is fed by the TE supply. An incipient fault can hardly be distinguished from a healthy motor condition, but a half-broken bar condition can be observed although not as clearly as for UT or LN supplies. Furthermore, the amplitudes for all the condition states are lower, and consequently the fault detection is not as straightforward as for the other supplies.
Focusing now on motor M2, the ANOVA (Tables VI and VII) indicates that, taking condition state 1 as reference, there is not significant evidence of interaction between the condition states. Therefore, the signature faults are helpful for condition
monitoring purpose. The p-value for the state 2 is quite bigger than for the other states, which implies certain difficulties to
distinguish between states 1 and 2. This fact can be observed too in the boxplots (Figs 6 and 7), where there is an overlapping between condition states 1 and 2.
If the three supplies are compared, the results from the ANOVA show that there is no significant evidence of interaction for the AB supply (again, utility supply is the reference), that is, the behavior is significantly different for this supply what must
be taken into account when designing a general purpose condition monitoring strategy. For the SM supply, the p-values for
1.
M
1
2.
M
1
3.
M
1
4.
M
1
1.
M
2
2.
M
2
3.
M
2
4.
M
2
0 5 10 15 20 25 30 35
dB
1.
M
1
2.
M
1
3.
M
1
4.
M
1
1.
M
2
2.
M
2
3.
M
2
4.
M
2
5 10 15 20
dB
1.
M
1
2.
M
1
3.
M
1
4.
M
1
1.
M
2
2.
M
2
3.
M
2
4.
M
2
5 10 15 20 25 30
dB
1.
M
1
2.
M
1
3.
M
1
4.
M
1
1.
M
2
2.
M
2
3.
M
2
4.
M
2
0 5 10 15 20 25
both peaks are highly indicating relatively similar distributions between supplies UT and SM.
TABLEIV
ANALYSIS OF VARIANCE.MOTOR M1.LSH.
Estimate Std. Error t P-value (Intercept) 10.2955 0.7514 13.701 < 2e-16 *** typeM1_LN 0.3798 0.5503 0.690 0.49 typeM1_TE -10.0824 0.4108 -24.541 < 2e-16 *** slip 114.9593 13.7517 8.360 4.33e-16 *** condition2 3.2075 0.4953 6.477 1.94e-10 *** condition3 10.2642 0.4855 21.142 < 2e-16 *** condition4 15.8637 0.5193 30.547 < 2e-16 *** Signif. codes: 0 ‘***’ 0.001 ‘**’ 0.01 ‘*’ 0.05 ‘.’ 0.1 ‘ ’ 1 Residual standard error: 4.461 on 605 degrees of freedom Multiple R-squared: 0.7985, Adjusted R-squared: 0.7965 F-statistic: 399.5 on 6 and 605 DF, p-value: < 2.2e-16
TABLEV
ANALYSIS OF VARIANCE.MOTOR M1.USH.
Estimate Std. Error t P-value (Intercept) 12.5562 0.7720 16.265 < 2e-16 *** typeM1_LN -2.6006 0.5654 -4.600 5.16e-06 *** typeM1_TE -10.3997 0.4221 - 24.639 < 2e-16 *** slip 89.6634 14.1280 6.346 4.32e-10 *** condition2 4.5680 0.5088 8.978 < 2e-16 *** condition3 9.8418 0.4988 19.732 < 2e-16 *** condition4 15.0091 0.5335 28.132 < 2e-16 *** Signif. codes: 0 ‘***’ 0.001 ‘**’ 0.01 ‘*’ 0.05 ‘.’ 0.1 ‘ ’ 1 Residual standard error: 4.584 on 605 degrees of freedom Multiple R-squared: 0.7579, Adjusted R-squared: 0.7555 F-statistic: 315.7 on 6 and 605 DF, p-value: < 2.2e-16
TABLEVI
ANALYSIS OF VARIANCE.MOTOR M2.LSH.
Estimate Std. Error t P-value (Intercept) 6.6327 0.5401 12.280 < 2e-16 *** typeM2_AB -2.2867 0.3808 -6.005 3.32e-09 *** typeM2_SM -0.1410 0.3882 -0.363 0.7166 slip 101.6038 15.2920 6.644 6.85e-11 *** condition2 1.1622 0.4287 2.711 0.0069 ** condition3 9.5110 0.4410 21.566 < 2e-16 *** condition4 11.9837 0.4300 27.871 < 2e-16 *** Signif. codes: 0 ‘***’ 0.001 ‘**’ 0.01 ‘*’ 0.05 ‘.’ 0.1 ‘ ’ 1 Residual standard error: 3.856 on 600 degrees of freedom Multiple R-squared: 0.663, Adjusted R-squared: 0.6597 F-statistic: 196.8 on 6 and 600 DF, p-value: < 2.2e-16
TABLEVII
ANALYSIS OF VARIANCE.MOTOR M2.USH.
Fig. 6. Boxplot of the amplitude of the broken bar signature fault for LSH of the first sideband for both motors, six different supplies and four condition states.
Fig. 7. Boxplot of the amplitude of the broken bar signature fault for USH of the first sideband for both motors, six different supplies and four condition states.
C. Influence of the slip
As aforementioned, the motor was tested in a broad range of load conditions in each group of tests. Hence, the results so far analyzed are obtained mixing all load conditions. The performed ANOVA (Tables IV-VII) shows that slip is a significant factor affecting the response. Therefore, the analysis is performed independently for different load conditions to determine if the diagnosis can be improved by taking into account the slip. Figs. 8 and 9 show the boxplots for LSH (Fig. 8) and USH (Fig. 9) of the first sideband for the six supplies and four condition states so far considered, but here two sets of tests are considered depending on the slip: slip higher than 0.04 (denoted as “High” in these Figs.) and slip lower than 0.04 (denoted as “Low” in these Figs.).
Once again, the behavior is different depending on the supply, although in general terms and not surprisingly, the boxes are less overlapped at high slips than at low ones, that is, the condition monitoring task would be easier at high slips.
More precisely, for utility supply and motor M1, while at low slips is hard to separate condition states 3 and 4, at high slips boxes hardly overlap. For this supply and motor M2, analogous conclusions can be drawn for states 1 and 2.
For LN and TE supplies, at high slips condition states 3 and 4 can be more easily differentiated and for AB supply, the incipient fault could be much more easily detected at high slips than at low ones. For SM supply, there are no significant differences considering high or low slips.
Fig. 8. Boxplots of the amplitude of the broken bar signature fault for LSH of the first sideband for both motors, six different supplies and four condition states. Two sets of tests are considered according to slip being higher or lower than 0.04.
Fig. 9. Boxplots of the amplitude of the broken bar signature fault for USH of the first sideband for both motors, six different supplies and four condition states. Two sets of tests are considered according to slip being higher or lower than 0.04.
D. LSH versus USH
In the previous sections, both LSH and USH have been considered in the analyses. In this one, the suitability for condition monitoring of each peak is evaluated.
In an overall analysis, the data for both peaks are quite similar not showing important differences. The variances are similar for LSH and USH, or, in some cases, larger for USH.
Performing a deeper analysis on the data, it can be observed that comparing condition states 1 and 2 (the most challenging situation for implementing a condition monitoring scheme) the data for USH show less overlapping than for LSH, while for the rest of the cases there are no important differences.
All in all, it could be concluded that LSH of the first sideband is best suited to be used as a fault signature. Nevertheless, it has to be taken into consideration that while LSH is induced by the unbalance of rotor flux, the rest of the sidebands are induced by speed and torque oscillation caused by broken rotor bar and therefore are sensitive to the inertia of the motor system [36].
1. H igh 2. H igh 3. H igh 4. H igh 1.
Low 2.Low 3.Low 4.Low
5 10 15 20 25 M2_AB 1. H igh 2. H igh 3. H igh 4. H igh 1.
Low 2.Low 3.Low 4.Low
5 10 15 20 25 30 M2_SM 1. H igh 2. H igh 3. H igh 4. H igh 1.
Low 2.Low 3.Low 4.Low
Therefore, the sum of the amplitudes of both peaks can be considered as a useful fault signature [37].
To prove its usefulness, Fig 10 shows the boxplot for the sum of the amplitudes of LSH and USH around the main harmonic for both motors and Table VIII shows a comparison of the ANOVA performed for LSH and for the sum of the amplitudes of both peaks. From these analyses, it can be inferred that for the tested motors both signatures are equally well suited, but, for higher inertia motors the sum should be the preferred fault signature.
Fig. 10. Boxplot of the sum of the amplitudes of the broken bar signature faults for LSH and USH of the first sideband for both motors, six different supplies and four condition states.
TABLEVIII
ANALYSIS OF VARIANCE. COMPARISON OF LSH VERSUS THE SUM OF THE AMPLITUDES OF THE PEAKS.
Res.Df RSS Df Sum of Sq
F P-value
Motors LSH
1263 61872 Condition
LSH
1260 23448 688.26 < 2.2e-16 Motors
LSH+USH
1263 230558 Condition
LSH+USH
1260 80765 778.97 < 2.2e-16 Signif. codes: 0 ‘***’ 0.001 ‘**’ 0.01 ‘*’ 0.05 ‘.’ 0.1 ‘ ’ 1
V. ADDITIVE MODELS
Additive models are a useful data analytic tool to estimate the effect of continuous variables in the response by using nonparametric regression techniques [38]. The estimation of the individual terms explains how the dependent variable changes with the corresponding independent variables and what variables do not have a significant impact in the response. Therefore, additive models can be seen as generalization of the multiple regression models which maintains the additive nature of the models, but it is allowed to replace simple linear terms as predictors by unspecified (non-parametric) function that can be estimated through “backfitting” algorithms.
Additive models have been fitted by using the R free software environment for statistical computing and the "gam" package available at the CRAN repository [39]. Here, the dependent variable is the amplitude of the peak, and the model establishes
this response variable as a sum of a common overall mean value μ plus the effects of the type of motor/supply Ti, the effect of
slip as a continuous function of the value taken by the slip denoted as s(slip) and the condition state Cjwhen j = 1, 2, 3 and 4
plus the sum of a random error term ε. That is
“LSH or USH” = μ + Ti + s(slip)+ Cj + ε
Twice-standard-error confident limits and bands have been also included for each considered effect in the additive models. Notice that this fitted model allows understanding whether we can detect differences among the condition state after controlling the differences in type of motor/supply or in the slip. Moreover, in future developments, these estimated effects can be taken into account and subtracted in order to achieve more accurate classifications in case of unknown condition state. These ideas can be considered as a first (promising) step in this direction.
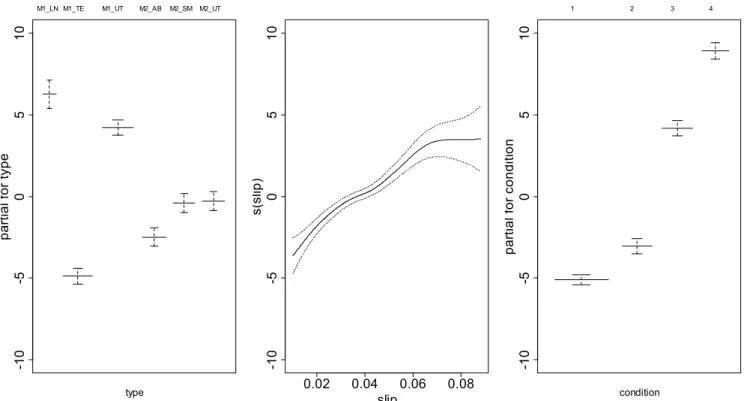
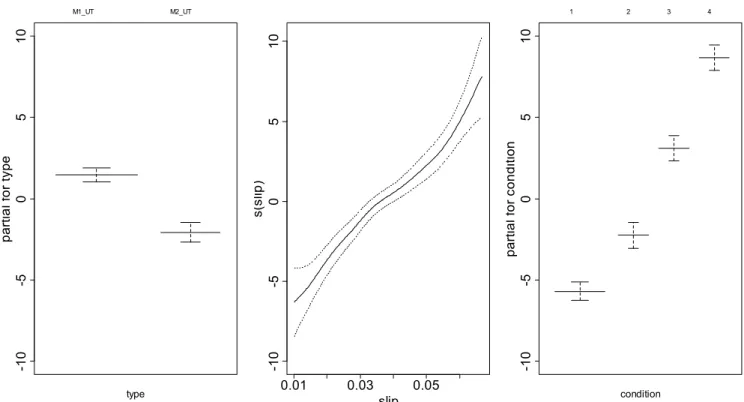
Figs. 11-12 show the additive models for LSH (Fig. 11) and USH (Fig. 12). Comparing both Figs. non-significant differences exist between both peaks. The model shows that the three variables are relevant, that is, they all should be taken into account when developing a condition monitoring expert system. As it was stated before, some supplies lead to similar results (LN with UT for M1, and SM with UT for M2) but, as a whole, the influence of the supply is relevant.
As it can be seen in the central part of Figs. 11 and 12, the model shows a quasi-linear dependence on the slip especially for slips between 2% and 6%.
1.
M
1
2.
M
1
3.
M
1
4.
M
1
1.
M
2
2.
M
2
3.
M
2
4.
M
2
20 40 60 80
Fig. 11. Additive model for the amplitude of LSH of the first sideband for both motors, six different supplies and four condition states.
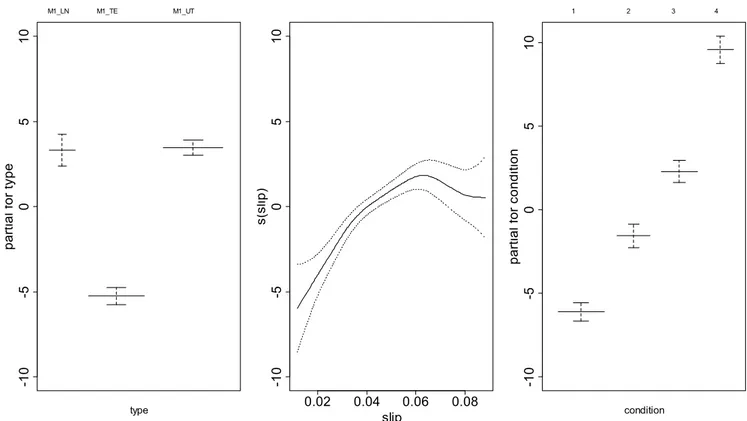
Fig. 12. Additive model for the amplitude of the USH of the first sideband for both motors, six different supplies and four condition states. Figs 13-14 show the additive models considering separately the data from each motor for USH (for LSH the models are very similar). It is remarkable that the influence of one of the supplies (TE) is clearly differentiated form the other ones.
-1
0
-5
0
5
1
0
pa
rti
a
l f
or
t
ype
type
M1_LN M1_TE M1_UT M2_AB M2_SM M2_UT
0.02 0.04 0.06 0.08
-1
0
-5
0
5
1
0
slip
s(
sli
p
)
-1
0
-5
0
5
1
0
pa
rti
a
l f
or
c
o
n
di
tion
condition
1 2 3 4
-1
0
-5
0
5
1
0
pa
rti
a
l f
or
t
ype
type
M1_LN M1_UT M2_AB M2_SM M2_UT
0.02 0.04 0.06 0.08
-1
0
-5
0
5
1
0
slip
s(
sli
p
)
-1
0
-5
0
5
1
0
pa
rti
a
l f
or
c
on
di
tion
condition
Fig. 13. Additive model for the amplitude of USH of the first sideband for motor 1.
Fig. 14. Additive model for the amplitude of USH of the first sideband for motor 2.
To be able to compare the results from both motors with the same supply, fig. 15 shows the additive models for motors 1 and 2 fed by utility supply. This model lets us observe that the four condition states are clearly distinguishable using USH and the influence of the kind of motor (denoted as type in the fig.) and the slip.
-1
0
-5
0
5
1
0
pa
rti
a
l f
or
t
ype
type
M1_LN M1_TE M1_UT
0.02 0.04 0.06 0.08
-1
0
-5
0
5
1
0
slip
s(
sli
p
)
-1
0
-5
0
5
1
0
pa
rti
a
l f
or
c
o
n
dit
ion
condition
1 2 3 4
-1
0
-5
0
5
1
0
pa
rti
a
l f
or
t
ype
type
M2_AB M2_SM M2_UT
0.01 0.02 0.03 0.04 0.05 0.06
-1
0
-5
0
5
1
0
slip
s(
sli
p
)
-1
0
-5
0
5
1
0
pa
rti
a
l f
or
c
o
n
dit
ion
condition
Fig. 15. Additive model for the amplitude of USH of the first sideband for motors 1 and 2 with utility supply.
VI. CONCLUSIONS
In this paper, it has been statistically analyzed the suitability of the fault signatures obtained from the stator current to diagnose rotor faults in induction motors A case study is presented where a rotor broken bar fault evolution has been tested and analyzed. The fault is obtained by progressively drilling a hole in one of the rotor bars of two induction motors of different power fed by different supplies (five supplies have been used, utility supply and four different power converters)and tested from low load to full load).
The results show the potential of the data to perform a condition monitoring task and the influence on the diagnosis of the (most influential aspects): motor (two motors of different rated powers have been tested), supply (five supplies have been used, utility supply and four different power converters) and load (the motors have been tested from low load to full load).
Motor Current Signature Analysis is a valid method in all the analyzed cases, but one of the results of this analysis is that the supply type has a significant impact on the detection of the fault and the subsequent diagnosis, which is especially difficult on the detection of the fault in an early stage. The statistical analysis has shown too that LSH of the first sideband is best suited to be used as a fault signature. Actually, in most of the cases both are equally valid, but, in the most challenging situations, the superior has proved to be more adequate.
VII. REFERENCES
[1] S. Günal, D.G. Ece, Ö.N. Gerek, Induction machine condition monitoring using notch-filtered motor current, Mechanical Systems and Signal Processing 23 (2008) 2658–2670.
[2] P.V. Jover Rodríguez, M. Negrea, A. Arkkio, A simplified scheme for induction motor condition monitoring, Mechanical Systems and Signal Processing 22 (2008) 1216-1236.
[3] Y. Lei, J. Lin, Z. He, M.J. Zuo, A review on empirical mode decomposition in fault diagnosis of rotating machinery, Mechanical Systems and Signal Processing 35 (2013) 108-126.
[4] M.R. Mehrjou, N. Mariun, M.H. Marhaban, N. Misron, Rotor fault condition monitoring techniques for squirrel-cage induction machine—A review, Mechanical Systems and Signal Processing 25 (2011) 2827-2848.
[5] E. Cabal-Yepez, M. Valtierra-Rodriguez, R.J. Romero-Troncoso, A. Garcia-Perez, R.A. Osornio-Rios, H. Miranda-Vidales, R. Alvarez-Salas, FPGA-based entropy neural processor for online detection of multiple combined faults on induction motors, Mechanical Systems and Signal Processing 30 (2012) 123-130.
[6] B.M. Ebrahimi, J. Faiz, S. Lotfi-fard, P. Pillay, Novel indices for broken rotor bars fault diagnosis in induction motors using wavelet transform, Mechanical Systems and Signal Processing 30 (2012) 131-145.
[7] Y. Lei, Z. He, Y. Zi, A new approach to intelligent fault diagnosis of rotating machinery, Expert Systems with Applications 35(2008) 1593–1600.
[8] L. A. García-Escudero, O. Duque-Perez, D. Morinigo-Sotelo and M. Perez-Alonso, Robust condition monitoring for early detection of broken rotor bars in induction motors, Expert Systems with Applications 38 (2011) 2653-2660.
-1
0
-5
0
5
1
0
pa
rti
a
l f
or
t
yp
e
type
M1_UT M2_UT
0.01 0.03 0.05
-1
0
-5
0
5
1
0
slip
s(
sli
p
)
-1
0
-5
0
5
1
0
pa
rti
a
l f
or
c
o
n
diti
on
condition
[9] M. E. H. Benbouzid, A review of induction motors signature analysis as a medium for faults detection, IEEE Trans. Ind. Electron. 47(2000) 984–993.
[10] M. Eltabach, J. Antoni, G. Shanina, S. Sieg-Zieba, X. Carniel, Broken rotor bars detection by a new non-invasive diagnostic procedure, Mechanical Systems and Signal Processing 23 (2009) 1398-1412.
[11] A.K.S. Jardine, D. Lin, D. Banjevic, A review on machinery diagnostics and prognostics implementing condition-based maintenance, Mechanical Systems and Signal Processing 20 (2006) 1483-1510.
[12] Y. Liu, L. Guo, Q. Wang, G. An, M. Guo, H. Lian, Application to induction motor faults diagnosis of the amplitude recovery method combined with FFT, Mechanical Systems and Signal Processing 24 (2010) 2961-2971.
[13] I. Daubechies, Ten Lectures on Wavelets, CBMS-NSF Regional Conference Series in Applied Mathematics, SIAM: Philadelphia, 1992.
[14] S.G. Mallat, A theory for multiresolution signal decomposition: the wavelet representation, IEEE Transactions on Pattern Analysis and Machine Intelligence 11(1989) 674-693.
[15] A. Bouzida, O. Touhami, R. Ibtiouen, A. Belouchrani, M. Fadel, and A. Rezzoug, Fault Diagnosis in Industrial Induction Machines Through Discrete Wavelet Transform, IEEE Trans. Ind. Electron. 58(2011) 4385–4395.
[16] Y. Feng F.S. Schlindwein, Normalized wavelet packets quantifiers for condition monitoring, Mechanical Systems and Signal Processing 23 (2009) 712-723.
[17] F. B. Alt, Multivariate Quality Control” in Encyclopedia of Statistical Sciences, S. Kotz and N.L. Johnson, Ed. Wiley and Sons, New York, 1985.
[18] L. A. Garcia-Escudero, O. Duque-Perez, D. Moriñigo-Sotelo and M. Perez-Alonso, Robust multivariate control charts for early detection of broken rotor bars in an induction motors fed by a voltage source inverter, in Proc. 2011 International Conference on Power Engineering, Energy and Electrical Drives.
[19] F. Briz, M. W. Degner, P. Garcia and A. B. Diez, High-frequency carrier-signal voltage selection for stator winding fault diagnosis in inverter-fed ac machines, IEEE Trans. Ind. Electron. 55(2008) 4181–4190.
[20] R. Wieser, C. Kral, F. Pirker and M. Schagginger, On-line rotor cage monitoring of inverter-fed induction machines by means of an improved method, IEEE Trans. Power Electronics 14(1999) 858-865.
[21] B. Akin, U. Orguner, H.A. Toliyat and M. Rayner, Low order PWM inverter harmonics contributions to the inverter-fed induction machine fault diagnosis, IEEE Trans. Ind. Electron. 55(2008) 610–619.
[22] G.R. Bossio, C.H.D. Angelo, G.O. Garcia, J.A. Solsona, M.I. Valla, Effects of rotor bar and end-ring faults over the signals of a position estimation strategy for induction motors, IEEE Trans. Ind. Appl. 41(2005) 1005–1012.
[23] M.F. Cabanas, F. Pedrayes, C.H. Rojas, M.G. Melero, J.G. Norniella, G.A. Orcajo, J.M. Cano, F. Nuño, D.R. Fuentes, A New Portable, Self-Powered, and Wireless Instrument for the Early Detection of Broken Rotor Bars in Induction Motors, IEEE Trans. Ind. Electron. 58 (2011) 4917-4929.
[24] C. Bruzzese, Analysis and Application of Particular Current Signatures (Symptoms) for Cage Monitoring in Nonsinusoidally Fed Motors With High Rejection to Drive Load, Inertia, and Frequency Variations, IEEE Trans. Ind. Electron. 55 (2008) 4137–4155.
[25] D. Morinigo-Sotelo, L. A. Garcia-Escudero, O. Duque-Perez, M. Perez-Alonso, Practical Aspects of Mixed Eccentricity Detection in PWM Voltage Source Inverter Fed Induction Motors, IEEE Trans. Ind. Electron. 57(2010) 252–262.
[26] I.P. Georgakopoulos, E.D. Mitronikas, A.N. Safacas, Detection of Induction Motor Faults in Inverter Drives Using Inverter Input Current Analysis, IEEE Trans. Ind. Electron. 58 (2011) 4365-4373.
[27] M. Akar, Detection of a static eccentricity fault in a closed loop driven induction motor by using the angular domain order tracking analysis method, Mechanical Systems and Signal Processing 34 (2013) 173-182.
[28] A. Bellini, F. Filippetti, C. Tassoni, G.A. Capolino, Advances in diagnostic techniques for induction machines, IEEE Trans. Ind. Electron. 55(2008) 4109–4126.
[29] B. Payne, A. Ball, F. Gu, Detection and diagnosis of induction motor faults using statistical measures”, in Proc. 2002 International Journal of COMADEM, 5(2002) 5–19.
[30] W. T. Thomson, M. Fenger, Industrial application of current signature analysis to diagnose faults in 3-phase squirrel cage induction motors, in Digests 2000 Pulp and paper industry technical conference, pp. 205–211.
[31] W. T. Thomson, D. Rankin, Case histories of rotor winding fault diagnosis in induction motors, in Digests 2000 2nd international conference on conditioning monitoring, 2000.
[32] F Filippetti, G Franceschini, C Tassoni, P Vas, Impact of speed ripple on rotor fault diagnosis of induction machines, in Proc. 1994 International Conference of Electric Machines and Drives pp 452-456.
[33] O. Duque-Perez, D. Morinigo-Sotelo, A. Rodriguez, L. A. Garcia-Escudero, M. Perez-Alonso, Experimental identification of induction motor broken bar characteristic frequencies using a programmable power source, in Proc. 2010 19th international conference on electrical machines.
[34] S.R.H. Amrei, X. Dian, A new study on harmonics and interharmonics reduction with frequency selective closed-loop control in VSI inverters, Vehicle Power and Propulsion Conference, 2008. VPPC '08. 1-6.
[35] J.H. Jung; J.J. Lee, B.H. Kwon, Online Diagnosis of Induction Motors Using MCSA, IEEE Trans. on Industrial Electronics 53(2006) 1842-1852.
[36] A. Yazidi, H. Henao, G.A. Capolino, F. Betin, and F. Filippetti, A Web-Based Remote Laboratory for Monitoring and Diagnosis of AC Electrical Machines, IEEE Trans. Ind. Electron. 58(2011) 4950–4959.
[37] F. Filippetti, G. Franceschini, C. Tassoni, P. Vas, AI techniques in induction machines diagnosis including the speed ripple effect, IEEE Trans. Ind. Appl. 34(1998) 98–108.