POWER QUALITY IN THE ARGENTINE COMPETITIVE MARKET. FIVE YEARS OF CONTROL EXPERIENCE
.
Pedro
Issour
ibehere
Jorge
Mart
inez
C
laud
io
Gu
id
i
/
Jorge
Garc
ía
IITREE. Universidad Nacional de La
Plata Ente NacionaElecltr Reguicidadlador dela Hagler S Ba.Ailly Calle 48 y 116. (1900). La Plata
Argentina Av. Madero 1020Argen.t Buenosina Aires. Cerrito 866 PArgeniso 6t.ina Buenos Aires. (54221) 483-6640
E-mail:iitree@volta.ing.unlp.edu.ar E-mail: d(5411)istrcom@enre 314-5640.gov.ar E-ma(5411)il: cg@hb 4813ix 9898.com.ar
In this document we show the main advances in Quality Service control, provided by the Distribution companies which supply power for the city of Buenos Aires and its surroundings, involving approximately 5 million customers. We have particularly addressed aspects related to the Technical Product (i.e. voltage level and .distortions) and to the Technical Service (i.e. frequency and duration of interruptions). Controls started in September 1993, one year after the first privatizations were made, by means of performance global indicators of companies, to change, since 1996, into idividual indicatorsfor each customer. We could mentionthat, as a consequence of controls and penaltiesimposed,the companies haveimprovedthe service qualitylevel,thus evidencingtheir responsetothe clear economic signalsthey received. They have hadto makeinvestments, not onlyinthosefacilities directly affectedtothe service supply, but alsointhe management tools which allowedthemto acknowledgethe situation andtakethe necessary correction measures
TECHNICAL PRODUCT. VOLTAGE LEVEL
Since 1992, with the privatization of the three distribution companies which supplied energy for the Great Buenos Aires to more than five million customers, the Ente Nacional Regulador dela Electricidad (ENRE) (Regulatory Agency) has controled the Technical Product supplied by the companies, the latter were in charge of developing the metering campaign. Metering consistin a 7-day register of efficient voltage values separated in 15-minute periods. Until 1996 only voltagelevel was controled, and morethan 22.000 measurements were performed on customers and connection terminals at the Medium / Low Voltage Subestation. Deviations from admissible levels were punished, according to their size, by the Regulation Authority, with economic penaltiesthat returnedto affected customersinthe form of a discount fromthe amount billed for atotal of M.US$.1.7. This acted as an economic signal, forthe companiesto solve existing problems. In September 1996, a new control stage started, aimed at establising the quality ofthe service supplied to each customer, which was also extended to distortions. From then on 670 measurements per month were made only of customers. First years’ results registered within the new control scheme evidenced an improvement in Service Quality, though notthe complete solution ofthe problem. Fromthe analysis performed, we concluded that economic signals sent to the companies by the fines imposed had been adequate to solve the most severe problems, but that they areinsufficient forthe overall solution ofthe problem; and a study is being conducted for a probable modification of
present regulations. This experience has been used for the development of quality requirement rules for other Argentine companieslater privatized, as well as for quality considerations made by other countries like Venezuela, Guatemala and Costa Rica. Taking advantage ofthe great number of measurements performed, a statistical control method was designed which separates quality supplied in various areas. It considers the 15-minute registers performed along a year as a whole, by taking 6-month periods, withthe new semester replacingthe previous one, and separating them according to frequency of occurrence as a percentage of their deviation with respect to the voltage nominal value. In this way, each area reveals an occurrence frequency curve that indicates the quality supplied at the area; in relation to which a penalty mechanism has been developed to ensure that the companies receive the correct signals to allow for the solution of the previously mentioned problems. The formulas utilized arethe following:
TOT B B
Nrg Nrg FEB
TOT p B B
NrgP NrgP FEBP
) (
T TotMed
med
med B
B
Eng Eng FEEC
1) (
BP
B B B B
FEBP C
FEEC ETF
FINE
Where:
FEBB: Equivalent Frequency associatedto Band B.
FEBPB: Equivalent Frequency for penlized Band B.
FEECB: Equivalent Frequency for Consumed Energy
separated by Band B
NrgB: Number of Valid Registers associated to Band
B.
NrgTOT , NrgPT: Total Number of Total and Penalized
Registers.
NrgPB(p): Number of Penalized Registers associated with
Band B.
EngB(med): Power Registered while metering associated
with Band B.
TotMed:Number of Measurements made during the period monitored.
ETF:Total Power Billed by the Distribution companies duringthe period monitored.
CB: Penalization Ratio, related to Medium Voltage
levels.
If, at the end of the monitored period of time, the sum of FEBB forthe penalized voltage bands (FRp)is higherthan
3%,thenthe Distributor shall be penalized accordingtothe above described equations.
In ordertotest whetherthe method developed was usefulto achieve the goals, a test was made with the information available from 12.000 one-week measurements from the three companies controled since 1996.
Results obtained allowed them to confirm that goals had been achieved, as regards the possibility of identifying the areas where there are problems and of sending the correct economic signalsin orderthatthey placeincentives onthe companies sothatthey designthe solutions.
The amounts of the penalties (US$) resulting from this method are summed upinthe following Tables:
Area Semester-1 Semester-2 FRp Penalty (US$) FRp Penalty US$)
1 6,7% 268.565 3,1% 59.594 2 1,2% 0 0,6% 0 3 7,1% 559.785 5,6% 168.764 In the graphics enclosed, we show the curves obtained for one ofthe companiesinthreetypical areas fortwo different semesters. We were able to verify, for each area, a similar behaviourinthe period oftime considered.
Figure 1
0% 5% 10% 15% 20%
-20% -10% 0% 10% 20%
( Um- Un)/ Un
1
2 3
Figure 2
0% 5% 10% 15% 20%
-20% -10% 0% 10% 20%
(Um - Un )/ Un
1
2
3
TECHNICAL PRODUCT. DISTORTIONS
Figure 3
0.0 0.5 1.0 1.5 2.0 2.5 3.0 3.5 4.0
T
H
D [
%]
ThrusdayFriday Saturday Sunday Monday Tuesday W ednesday
Analysis will be commenced by making an histogram and the accumulated distribution curve of TDT overthetotality of 15-minute registers available. These graphics are shown in Figure 4.
Figure 4
0 5 10 15 20 25
0.5 1.5 2.5 3.5 4.5 5.5 6.5 7.5 8.5
THD[%]
Fr
eq
ue
nc
y [
%]
0.01 0.1 1 10 100
F
D
A [
%]
The mean value ofthe million registersis 2,31 andthe P95
(value not exceeded by 95% of registers) 4,31, which is withinthe range of halfthe value of TDT admitted of 8in BT [Low Voltage].
Less than 0,1% registers exceed the value TDT=8. (This percentage is not completely representative of the number of places in which there would be an infringement of harmonics, since, attimes,itis a particular harmonic – not registered in this campaign – the one that exceeds the permitted value, and not TDT). In figures 3 and 4 the graphics shown are similar to the previous ones, though they consider each of the 1470 meterings individually. In Figure 5, each measurementis representedd bythe average of allits registers, consideringthe set of one-week registers as the mean value of each measurement, thus the mean value ofthe whole ofthe measurementsis 2,31 and as P95,
3,6. No measurement exceeds TDT=8 value. Figure 5
0 5 10 15 20 25
0.5 1.5 2.5 3.5 4.5 5.5 6.5 7.5 8.5
THD [%]
Fr
eq
ue
nc
y [
%]
0.01 0.1 1 10 100
F
D
A [
%]
Figure 6
0 5 10 15 20 25 30
0.5 1.5 2.5 3.5 4.5 5.5 6.5 7.5
THD [%]
Fr
eq
ue
nc
y [
%]
0.01 0.1 1 10 100
F
D
A [
%]
On the contrary, in Figure 6, each metering is represented by the P95 of the total of its registers, mean value being
3,67 and as P95, 5,6. Of all the measurements, 0,32%
exceedsthe TDT=8 value.
For the second type of the analysis, the information was processed in way so as to obtain a TDT profile along the day. In order to do this, we took the whole registers and grouped them by hour, thus getting 24 subgroups of approximately one million/24 registers. The result of the foregoing is shown in Figure 7, where we can see two curves, one of them considers the average value of the registers of each subgroupthat represent a certain hour, and the othertakesthe P95 value.
Figure 7
1 2 3 4 5 6
0 2 4 6 8 10 12 14 16 18 20 22
Hour
T
H
D [
%]
Prom. P95
When observing these graphics, it is apparent that there is animportant variationinthe TDT alongthe day, andthatit would be in direct relation with the systems load. This means that TDT’s lowest values appear at dawn and the highest are dividedinto two peaks,thelowest at noon and the highestinthe evening. From Figure 7 on we can see a considerable correlation between the graphics which show the average andthe P95 value of TDT. In Figure 8thex axis
represents the average and y axis the P95 for each hour,
[image:3.595.311.538.74.192.2] [image:3.595.310.535.392.517.2] [image:3.595.59.283.647.753.2]Figure 8
0 1 2 3 4 5 6
0 0.5 1 1.5 2 2.5 3 3.5
P9
5
Another analysis made consisted in observing TDT’s profile along the year, for which we grouped all the registers by month. Results obtained are shownin Figure 9, for which, again, we usedthecriteria ofthe mean value and P95 within each month. As can be seen, there is not a
deterministic variation alongthe year,though we can have slightly higher values during the coldest months. For the flicker register, we had 1025 measurements, and the result is a series of values which can be considered, in certain area ofthe metering range, proportionalto PST.
Figure 9
1.5 2 2.5 3 3.5 4 4.5 5
T
H
D [
%] Prom.
P95
December August
May January
These are whole numbers and, in most practical cases, are between 0 and 6,thisisthe reason whythe equipment has poor resolution; however, it is adequate for the purpose of the control proposed. In order to correlate the values measured by these low-performance equipment with PST values, we made a test by provoking a 8.8 Hz sinusoidal flicker, andthe valuesthus generated were comparedtothe Metered Flicker (FM) in order to obtain a conversion factor.
To demonstrate the foregoing, Figure 10 shows a flicker metering at a particular point of the campaign. As a comparison, the graphic has two axis of ordinate, one in FM units and the other in PST. The same was done with the rest ofthe Figures.
Figure 10
0 1 2 3 4 5 6
Date
F
M
0 0.29 0.48 0.86 1 1.14
P
S
T
Tue Wed Thr Fri Sat S un Mon Tue
The procedure utilized forthe analysis of the flicker results is complete, the same as the one used for the harmonics. The only exception to take into account is that, due to the low resolution of the equipment, the calculated P95 values
are only indicative. In Figure 11, the histogram and the accumulated distribution curve of FM for all registers is shown. The mean value of the sample is 0,52 and P95, 2.
Of all registers, 0,8% exceeds the FM=5 value, which is approximately 1 in the PST scale (maximum value admissible for this parameter in BT [Low Voltage] pursuantto Res..ENRE 465/96).
Figure 11
0 10 20 30 40 50 60 70
0 1 2 3 4 5 6 7 8
FM
Fr
eq
ue
nc
y [
%]
0.01 0.1 1 10 100
F
D
A [
%]
0 0.29 0.48 0.67 0.86 1 1.14 1.28 1.42
(PST)
Figures 12 y 13 show graphics similartothe foregoing but which take each of the 1025 measurements individually. Figure 12 represents each measurement by the average of all its registers, mean value being 0,52 and P95, 1,6. Of all
measurements, 0,1% exceeds FM=5 value. In Figure 13 each meteringis represented bythe P95 of allits registers,
resultingin a mean value of 1,7 andin a P95 of 3,9. A 4,4%
exceedthe maximum value permitted. Figure 12
0 10 20 30 40 50 60
0 0.5 1 1.5 2 2.5 3 3.5 4 4.5 5 5.5 FM
Fr
eq
ue
nc
y [
%]
0.01 0.1 1 10 100
F
D
A [
%]
0 0.29 0.48 0.67 0.86 1
[image:4.595.62.285.76.214.2] [image:4.595.311.539.368.494.2]Figure 13
0 10 20 30 40 50 60
0 1 2 3 4 5 6 7 8 9 10 11 12 13 FM
Fr
eq
ue
nc
y [
%]
0.01 0.1 1 10 100
F
D
A [
%]
0 0.29 0.48 0.67 0.86 1 1.14 1.28 1.42 1.56 1.7 1.851.99 (PST)
As with harmonics, Figure 14 representstheflicker along a typical day, taking into account the average and the P95 fo
registers present in an hour. It is apparent that the highest FM values appear approximately between 6 a.m. and 8 p.m., whilethey stay belowthis level duringthe rest ofthe day.
Figure 14
0 0.5 1 1.5 2 2.5 3
0 2 4 6 8 10 12 14 16 18 20 22 Hour
F
M
Prom. P95"
0.29
0.48
0.67
0
P
S
T
In Figure 15 we make a similar analysis but alongthe year; noticingthat, asin TDT,thereislittle relation between FM andthetime ofthe year; we can see values slightlylower duringthe coldest months ofthe year.
Figure 15
0 0.5 1 1.5 2 2.5
Month
F
M
Prom. P95"
0 0.29 0.48
P
S
T
TECHNICAL SERVICE
This issue refers to the degree and duration of the interruptions that affect customers. In September 1993 controls were put into place to monitor Quality of the service by means of global indicators of the Average Interruption Frequency and Interruption Total Time. As a consequence of the companies’ failure to comply with admitted limits, penalties were imposed wich returned to
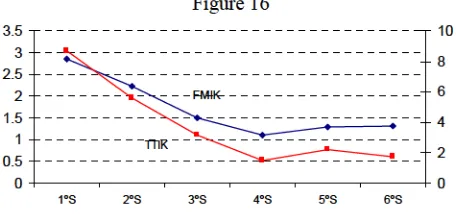
customersin proportiontothe power consumed by each of them, which amountedto M. US$13,7inthree years. In Figure 16the FMIK (Frecuencia Media de Interrupción por kVA) [Average Interruption Frequency by kVA] and TTIK (Tiempo Medio Total de Interrupción por kVA) [Average Total Interruption Time by kVA] evolution for one of the companies monitored is shown. There appears animprovement of said measures alongthetimein respons tothe economic signals received viathe finesimposed. FMIK (Frecuencia Media de Interrupción por kVA) [Average Interruption Frequency by kVA]
TTIK (Tiempo Medio de Interrupción por kVA) [Average Total Interruption Time by kVA]
Figure 16
0
0.5
1
1.5
2
2.5
3
3.5
1ºS 2ºS 3ºS 4ºS 5ºS 6ºS 0 2 4 6 8 10
FMIK
TTIK
Later,in September 1996, control ofinterruptions affecting each customer individually begun. For the sake of this, distribution companies hadto make a careful survey ofthe relation customer-net, develop complex computer systems andincorporate new managementtechniquestothe net, so as to accurately identify the affected customer during an interruptionin any part ofthe net. If, duringthe monitored semester, a customer suffers more interruptions (longer than 3 minutes) than established, and/or lacks service supply during more than the permitted time, he should receive from the distribution company, a credit in his invoices forthe semesterin question.
The limits for interruptions, over which the Power Not Supplied will be determined, depend on the Type of Customer and arethe following:
Type of Customer Frequency per
Semester DuraInterruption pertion High Voltage 3 2 Medium Voltage 4 3 Low Voltage/ 50 kW 6 6 Low Voltage/ < 50 kW 6 10
Power not supplied (not received by the customer) is calculated as follows:
600 . 525
Ki EA )
[image:5.595.59.285.74.192.2] [image:5.595.309.537.283.390.2] [image:5.595.54.284.509.650.2]Where:
: Sum of i minutes of customer’slack of service over the pre-establishedlimits.EA: Total energyinvoicedtothe customer duringthelast twelve months.
Ki: Factor representing the charge curves of each rate category.
Finally, the power not supplied is valued according to the rate category of each customer, varying between 1.40 US$/kWh and 2.71 US$/kWh.
Thetotal amount of discountsto customers duringthe first semester is around U$S 2 million, for one of the Distribution companies monitored.
If we analyze the information obtained during this stage, we can see that the Service Quality, as perceived by the customers, differ considerably from one Area to another, even among different areas of the same Distribution company. From this we can infer that it would pose limitations and produce distortions for the regulation authority to send economic signals if global indicators are kept forthe whole company. As an example,the following Firgure shows the percentage of customers affected, with respect to the number of interruptions of three areas of a Distribution company. Where the percentage of customers is a proportion ofthetotal customers of each area analized, thus allowingthier comparison
Figure 18
0% 5% 10% 15% 20% 25% 30%
0 2 4 6 8 10 12 14
[
%
Co
st
o
me
r]
If we analyzethe whole universe of customers who haveto receive discounts (excluding those who receive service quality within the admitted limits) from the Distribution companies dueto poor service quality, we can seethatthe amounts to be discounted are distributed proportionally to the requirement level established for each customer affected and to the annual power invoiced. The following Table shows how affected customers and amounts of discount are distributed per Small Demand (SD), Medium Demand (MD) and Large Demand (LD) within a Distribution company.
% of Customers % Discount SD 98.5 % 25 % MD 1.0 % 5 %
LD 0.5 % 70 %
Considering all interruptions longer than three minutes occurred duringthe first semester ofthe monitored period, we have calculated the following management indicators.: SAIFI (Frecuencia Media de interrupción en el Sistema) [System Average Interruption Frequency Index] and CAIDI (Duración media de Interrupción por Usuario) [Customer Average Interruption Duration Index], for the two Distribution companies with the greatest number of customers in Great Buenos Aires. The following table showsthe values obtained:
CAIDI SAIFI 108 minutes 2.9
90 minutes 5.6
[image:6.595.323.531.69.126.2] [image:6.595.55.283.431.556.2]