A Framework for Semantic Analysis of
Histopathological Images Using Nonnegative Matrix
Factorization
First Author, Second Author, Third Author
Abstract—This paper presents a novel and general framework for histopathology image analysis using nonnegative matrix factorization. The proposed method uses a collection-based image representation called Bag of Features (BOF) to represents the visual information of a histopathology image collection. Con-vex Nonnegative Matrix Factorization (CNMF) is applied to a training set of images to find a compact representation in a latent topic space. The latent representation has two important characteristics: first, CNMF is able to find representative clusters of images in the collection, second, clusters are represented by convex linear combinations of images in the training set. This latent representation is exploited in different ways by the proposed framework: concept labels can be assigned to clusters using the labels of the constituting images, representative images and visual words can be identified for each cluster, and new unlabeled images can be labeled by mapping them to the latent space. The proposed annotation model has an interesting property, it is easily interpretable since it is possible to trace those visual words present in the image which contribute the most to a given annotation. This implies that annotations in an image may be explained by identifying the regions that contributed to them. An exploratory experimentation was performed in a histopathology dataset used to diagnose a type of skin cancer called basal cell carcinoma. The preliminary results show that the combination of BOF and NMF is an interesting alternative for biomedical image collection analysis with a high level of interpretability.
Index Terms—Histopathology images, Image Analysis, Bag of Features, Nonnegative Matrix Factorization
I. INTRODUCTION
Histopathology is a fundamental area in medicine that is the support for diagnosis, prognosis and theragnosis of several diseases like cancer. It consists in the study of the disease manifestations by examining thin tissue sections at microscopy level. At this level the structure, function and cell organization in normal and abnormal organs can be observed as variations of visual characteristics such as color and texture, which are usually highlighted with the help of different types of stains (e.g. Hematoxylin-eosin). basal cell carcinoma is a type of skin cancer, which is the most common skin disease in white populations and its incidence is growing worldwide [10]. Pathologists confirm whether or not this disease is present after a biopsied tissue is evaluated under microscope. In this evaluation, physicians aim to recognize some characteristic patterns or complex mixes of patterns. In general the diagnosis is defined by the presence of one or more of this patterns in the image. Automatic or semiautomatic tools for histopathology image analysis are an important asset to support diagnosis,
clinical practice and research. However, this is a challenging task since this kind of images exhibit a complex structure due to the complex arrangement of cells, tissues and organs. Additionally, all images are acquired from thin tissue sections of a biological sample which are subjected to different fac-tors that affect their visual appearance such as type of cut, magnification level, and stain.
This paper proposes a method for analysing the visual and semantic content of an histopathology image collection, overcoming some of the challenges mentioned above. The method performs the analysis at three different levels: first, it is able to automatically annotate previously unseen, non-annotated images; second, it is able to localize particular regions inside the image that correspond to a given semantic concept; and third, it is able to find groups of images that are visually and semantically related.
A good representation of the image visual content is fun-damental to fulfill the method goals. In this paper we propose to use BOF image representation for histopathology images. This strategy has been previously used in medical image applications, mainly, high level interpretation of radiology images. Bosch et al. [1] and Iakovidis et al. [14] used a BOF approach to deal with mammography images and x-ray images respectively. Tommasi et al. [21] and Avni et al. [2] have adapted BOF models to more general medical image collections, with different modalities, body parts and pathologies.
success-representation is exploited in different ways by the proposed framework: concept labels can be assigned to clusters using the labels of the constituting images, representative images and visual words can be identified for each cluster, and new unlabeled images can be labeled by mapping them to the latent space. The proposed annotation model has an interesting property, it is easily interpretable since it is possible to trace those visual words present in the image which contribute the most to a given annotation. This implies that annotations in an image may be explained by identifying the regions that contributed to them. An exploratory experimentation was performed in a histopathology dataset used to diagnose a type of skin cancer called basal cell carcinoma. The preliminary results show that the combination of BOF and NMF is an interesting alternative for biomedical image collection analysis with a high level of interpretability.
The paper is organized as follow. Section II describes the proposed method using a collection-based image representa-tion and nonnegative matrix factorizarepresenta-tion. Secrepresenta-tion III describe a histopathology dataset with images of basal cell carcinoma which is used in this paper to evaluate the performance of the proposed method. Section IV presents the experimental eval-uation and results obtained to find semantic groups of images, automatic annotation and semantic segmentation. Finally the conclusions and future work are described in Section V.
II. SEMANTICANALYSISMETHODFORIMAGE
COLLECTION
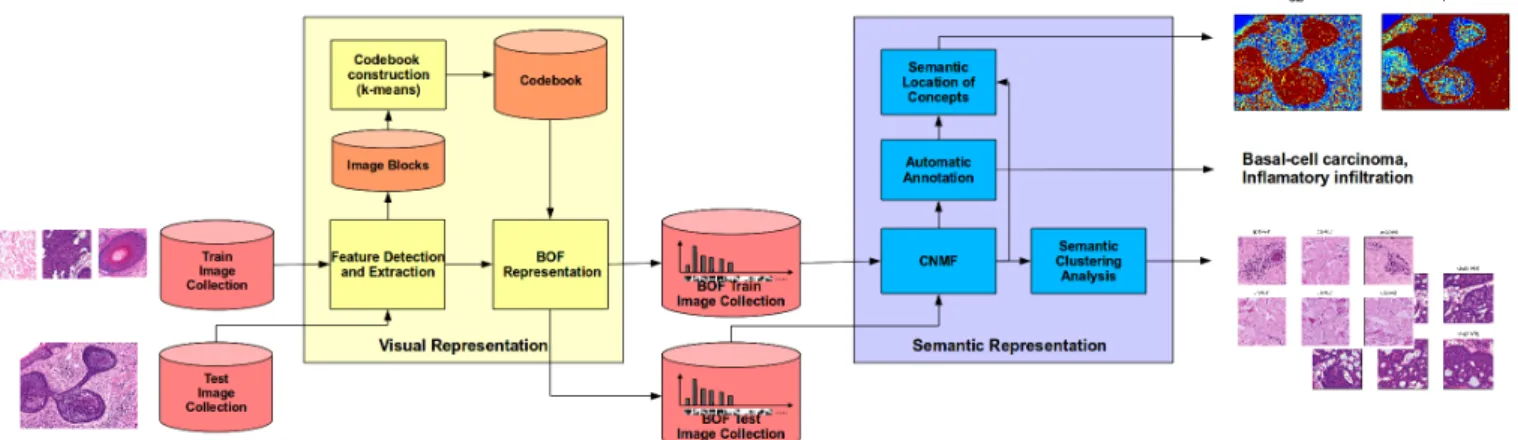
A general overview of the proposed approach for semantic analysis of histopathology image collections is illustrated in the Figure 1. A first stage of this approach consists into representing the visual information as a Bag of Features (BOF) [17]. In the second stage, CNMF is used for decomposing the matrix that represents the image collection into two matrices: the first matrix represents the clusters of latent semantic concepts, and the second the membership values of images in that latent space. This factorization is then used for performing the three semantic analysis levels provided by this approach. The first one, called automatic semantic annotation, allows to predict the biological concepts present in a given image. The second one, semantic image analysis, allows to visualize the regions related by each semantic concept in the image. Finally, the third called semantic image collection analysis, allows to find groups of images that share semantic biological concepts. The following Subsections describe each step of the proposed framework.
of three stages [7] as follows: (i) Feature detection and description, (ii) codebook or visual vocabulary construction, and (iii) BOF image representation.
1) Feature Detection and Description: In this stage the small regions that will be used for describing the whole visual content of the images are selected and described. Several approaches have been proposed for extracting relevant small regions, including the use of multiscale keypoint detectors (Laplacian of Gaussian, Harris-affine, Scale Invariant Points, etc.) and many dense sampling strategies (regular grids, ran-dom sampling, etc.).In the present work we used a regular partition of the image, i.e. patches of 8 ×8 pixels. This strategy is more systematic than keypoint detectors such as SIFT points, and have been shown to produce better results [5], [6]. On the other hand, similarly to [6], [9], we used the Discrete Cosine Transform (DCT) coefficients of each of the RGB channels, concatenated into a single feature vector, for describing each local patch. The DCT coefficients allow to describe the distribution of colors in the patch, an information that is fundamental for the analysis of histopathology images, in which the stain procedures highlight the color characteristics of the biological tissue components. Then, each8×8 block is described by a feature vector of192dimensions, with each color component represented by the first64coefficients of the DCT.
2) Codebook construction: Once the sets of feature vectors that represent overall patches in the training set are generated, these are projected in a feature space, which is partitioned in k clusters using the conventional k-means algorithm [11]. Hence, a visual vocabulary or codebook is generated with each cluster-centroid representing a visual word in the vocabulary, so the vocabulary size is defined by the number of clusters k. In this work the codebook size was set to 400, a value that captures sufficiently the visual pattern variability in a compact representation with good performance [6].
3) BOF image representation: As was previously men-tioned, the BOF representation, describes each image as a k-bin histogram of the frequency of each visual word present in the image. This is accomplished by associating the feature vector, describing each patch extracted from the regular grid partition, to the closest visual word in the vocabulary. Then, the histogram is generated with each bin storing the number of blocks in the image assigned to the corresponding visual word. Finally, a normalization step is applied dividing each value by theL2norm of the histogram, to support image size
Fig. 1. Overall framework for histopathology image collection analysis using NMF.
B. Nonnegative Matrix Factorization
Non-negative Matrix Factorization (NMF) is a well known decomposition approach that approximates a matrix X as a product of two simpler non-negative matrix factorsW andH as follows:
Xn×m=Wn×rHr×m (1)
with W containing a set of k < n basis vectors that are linearly combined to represent the data in X using the coefficients in H.
Several variations and improvements to NMF have been introduced in recent years. In this work, we applied the Convex-NMF (CNMF) recently introduced by Ding et. al [8], which restrict the columns ofW to be convex combinations of the data points, i.e. case in which, the columns of W capture a notion of “centroid clusters”.
Xn×m=Xn×mWm×rHr×m (2)
Solution to NMF involves iterative optimization techniques that require optimizing a cost function that describes the “closeness” ofW H toX. According to [15], two cost func-tions can be used for solving the equation 1 i.e. the Euclidean distance and the Kullback Leibler divergence. In this work we choose the first objective function which is defined as follow:
D(X, AB) =kX−ABk
s.a. A, B≥0
C. Semantic Clustering Analysis
In order to find groups of images with similar semantic concepts, we define the matrix D, which relates visual words and clusters of latent space as follows:
Dn×r=Xn×mWm×r
CNMF yields an interesting understanding of the data because the r columns in the D matrix of the Equation 2 could be interpreted as clusters centroids defined by the linear combination of example images represented in X. Addition-ally,H is the representation of each image in the latent space
of r dimensions, where each column can be interpreted as cluster-membership values for a given image.
D. Semantic Annotation
For automatic annotation we need to assign labels to each cluster. This is done by taking into account the labels in the training image dataset. Let’s defineLmatrix withcrows and mcolumns, where each row corresponds to concepts, and the columns corresponds to images. In this way for any column of Lwe have one (1) in the row related with the concept present in the corresponding image and zero (0) in the other rows. According to this we defineDL as follows:
DL
c×r=Lc×mWm×r
TheDL matrix relates concepts and cluster centroids. Each column indicates the degree of relationship between a cluster and the different concepts.
A new imageXtis projected to the latent space solving the following equation:
Xt=DHt
In this case we fixedD. Then, the labels are obtained using:
Lt=DLHt
Where Lt is a vector of memberships degrees for each concept. The final labels assigned to the images correspond to those concepts with a membership value greater than a threshold, in this work the threshold was fixed to0.5.
E. Semantic Location of Concepts
The proposed method was evaluated on a histopathology image dataset that was annotated by an expert identifying the presence of both normal and abnormal biological structures inside each image. This images have been previously used in an unrelated clinical study to diagnose a special skin cancer known as basal cell carcinoma. basal cell carcinoma is the most common skin disease in white populations and its incidence is growing worldwide [10]. Diagnosis of this disease is always performed by the observation of a biopsied tissue under microscope, case in which the abnormal tissues are recognized by the presence or absence of some charac-teristic visual patterns. This patterns describe small biological structures that exhibit high variability, which is caused not only by the presence of pathological tissues associated with a skin cancer, but also by the tissue preparation and image acquisition processes.
The overall image collection was split in three set of images, 775 (train), 691(validation) and 138 (test). The train and validation image sets were subimages of 300×300 pixels, annotated as containing only one of the10concepts present in the collection, whereas test image set was composed of larger images around of1024×768pixels, which could be annotated with more than one of those concepts. In the later case, i.e. test set, images were annotated as containing or not each biological concept, however no location of the actual concepts was defined, which make the task of automatic annotation even more challenging. The Figure 2 shows a image samples for each image set . Tabla I shows the images distribution for each concept for train, validation and test sets.
Fig. 2. Example images of train, validation and test images with their annotations.
IV. EXPERIMENTALEVALUATION
First the BOF representation was obtained using the methodology described in Subsection II-A. Then, the experi-mental evaluation was performed in four stages as follows: (i) automatic annotation, (ii) semantic concept location and (iii) clustering analysis.
A. Automatic Annotation Performance
Automatic annotation performance was evaluated applying the method described in the subsection II-D. The Average Accuracy (AA) measure among the concepts was initially evaluated on the validation image dataset, when the model was trained using the training image dataset. Figure 3 shows the Average Accuracy among classes for number of dimension in the latent space (r) varying between10and400. The red dot corresponds to r set to260. This point provide a good trade off between performance (AA) and r values, by which was selected for the performance evaluation in the test dataset. The confusion matrix reported using this value of r is presented in Figure 4. Note that best performances were reported to pathological concepts i.e. nodular basal cell carcinoma (cb) and micro-nodular basal cell carcinoma (cbn).
Fig. 3. Latent space dimension (r) against average accuracy (AA).
Fig. 4. Confusion matrix forr= 260withAA= 0.53(train-validation stage).
concepts, except to the micro-nodular basal cell carcinoma, case in which images were annotated as nodular basal cell carcinoma, this can be explained because these concepts are similar and delimitation between them usually is subjective could be not clear. Other pathological concept that report a low sensitivity i.e. recall performance was the inflammatory infiltration, which was mainly confused withcollagen.
TABLE II
AUTOMATIC ANNOTATION PERFORMANCE BY CLASSr= 260.
Class Acc Pr Rc
Collagen (c) 0.77 0.88 0.63 Sebaceous glands (gs) 0.78 0.57 0.58 Hair follicles (ap) 0.75 0.48 0.67 Inflammatory infiltration (i) 0.53 0.74 0.43 Ecrine glands (ge) 0.76 0.31 0.41 Epidermis (ep) 0.88 0.9 0.67 Nodular Basal cell carcinoma (cb) 0.91 0.8 0.84 Morpheiform basal cell carcinoma (cbm) 0.9 0.5 0.93 Micro-nodular basal cell carcinoma (cbn) 0.9 0.31 0.44 Cystic basal cell carcinoma (cbq) 0.82 0.26 1
Average 0.80 0.57 0.66
In order to illustrate the results reported in this stage, Figure 5 shows a sample image from the test image set, which was visually annotated by the expert as containing nodular basal cell carcinoma, epidermis and inflammatory infiltration, whilst automatic annotation assigns the labels nodular basal cell carcinoma and inflammatory infiltration.
Manual annotation: Nodular basal cell carcinoma,Epidermis, inflammatory infiltration
Automatic annotation: Nodular basal cell carcinoma, inflammatory infiltration
Fig. 5. Test image example comparing the real vs automatic annotations.
B. Relevant Regions by Concept
In the sample above (see Figure 5), annotation of one or more labels assign to to the image was performed. However, one important thing is know the spatial location of the concepts in the image. This semantic analysis described in Subsection II-E, take advantage of the part-based representation to localize in the image the relevance value of each block given a particular concept.
Hence, the method gives a relevant map by concept over each image in the test dataset. The relevance values are obtained from the values between visual words and concepts ( from C matrix) weighted by image membership with each concept (fromLtmatrix). Figure 6 shows the relevance maps for each concept on the image above. Red colors represent high relevance values whereas blue colors represent low values. In this case, the relevance maps associated to inflammatory infiltration and nodular basal cell carcinoma allow to identify the specific location of the concepts in the image. Additionally, micronodular basal cell carcinoma is confuse with nodular basal cell carcinoma, which also is other kind of pathological concept basal cell carcinoma.
Fig. 6. Relevant regions of an example image according to each semantic concept.
C. Finding Semantic Clusters
Fig. 7. Two clusters found for different types of basal cell carcinoma,nodular basal cell carcinoma(top) andcystic basal cell carcinoma(bottom), with their representative images.
V. CONCLUSION ANDFUTUREWORK
The proposed framework is a promissory alternative for automatic annotation, and semantic analysis of biomedical image collections to identify semantic patterns in images and image collections using a unique visual and semantic representation.
The preliminary results show that the method is able to deliver meaningful results in an automatic annotation task. In addition, the proposed method allows to identify and localize the visual patterns which explain a particular annotation. This is a remarkable capability since training images are only globally annotated, but the method is able to find concrete image regions corresponding to individual annotations. Finally, the method is able to find meaningful clusters that group images that visually and semantically related.
The most important contribution of this paper is a gen-eral framework for semantic image collection analysis in histopathology. The most important characteristic of this framework is that it provides interpretability for the automatic learning methods which traditionally work like black-boxes. Interpretability is an important feature in biomedical contexts. The future work includes to combine several kind of visual features in the part-based image representation in order to detect several aspects of the semantics in visual patterns. Also could be proved common machine learning methods using the latent image representation to get a better performance in automatic annotation.
REFERENCES
[1] Arnau Oliver Anna Bosch, Xavier Munoz and Joan Martii. Modeling and classifying breast tissue density in mammograms. Proceedings of
[6] González F Cruz-Roa A, Caicedo JC. Visual mining in histology images using bag of features. In6th International Seminar on Medical Image Processing and Analysis - SIPAIM 2010, Hemeroteca Nacional de Colombia. Bogotá (Colombia), December 2010. Bioingenium Research Group.
[7] Gabriella Csurka, Christopher R. Dance, Lixin Fan, Jutta Willamowski, and Cédric Bray. Visual categorization with bags of keypoints. In
Workshop on Statistical Learning in Computer Vision, 2004.
[8] Chris H. Q. Ding, Tao Li, and Michael I. Jordan. Convex and semi-nonnegative matrix factorizations. IEEE Trans. Pattern Anal. Mach. Intell., 32:45–55, January 2010.
[9] Gloria Díaz and Eduardo Romero. Histopathological image classification using stain component features on a plsa model. In Isabelle Bloch and Roberto Cesar, editors,Progress in Pattern Recognition, Image Analysis, Computer Vision, and Applications, volume 6419 ofLecture Notes in Computer Science, pages 55–62. Springer Berlin / Heidelberg, 2010. [10] Christopher D. M. Fletcher. Diagnostic Histopathology of tumors.
Elsevier Science, 2003.
[11] Jiawei Han and Micheline Kamber. Data Mining: Concepts and Techniques. Morgan Kaufmann, 2000.
[12] Jonathan Hare, Sina Samangooei, Paul Lewis, and Mark Nixon. Seman-tic spaces revisited: investigating the performance of auto-annotation and semantic retrieval using semantic spaces. InCIVR ’08: The 2008 international conference on Content-based image and video retrieval, pages 359–368. ACM, July 2008.
[13] Thomas Hofmann. Unsupervised learning by probabilistic latent seman-tic analysis.Mach. Learn., 42:177–196, January 2001.
[14] Dimitris K. Iakovidis, Nikos Pelekis, Evangelos E. Kotsifakos, Ioannis Kopanakis, Haralampos Karanikas, and Yannis Theodoridis. A pattern similarity scheme for medical image retrieval. Information Technology in Biomedicine, IEEE Transactions on, 2008.
[15] Daniel D. Lee and H. Sebastian Seung. Algorithms for non-negative matrix factorization. InNIPS, pages 556–562, 2000.
[16] David D. Lewis. Naive (bayes) at forty: The independence assumption in information retrieval. pages 4–15. Springer Verlag, 1998.
[17] Fei-Fei Li and Pietro Perona. A bayesian hierarchical model for learning natural scene categories. In CVPR ’05: Proceedings of the 2005 IEEE Computer Society Conference on Computer Vision and Pattern Recognition (CVPR’05) - Volume 2, pages 524–531, Washington, DC, USA, 2005. IEEE Computer Society.
[18] Henning Muller, Nicolas Michoux, David Bandon, and Antoine Geiss-buhler. A review of content-based image retrieval systems in medical applications-clinical benefits and future directions.International journal of medical informatics, 73:1–23, February 2004. PMID: 15036075. [19] Simon Rogers, Mark Girolami, Colin Campbell, and Rainer
Bre-itling. The latent process decomposition of cdna microarray data sets.
IEEE/ACM Trans. Comput. Biol. Bioinformatics, 2:143–156, April 2005. [20] Jiayu Tang and Paul H. Lewis. Non-negative matrix factorisation for
object class discovery and image auto-annotation. 2008.
[21] T. Tommasi, F. Orabona, and B. Caputo. Clef2007 image annotation task: An svm - based cue integration approach. InWorking Notes of the 2007 CLEF Workshop, Budapest, Hungary, 2007.