SITE Working Paper No. 9, 2010
Portfolio Managers and Elections
in Emerging Economies: How
investors dislike political
uncertainty
Emmanuel Frot and Javier Santiso
1
Portfolio Managers and Elections in Emerging
Economies: How investors dislike political
uncertainty
Emmanuel Frot and Javier Santiso
1October 2010
Ab
s
tra
c
t
This paper studies the effect of elections and democracy on bond and equity flows to emerging countries. Our results indicate that elections affect portfolio flows: the period following an election is generally characterised by a fall in equity flows, and this occurs only where the incumbent is not re-elected. We interpret this result as evidence that political uncertainty about future policies plays a key role in explaining the effect of elections. Bond flows decrease after an election that brings a change of ideology in government, with some evidence that this effect is stronger if such change is from right- to leftwing. This set of results suggests that investors value continuity and stability in the political environment, and dislike changes. Finally, democracy, in itself, is not found to significantly influence portfolio equity and bond flows, such that there is no democratic premium. On the other hand, a decrease in the democracy score implies lower equity flows. Investors value continuity (stable democracy level, even if low) rather than improvements (democratic transitions) but are responsive to a deterioration in the democratic environment that is often accompanied by less transparency, and therefore greater uncertainty.
JEL Classification: G11; G15; F59
1 Emmanuel Frot, Stockholm Institute of Transition Economics, Box 6501, 118 83 Stockholm,
2
I.
Introduction
Politics matter for financial markets through many channels. They shape the institutions and laws that are relevant for finance, be they courts, tax rates, administrative efficiency, fiscal discipline, corruption, or expropriation risk. The relationship between investor behaviour and politics relies on the concept of political risk, broadly defined as the unfavourable changes in public policy that affect investment values (see, among others, Mosley 2008). Investors evaluate this risk as best they can, but uncertainty is exacerbated in times of political change and in particular during elections (Bernhard and Leblang, 2002). Because election periods are particularly intense in terms of political news, they present a unique opportunity to study the links between finance and politics. This paper uses them to understand how investments in equities and bonds are affected by political events. Although promising, elections are not the only events that can deliver results. Changes in the quality of democracy may occur more smoothly, but they nonetheless provide an interesting variation that is also considered here. Furthermore, they allow us to provide new evidence of the relationship between democracy levels and finance.
Using a database on monthly portfolio flows toward emerging markets, and combining this with information on elections and changes in democracy levels, we are able to test several features of the relationship between finance and politics. International financial markets present relevant characteristics with which to study this relationship, as argued by Campello (2009). These include highly competitive markets, where information is rapidly processed and where expectation changes are very likely to be reflected in quick portfolio changes. Emerging markets also offer key features for this study. Campello (2009) finds that, although investors respond to elections in the same way in developed and less developed countries, the effect is greater in developing economies. Past instability in emerging markets may explain why portfolio managers are more reactive in these countries. Mosley (2008) underlines that political risk is higher in developing countries because of less reliable economic data and lower transparency in politics. Information asymmetry is also more pronounced than in developed economies: the cost of gathering information on the politics of developing countries is higher, and drives the investor to rely on signals rather than on sound economic analysis.
3
If the hypothesis that elections have an effect on portfolio flows because of the greater uncertainty they generate is correct, then elections where uncertainty is reduced should not be associated with reduced investment flows. A prime case of low uncertainty is when the incumbent is re-elected. Another is when results are µpredictable¶, something which can be identified by looking at victory margins. Campello (2009) claims further that in close elections, investors already start to react during election campaigns, while in contested elections, they mostly react after the election and once the electoral results have been released.
It is also interesting to look at victory margins. A low victory margin may reinforce uncertainty, as the elected party/leader may not have sufficient power to impose their views. On the other hand, a very wide victory margin may signal unrestrained power with little opposition, or even rigged elections.
Finally, a large amount of literature (see for instance Campello, 2009; Mosley, 2008; Vaaler et al., 2005) argues that left-leaning governments present a greater risk for investment, meaning that elections that bring about a µmove to the left¶ are likely to PDJQLI\LQYHVWRUV¶UHDFWLRQV,QFRQWUDVWD µmove to the right¶ is likely to be welcomed by portfolio managers. It should be noted that if political uncertainty matters in itself, then any change in the ideological platform will negatively affect portfolio flows, but that the effect may be more pronounced in the event of a µmove to the left¶.
In addition to providing new insights on the effect of elections on financial flows, we enrich our study of the relationship between the financial and political worlds by estimating the effect of changes in the level of democracy. The first hypothesis tested concerns the effect of the level of democracy itself. More democratic countries may enjoy higher portfolio flows because of the greater transparency in their political environment, as well as the checks and balances that regulate political decisions. Mosley and Singer (2008) make the same conjecture and find support for it. On the other hand, autocratic countries may offer stable conditions with little political uncertainty (at least those linked with the electoral processes), which can reassure investors. Finally, changes in democracy, whether positive or negative, are similar to elections in that they potentially modify institutions and create uncertainty about future policies and the balance of power in the country.
4
although this may be due to the fact that many presidential regimes are found in Latin America, a region we also find to be particularly affected by elections (on Latin America in particular see also: Santiso, 2003; Martínez and Santiso, 2003). Turning to ideology, we find that ideology changes negatively affect bond, but not equity, flows. This effect is evident for both right-to-leftwing and left-to-rightwing changes, but appears to be greater and starker for right-to-leftwing transitions. This set of results suggests that investors value continuity and stability in the political environment. A change of leader or political ideology usually results in lower than average portfolio flows.
We do not find that there is a democratic premium, in the sense that the more democratic the country, the greater the portfolio flows. However, changes in democracy affect equity flows and this is consistent with our hypothesis that uncertainty matters for investors. A fall in the democracy score reduces equity flows, but an improvement in the quality of democracy has no impact. Investors are indifferent to the exact level of democracy but are worried by changes toward autocracy. Increased democracy may be good in itself but it also creates some uncertainty, resulting in the net effect being zero.
II.
Literature review
The studies connected with the relations between finance and politics are neither new nor solely exclusive to developing economies. History is full of examples linking finance and politics. Some economic historians argue for example that we could trace the origins of major political events like the French Revolution back to a stock market bubble caused by a convicted Scottish murderer.2 Others have pointed out that being politically connected can boost your stock returns. Firms supporting the Nazi movement in the 1930s for example, experienced unusually higher returns and outperformed unconnected firms.3 In the US, from 1927 until the early 2000s, the excess return in the stock market
was higher under Democratic presidencies than under Republican ones, according to Santa-Clara and Valkanov (2003). In a large and comprehensive study devoted to OECD countries, William Bernhard and David Leblang (2006) also showed how the prices of financial assets, stocks, bonds and currencies respond to such political developments as elections, cabinet formations and dissolutions, as well as trends in other nations.
2 See economic historians¶ narratives on the financial origins of major political events such as the
French Revolution, the 1848 Revolution or the outbreak of the First Word War, Ferguson (2008) and Ferguson (2006).
5
The relation between democracy and finance is however new and particularly dense in emerging markets where we witnessed both a major trend toward democratisation over the past decades and an increase in financial market activities, both domestic and global.4
Stock markets tend to overreact to elections both in developed and developing countries: Elections are anticipated by markets and investors in developed and emerging economies alike. In the US markets, participants almost bet on electoral results, anticipating in the 2004 elections, for example, higher equity prices, interest rates and oil prices and a stronger dollar under a George W. Bush presidency than under a John Kerry presidency.5
Elections therefore have some resonance on financial markets in developed economies (as stressed by Snowberg et al., 2007; Bernhard and Leblang, 2006). Several studies have underscored the influence of political events on financial markets, both of OECD and emerging economies. As pointed out by Bernhard and Leblang (2006), political processes such as presidential and legislative elections, cabinet formations and referenda have an impact on the behaviour of actors in capital markets. Incorporating political variables can also improve the predictive performance of models and crisis forecasting (Leblang and Satyanath, 2008). Portfolio allocations made by investors are also sensitive to political cycles, and consequently exchange rates. During election periods, sovereign bond and stock market prices can also become extremely volatile and the role of political information becomes therefore crucial in determining the micro-behaviour of capital markets during political processes.
However, the magnitude and scope of the impact of regular events such as elections are much stronger in emerging countries where the swings of financial markets can provoke major crisis (Campello, 2009). The intensity is particularly significant in emerging countries and Latin America offers some perfect examples. The four most recent and significant financial crises in the region (Mexico in 1994, Brazil in 1999, Argentina in 2001, and Brazil again in 2002) took place during a presidential or parliamentary electoral year. The same is true of other emerging markets: for nine other emerging economies, the financial crises of the 1990s occurred during electoral periods or political transitions (Mei, 1999). Eichengreen et al. (1995) were among the first to address the
4 On the relations between political democracy and financial globalisation between 1870 and 2000
see Eichengreen and Leblang (2006). See also Campos and Coricelli (2009) on the subtle relation between financial liberalisation and democratic regime. See also Haber et al. (2008) on the relations between political institutions and financial development.
5 Snowberg et al. (2007) also found a similar Republican-Democrat differential for the 2000
6
political dimension of financial crises, finding intimate links between political processes and exchange-rate turbulence. Later, Frieden et al. (2001) argued that weak governments might be more vulnerable to currency crises. In a detailed study of the behaviour of real and nominal exchange rates in Latin America, they confirmed that changes in exchange-rate regimes coincided with elections. To be more precise, devaluations were generally postponed until after elections. Overall, the probability of major devaluations increases in the run-up to elections, with governments, where possible, tending to put off the adjustment until after votes are cast. Latin American governments tend to defer painful exchange-rate adjustments after the presidential elections and therefore most of the financial crises tend to happen in a narrow window of one to five months after elections.
Obviously, not all elections per se lead to financial turmoil. The behaviour in the period that surrounds elections is influenced by the partisanship of the likely winner of the contest (see Campello, 2009). Financial markets tend to become particularly risk-averse when leftwing candidates are the likely winners. In Brazil, in 2002, the prospect of a leftist victory headed by Lula triggered a massive devaluation of the Real while spreads, Brazilian risk premiums, shot up to more than 2,000 basis points. Up until that point, only 11 emerging countries had ever experienced a deterioration of that magnitude, and nearly all of them ended up defaulting on their debts. Brazil was saved in the end, and events were later to show just how mistaken the markets were in that case. The recent history of Brazil is, however, particularly illustrative, as Lula tried several times to win the elections and on each occasion financial markets tended to overreact negatively (for a comparative analysis of the different election years and the reactions of the financial markets in Brazil, see: Martínez and Santiso, 2003). In 2006, however, the situation changed dramatically with WKH SURVSHFWV RI /XOD¶V UH-election being seen positively. This time, the candidate was very well known, and uncertainty minimised (Nieto Parra and Santiso for a detailed analysis of the 2006 elections on financial markets, 2009a and 2009b).
7
III.
Data sources
The datasets used in this study are broad compared to other similar studies. For instance, Campello (2009) bases her analysis on 119 elections in developed and developing countries. Mosley (2008), who hypothesises that uncertainty is key to the explanation of financial turmoil around elections, uses data from 30 emerging economies. Mosley and Singer (2008) study the relationship between democracy and stock market valuations and use a sample of 37 countries. They stress that existing analyses of stock markets tend to focus on one or two developed countries, in such a way that their analysis has much more scope.
Our dataset contains observations on 46 emerging markets for equity flows and on 29 for bond flows. 117 elections took place during the sample period nevertheless, unlike Campello¶V (2009) sample, they are all in emerging markets. 61 changes in democracy levels occur. Of the three studies cited above, only Campello (2009) uses monthly data, whereas the others work with yearly data. Given that investors quickly update their expectations, we consider it to be a substantial advantage to have access to monthly data. It also considerably increases our sample size, making identification easier. Mosley¶V (2008) sample size is, for instance, 198. Mosley and Singer¶V (2008) is 521. For equities, ours is 6,142. We took great care to collect precise monthly data for elections and democracy changes in order to match these to monthly portfolio flows.
Our primary data source is the EPFR Global data for monthly equity flows. This database provides country flows by tracking approximately 880 funds, with total net assets of around US $750 billion (as at 2008, July 31). The universe of funds includes funds that invest in both developed and emerging markets, or solely in emerging markets, and which are registered in the US, Canada, Europe and Asia as well as all major offshore fund jurisdictions. We only use the data on emerging markets. Our dataset contains information from April 1995 to April 2009. Bond flows are also available, tracking around 60 funds. The time span, however, is much shorter, from February 2004 to April 2009. Flows are converted into constant US dollars by deflating them using the monthly Consumer Price Index for all urban consumers from the Bureau of Labor Statistics.
8
regimes are classified into presidential and parliamentarian, following the definitions found in the DPI.
The Polity IV database provides the democracy score that ranges from -10 to 10. It also dates the exact month when a democracy score changes. This allows us to match it with our portfolio flow dataset. Finally, IMF data is used for GDP (in constant terms) and population. These are yearly variables, so values are interpolated to get monthly figures.
IV.
Examples
Before moving on to the econometric analysis, we can illustrate our approach using several cases.
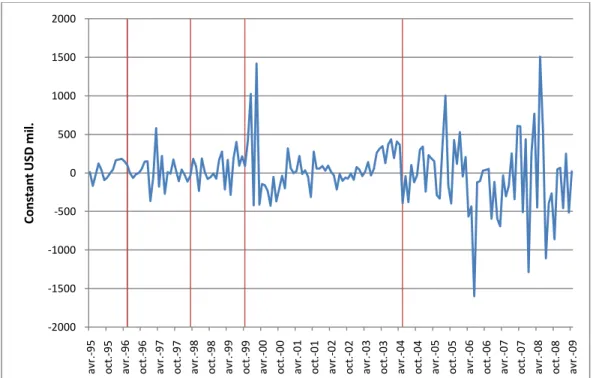
The first graph plots monthly Real portfolio equity flows to Brazil. The vertical lines indicate a presidential election, of which there were three between April 1995 and December 2009. In all three cases, Lula was the leftwing candidate. He was defeated in the first election, but won the following round and was re-elected in the final elections. The Brazilian example is very rich because it allows to test the hypothesis of whether a shift from a centre-right to a centre-left leader alters portfolio flows (in the same way that it massively altered the stock markets, currencies, interest rates and brokers¶ recommendations in 2002 in particular, as stressed in Martínez and Santiso, 2003; Santiso, 2006; Nieto Parra and Santiso, 2008 and 2009). The 2002 episode in particular provoked major swings in both Brazilian bond markets and stock markets, in addition to provoking high volatility in both bond and equity portfolio flows (Jensen and Schmith, 2005).
Our strategy is to compare the periods immediately before and after an election to the rest of the sample, in which no elections are held. We expect the period before the election to matter where investors dislike the uncertainty brought about by the forthcoming election and adjust their investments accordingly. On the other hand, it should be easy for investors to sell their holdings once the uncertainty is resolved, and so they may not have the incentive to sell before the election. Once the election reveals the identity of the next head of state, this is likely be the period in which investors change their portfolio allocations.
9
the effect of the election itself, and therefore focus our attention on the six months preceding and following the election. Although equity flows were low from the end of 1999 until 2001, we do not attribute this to the election.
On the other hand, equity flows declined immediately after the 2002 election, with negative flows in all but one month during the six-month period following the election. Luiz Inácio Lula da Silva won this election and his leftwing profile caused a great deal of turmoil on the Brazilian financial markets. As can be seen in Figure 1, equity flows were actually quite low during the first years of his presidency, before sharply increasing. Even if ultimately unfounded, the possibility of a major policy swing with the victory of a leftwing candidate created a lot of anxiety among investors. Foreign portfolio investors in particular heavily sold Brazilian stocks and the Brazilian currency in futures markets ahead of the 2002 elections (Andrade and Kohlscheen, 2010). Some investment banks even invented a specific µLulameter¶6 in order to measure risk aversion against Lula in
the financial markets.
/XOD¶V UH-election in 2006 took place in a highly volatile environment and it is unclear whether the election period is characterised by higher or lower flows. This is consistent with our hypothesis that uncertainty is lower when the incumbent is re-elected. The 2006 election, despite EHLQJZRQE\DOHIWZLQJFDQGLGDWHERUHQRULVNEHFDXVH/XOD¶VSROLFLHV were well known at that time. The 2002 election is the exact opposite of the 2006 vote, with a new, and leftwing leader. That created two sources of uncertainty and resulted in lower than average equity flows.
10
Figure 1: E quity flows, B razil
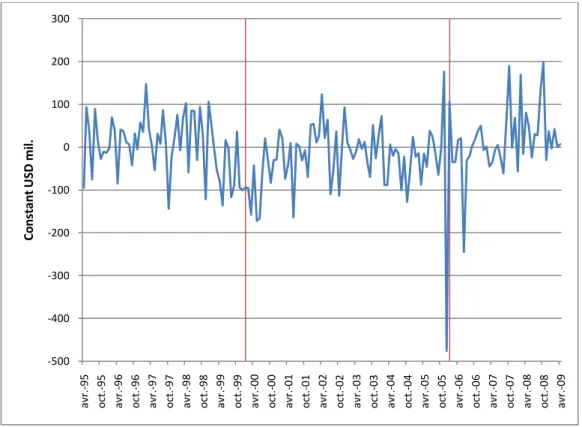
The next example is India, where political instability led to three elections in 1996, 1998 and 1999. The 1999 election saw the incumbent re-elected, and equity flows actually increased right after the election. On the contrary, the 2002 election was won by the Congress party; to the surprise of most analysts. Equity flows fell immediately after the election in response to this unexpected outcome. So, in this case, a change of leader seems to be a good predictor of flows after the election.
11
Figure 2: E quity flows, India
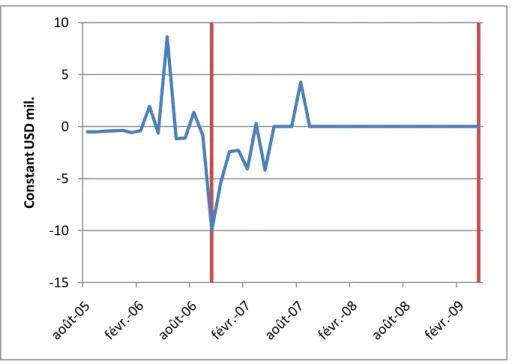
Ecuador is also a clear-cut case. Data is available for a shorter period but still includes one election in 2006. The last election took place in 2009, but no equity flows have been recorded since September 2007. The 2006 presidential election caused a fall in equity flows. Not only did it bring a new leader at the head of the executive power but also a leftist president, a case similar to that of Brazil in 2002.
12
Figure 3: E quity flows, Ecuador
The last graph plots equity flows in Chile. The 2000 election was preceded and followed by lower equity flows. The 2006 election of the socialist presidential candidate Michelle Bachelet was also accompanied by disinvestments on the Chilean equity market. Election of a leftwing candidate, as in Ecuador and Brazil, is usually followed by a fall in equity flows. On the other hand, it may be surprising that investors did not anticipate the election outcome. The election of Michelle Bachelet was widely expected. Opinion polls six months ahead of the election already forecast her victory by a comfortable margin.
-‐15 -‐10 -‐5 0 5 10
C
o
n
st
an
t U
SD
m
13
Figure 4: E quity flows, Chile
These examples provide some support for our hypotheses. It seems that the election of leftwing candidates creates disinvestment by portfolio managers, but that this effect is not reproduced when the same candidate is re-elected. However, this is only suggestive evidence concerning a few selected countries and fails to test our other hypotheses. More importantly, we cannot conclude with certainty from these graphs that the variations observed around election dates are indeed due to elections. For instance, a global macroeconomic shock may have occurred at the same time, with the result that all countries experienced lower equity flows during these periods. In that case, we would wrongly infer causality when we merely observe a correlation. In order to find the link between elections and portfolio flows, we need to spell out a clear identification strategy.
V.
Estimation strategy
For all our estimations, we follow a similar estimation strategy based on fixed effects regressions. This allows us to control for unobservable variables at the country level that
14
are constant over time. We also include time fixed effects, where time refers to a specific month in a specific year, and country-specific time trends. By doing so, we aim to capture as much unobserved heterogeneity between countries as possible, and to check for common time shocks. This alleviates the concern of a common shock to all countries that creates a spurious correlation between elections and portfolio flows. All regressions include GDP per capita and population of the country.
Identification, therefore, relies on within-country variation and checking for common time effects. In other words, our estimator will indicate an effect of elections if, in the months before and after an election, equity flows are higher or lower than on average in the country, after taking into account the deviation from the average during these months in all countries (with and without elections).
The dependent variable is equity flows, or bond flows, in constant dollars, and we always add its lag as an independent variable. This makes fixed effect estimates biased, but the data is of type µlarge T-small N¶, or a time-series-cross-section. In that case, the bias due to the inclusion of the lagged dependent variable can be considered to be negligible. In any case, the use of the GMM estimator to correct this bias is precluded given that it requires N to be large, which is obviously not the case here. Adding one lag takes care of at least some autocorrelation in the equity series.
However time-series-cross-section data also has its own difficulties, in the presence of autocorrelation and heteroskedasticity. To alleviate these concerns, in addition to including time fixed effects and country time trends, standard errors are clustered at the country level. Clustering ensures that standard errors are robust to both arbitrary hetereoskedasticity and arbitrary intra-country correlation.
The interest variable is usually a dummy variable that indicates a six-month period before or after an election. It is then interacted with other variables whose effects we are interested in: ideology, change of leader, etc.
We therefore estimate the following equation:
where eit is the equity flow to recipient i during time (month-year) t, xit is a vector of
variables of interests (election dummies, interacted with other variables if required), zit is
a vector that includes the variables GDP per capita and population, µi is a country fixed
15
VI.
Elections
The main motivation in this section is to study the interaction between elections and portfolio (both bond and equity) flows. The question answered is whether elections have DQ\ LPSDFW RQ SRUWIROLR LQYHVWRUV¶ GHFLVLRQV $V H[SODLQHG LQ WKH LQWURGXFWLRQ RXU hypothesis is that this occurs when uncertainty about future policies is present, in other words when policy uncertainty in on the rise. When the incumbent is re-elected, uncertainty is dramatically reduced. This suggests a test of our hypothesis, which can be LPSOHPHQWHGE\FROOHFWLQJLQIRUPDWLRQRQWKHZLQQHU¶VLGHQWLW\
The election period starts six months before and ends six months after the election. Effects in the pre- and post-election periods are not constrained to be the same in the regressions. If investors are able to anticipate the election outcome then changes should mostly take place during the months preceding the election. Looking at pre- and post-election months, therefore, gives us some insights into investors¶ behaviour.
The interest variables in this section are dummy variables that identify pre- and post-election periods. The µpre-post-election¶ dummy takes a value of one in any of the six months preceding the month when the election takes place. For elections with two rounds, we consider the last round. The µpost-election¶ dummy takes the value 1 in any of the six months following an election. This does not include the month when the election is held. If an election takes place in June, the pre-election variable is equal to 1 from December to May. The post-election variable is equal to 1 from July to December. Finally, the µelection month¶ dummy is an indicator only for the month in which the election takes place. We isolate the election month for two reasons. Firstly, elections are held on various days, therefore the effect for this particular month is likely to be a mixture of pre- and post-election periods. In order to avoid contaminating either of these periods with the effects of the other period, we simply consider this month separately. Secondly, the days immediately surrounding the election are particularly rich in information and isolating their effects may be fruitful.
In order to further test the hypothesis that elections influence portfolio flows through the uncertainty they generate, we define a µchange of leader¶ variable. It splits each of the p and post-election variables into two dummies: one indicates that the incumbent is re-elected in the election; the other that s/he is not (regardless of whether or not s/he was a candidate).
16
effects and country-specific time trends. The coefficients on these controls are not reported here for brevity. Column 1 indicates that equity flows are unaffected in months before an election. On the other hand, they are affected after an election, and by an average of US $17 million. Column 2 discriminates between presidential and parliamentary regimes. It finds that the fall in equity flows is actually limited to presidential regimes and reaches US $40 million.
17
T able 1: E ffect of elections on equity flows
(1) (2) (3)
Equity Equity Equity Equity, lagged 0.13***
(0.026)
0.13***
(0.026)
0.13***
(0.026)
Pre election 4.97 (9.23)
Election month 20.1 (25.7)
20.0 (25.7)
Post election -17.0*
(9.35)
Pre parliamentary election 13.8 (11.4)
Election month, parliamentary election
-9.47 (24.4)
Post parliamentary election 2.81 (6.09)
Pre presidential election -4.47 (16.3)
Election month, presidential election
54.2 (44.0)
Post presidential election -40.0**
(16.5)
Pre election, incumbent re-elected
1.10 (12.8)
Pre election, incumbent not re-elected
7.17 (13.6)
Post election, incumbent re-elected
0.26 (10.9)
Post election, incumbent not re-elected
-28.3**
(11.1)
Constant 111.4
(324.7)
89.9 (323.1)
112.7 (322.5)
Observations 6142 6142 6142
Adjusted R2 0.104 0.104 0.104
18
These results support our hypothesis. First, elections are indeed an event that investors take into account. Equity flows, during the months following an election, are smaller than during non-electoral periods. Second, elections have no effect on equity flows when the incumbent remains in power. This suggests that investors do not view elections negatively when these do not result in a change of political leader and, consequently, major policy options. This is evidence that portfolio managers are affected by the uncertainty brought by a new leader. They need some time to assess WKH QHZ OHDGHU¶V political ideology and the reforms that s/he intends to implement. Other empirical works, using different methodologies, also confirm this finding. In particular, Pastor and Veronesi (2010) found that government policy changes affect stock prices. On average, stock prices fall at the announcements of policy changes and the price fall is expected to be large if uncertainty about government policy is large.
The pre- and post-election dummies each span six months, but this arbitrary definition may fail to identify the exact period when equity flows fall. In particular, it may underestimate the true size of the fall if the accurate period is shorter. We therefore estimate the monthly change in equity flows by including a set of 6 monthly dummies before and 12 after the election. Figure 5 plots the dummy coefficients from six months before to 12 months after the election when parliamentary and presidential regimes are pooled.
19
The election outcome is known in month 0. Many coefficients are negative after the election and it takes around 8 months following the election for the negative effect to disappear. It must be added that no coefficient, neither before nor after the election, is significantly different from zero at the 5% level. Nonetheless, taken jointly, all the negative coefficients from months 0 to 8 are significantly different from zero at the 10 percent level. We know from Table 1 that the effect is mostly due to presidential elections. Therefore, we repeat this approach but with different dummies for parliamentary and presidential regimes.
Figure 6: Monthly dummies, presidential regimes
20
Figure 7: Monthly dummies, parliamentary regimes
The marked difference between presidential and parliamentary regimes may be due to different factors. First, many presidential regimes are mostly in Latin America, where past history is scattered with financial crises, exchange rates crises and debt defaults. Investors may be particularly responsive to any political event in these countries. Second, in presidential regimes, the president enjoys some strong political power and may have more leeway to introduce radical reforms and policy swings than in a parliamentary regime. Portfolio managers are aware of this and, in consequence, react more strongly to a presidential election. Serial defaulters are also much more common in presidential rather than parliamentary regimes; another reason, for example, for bondholders to be particularly cautious with new policymakers elected in a presidential regime. For instance, between 1976 and 2000, presidential democracies were 5 times more likely to default on external debts than parliamentary democracies according to research conducted by Kohlscheen (2007 and 2010).
21
T able 2: E ffect of elections on bond flows
(1) (2) (3)
Bond flows Bond flows Bond flows Bond flows, lagged 0.021
(0.064)
0.019 (0.064)
0.018 (0.065)
Pre election 0.10 (8.70)
Election month 7.13 (12.0)
7.09 (11.9)
Post election 13.2 (9.86)
Pre parliamentary election 19.7 (13.4)
Election month, parliamentary election
28.0 (30.2)
Post parliamentary election 11.8 (21.6)
Pre presidential election -8.39 (10.8)
Election month, presidential election
-1.84 (11.1)
Post presidential election 14.5 (10.7)
Pre election, incumbent re-elected
19.8*
(10.1)
Pre election, incumbent not re-elected
-14.4 (11.9)
Post election, incumbent re-elected
26.2 (20.2)
Post election, incumbent not re-elected
3.0 (7.7)
Constant 22.6
(931.7)
-99.8 (972.0)
190.1 (787.4)
Observations 1808 1808 1808
Adjusted R2 0.053 0.054 0.056
22
Emerging markets are located in six different regions and we check if results differ across these broad areas. To do so, we interact the pre-election, election month, and post-election dummies with regional dummies. The cost of doing so is that there are few elections in some regions and, consequently, the coefficient may be disproportionately influenced by an extreme outcome.
Table 3 shows the coefficients on the election dummies by region. They are estimated using equation (1) where election dummies are interacted with regional dummies.
T able 3: Regional effects of elections on equity flows
East Asia and Pacific
Europe and Central Asia Latin America and Caribbean
Middle East and North Africa
South Asia Sub-Saharan Africa
Pre election 37.7**
(14.9) 9.68 (17.0) -58.7*** (15.7) -19.8** (9.12) 48.5 (30.8) 19.2 (15.0)
Election month 114.2 (91.1) 15.5 (22.3) 19.1 (39.8) -115.0*** (15.2) -47.8* (27.3) 11.7 (25.9)
Post election -46.6 (29.9) -22.1* (12.8) -18.1* (10.4) -20.3 (26.0) 30.4 (23.7) 8.67 (12.6) Standard errors clustered at the country level in parentheses. The regression includes lagged equity, GDP per capita, population, time fixed effects and country-specific time trends. *p < 0.10, **p < 0.05, ***p < 0.01
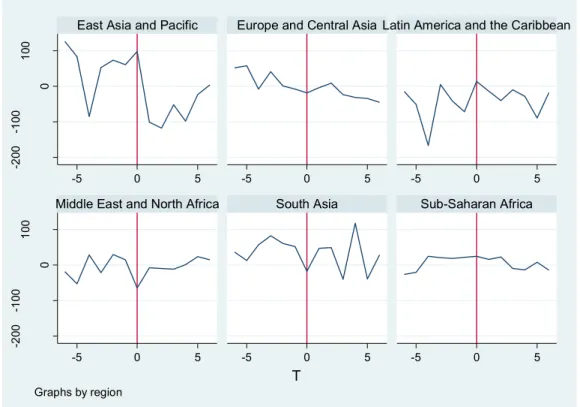
It is interesting to look at the pre- and post-election periods. Results appear to be quite heterogeneous across regions. Pre-election months are characterised by lower flows in Latin America and the Middle East. On the other hand, East Asia exhibits the opposite pattern. During post-election months, there are no significant positive effects. Overall, Latin America is the region where elections create the highest variation in equity flows, which tends to confirm the suggestion that Latin America plays an important role in explaining the larger effect found in presidential regimes. Flows are significantly lower both before and after the election, reflecting the volatile nature of the region.
23
Two regions stand out as completely unaffected by elections: South Asia and Sub-Saharan Africa, where election periods are no different from other months.
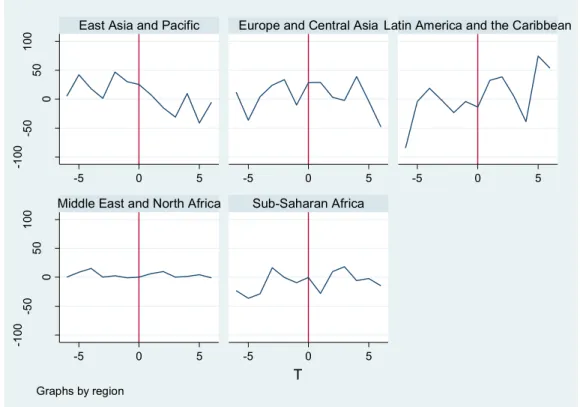
Results for bonds disaggregated by region are not presented because no coefficient is shown to be statistically significant. Figure 8 and Figure 9 below illustrate more visually the effects by regions for both equity and bond flows.
Figure 8: Regional effects of elections on equity flows, monthly dummies
-2
00
-1
00
0
10
0
-2
00
-1
00
0
10
0
-5 0 5 -5 0 5 -5 0 5
-5 0 5 -5 0 5 -5 0 5
East Asia and Pacific Europe and Central Asia Latin America and the Caribbean
Middle East and North Africa South Asia Sub-Saharan Africa
Eq
ui
ty
24
Figure 9: Regional effects of elections on bond flows, monthly dummies
VII.
Party orientation: right versus left
Elections matter when they bring a new leader to the head of the executive. However, new leaders can be very different from the incumbent, or quite related if they are from the same political party or share a similar ideology.
In addition, a political swing from left to right may be different from one from right to left. Campello (2009) showed that a change from right to left caused an increase in stock market indexes, and that the opposite move caused a fall. Using direct data on flows, instead of market indexes, we revisit this result here. Choe (2006) in particular argued that leftwing governments tend to have negative effects on credit ratings. The empirical analyses show that partisanship of government only matters in emerging countries and much less so in developed countries. In emerging countries left party governments tend to receive lower credit ratings than their non-left counterparts. Other studies show that there is no clear pattern to support the claim that leftwing parties in office increased risk
-1
00
-5
0
0
50
10
0
-1
00
-5
0
0
50
10
0
-5 0 5 -5 0 5 -5 0 5
-5 0 5 -5 0 5
East Asia and Pacific Europe and Central Asia Latin America and the Caribbean
Middle East and North Africa Sub-Saharan Africa
Bo
nd
25
evaluations (for example, Renno and Spanakos, 2009). Other works examined the effect of partisan politics on stock market returns, suggesting that financial markets aversion towards leftwing candidates might at least be questionable on the grounds that post-financial stock returns during leftwing governments tend to be higher. According to Gourevitch et al. (2010), and contrary to received wisdom, their results suggest that left-leaning governments are more likely to be associated with higher stock market capitalisation than their counterparts to the right and centre of the political spectrum.
The DPI identifies party orientation from an economic policy point of view using a left-centre-right classification. In many cases it remains agnostic about orientation, either because it does not have any information, or because the orientation does not fit into a left/right dichotomy. That reduces the number of elections in the sample by a significant amount. We test to see if a change towards a party whose orientation is more towards the right (or the left) than the incumbent has any effect on equity flows using similar pre- and post-election dummies. A change towards the right can be either from left to centre, left to right, or centre to right. Because a change from centre to right can sometimes be quite difficult to discern from one from right to right, we also consider µradical¶ changes, from left to right, and right to left. But first, we check if party orientation has any effect on equity flows on average.
The first column of Table 4 shows the results of a regression that includes party orientation dummies. µRight¶ is the omitted category. There is no significant effect of party orientation. Fixed-effect regressions might have difficulties in estimating the party orientation coefficients because there is not enough variation within countries. We re-estimated the regression using random effects. Though the coefficient is likely to be biased, it exploits the greater variation between countries and so may fare better. Results, not included in the table, are similar and coefficients are still far from being significant. It is therefore not the case that leftwing parties are disregarded by equity investors.
26
distinguish this from other changes. For instance µright-to-left¶ implies equity levels lower than µleft-to-right¶ only with a p-value of 7.36 percent.
Column 2 does not distinguish a centre-to-right change from a left-to-right change. The problem with the centre category is that it includes both centre-left and centre-right parties. To avoid this issue, we restrict changes only to µleft-to-right¶ and µright-to-left¶. This makes us confident that the elections considered bring leaders with very different political agenda. But again, coefficients turn out not to be significantly different from zero. The total effect of an election from right to left in the post-election period is evaluated by the sum of the left and right-to-left coefficients. It is significantly different from the total effect from left±to-right only at the 8.45 percent level.
27
T able 4: E ffect of party orientation on equity flows
(1) (2) (3)
Equity Equity Equity Equity, lagged 0.13***
(0.031)
0.13***
(0.031)
0.13***
(0.031)
Left 12.3
(19.6)
0.31 (23.1)
17.9 (20.1)
Centre 23.1
(23.5)
15.8 (20.3)
25.7 (23.0)
Pre election -1.89
(11.6)
-4.81 (10.5)
Pre election, towards left -4.67 (30.4)
Pre election, towards right 6.90 (24.3)
Election month 36.2
(31.7)
36.3 (31.7)
Post election -6.92
(15.6)
-12.0 (13.7)
Post election, towards left 0.40 (17.8)
Post election, towards right -57.7 (36.6)
Pre election, right to left 45.9
(33.9)
Pre election, left to right -31.1*
(17.7)
Post election, right to left -9.23
(19.2)
Post election, left to right -34.6
(29.6)
Constant -92.9
(258.7)
-120.3 (255.2)
-127.4 (265.1)
Observations 4260 4260 4260
Adjusted R2 0.108 0.108 0.108
28
Party orientation has no effect on equity flows but the contrary holds for bond flows, as shown by the next table.
T able 5: E ffect of elections on bond flows
(1) (2) (3)
Bond flows Bond flows Bond flows Bond, lagged 0.0038
(0.078)
-0.0079 (0.077)
-0.0063 (0.077)
Left 14.0
(15.4)
1.01 (24.1)
9.17 (28.4)
Centre 16.1
(20.9)
6.44 (22.9)
20.7 (35.1)
Pre election -3.02
(14.7)
-3.62 (13.9)
Pre election, towards left -3.43 (19.3)
Pre election, towards right 10.7 (13.8)
Election month 8.05
(14.8)
8.30 (15.0)
Post election 43.8***
(15.1)
37.7**
(13.3)
Post election, towards left -45.4**
(17.3)
Post election, towards right -39.4**
(15.4)
Pre election, right to left 1.81
(24.9)
Pre election, left to right 8.41
(13.4)
Post election, right to left -47.5**
(18.3)
Post election, left to right -25.9
(16.5)
Constant -597.3
(1383.4)
-1014.4 (1579.4)
-1049.3 (1568.3)
29
Adjusted R2 0.040 0.047 0.045
Standard errors clustered at the country level in parentheses. All regressions include GDP per capita, population, time fixed effects and country-specific time trends. *p < 0.10, **p < 0.05, ***p < 0.01
Column 1 confirms the result that, in itself, party orientation does not drive portfolio flows. Columns 2 and 3 show that it does when combined with elections. Significant effects are only observed after the elections. Column 2 reveals that an election with no change of party orientation on average increases bond flows, and that the effect is large. Unlike equity flows, what matters is not that the incumbent is re-elected, but, more broadly, that party orientation remains the same. So, some continuity in policy is beneficial for bond flows as well. On the other hand, a change of party orientation eradicates this effect, particularly if it is a shift towards a more leftist party (either right-to-centre, or right-to-left, or centre-to-left). The sum of the post-election dummy and post election towards either right or left coefficients is not significantly different from zero. Interestingly, all the elections towards left in the regression sample took place in Latin America (Chile, Ecuador, Peru, Uruguay).
Column 3 only considers more radical changes from right to left and the opposite. It confirms that a right-to-left change creates enough uncertainty to wipe out any benefit related to political continuity. However, the result for left-to-right elections is not robust to the more restrictive definition of political change adopted in this specification, casting some doubt as to the effect reflected in column 2. By way of conclusion, bond flows, unlike equity flows, react to a change of political orientation, especially if the elected party implements more leftist policies than the incumbent.
30
VIII.
Victory margin
We now study the characteristics of the election in finer detail. The DPI reports the score of each candidate or main party in an election. As it only covers up to 2006, we have done our best to complete the data up to April 2009, when our EPFR dataset stops. For each election we define how close it was. For presidential elections, we simply take the percentage of votes that went to the winning candidate. If there were two rounds, we use the second one. For parliamentary elections we use the percentage of seats the winning coalition represents following the election. We then subtract 50 from this figure. In a presidential regime where the winner of the first round wins the election, the average score of the leader will be lower than that of a presidential regime with two rounds of elections. The fixed effects take care of these particularities.
31
T able 6: E ffect of victory margins on equity flows
(1) (2)
Equity Equity Equity, lagged 0.13***
(0.026)
0.13***
(0.026)
Pre election -2.08 (11.0)
Pre election*Election score 0.97 (0.69)
Election month 19.8 (25.6)
20.2 (25.7)
Post election -19.3*
(10.9)
Post election*Election score 0.32 (0.56)
Pre parliamentary election 4.98 (16.7)
Pre parliamentary election*Election score
0.88 (0.73)
Pre presidential election -7.79 (15.3)
Pre presidential election*Election score
0.79 (1.91)
Post parliamentary election -0.67 (8.17)
Post parliamentary election*Election score
0.39 (0.24)
Post presidential election -36.6*
(18.2)
Post presidential election*Election score
-1.39 (1.52)
Constant 116.1 (325.0)
109.8 (323.5) Observations 6142 6142 Adjusted R2 0.104 0.104
32
The coefficient on the post election dummy remains negative and significant at the 10 percent level, and there is no effect of the electoral score on equity. However, we know that the fall in equity flows is only observed in presidential regimes, so in column 2 we break down interaction terms according to the political regime. The interaction term still has no effect. Electoral score therefore has at best a quite limited impact on equity flows. In particular, it does not influence pre-election flows, casting doubt on the claim that investors are more anxious before uncertain election outcomes.
33
T able 7: E ffect of victory margins on bond flows
(1) (2)
Bond flows Bond flows Bond, lagged 0.019
(0.064)
0.018 (0.065)
Pre election -8.03 (12.2)
Pre election*Election score 0.80 (0.54)
Election month 7.06 (12.0)
6.77 (12.0)
Post election 18.0*
(10.5)
Post election*Election score -0.37 (0.43)
Pre parliamentary election 17.2 (20.4)
Pre parliamentary election*Election score
0.066 (0.75)
Pre presidential election -15.4 (14.6)
Pre presidential election*Election score
0.90 (0.65)
Post parliamentary election 13.9 (25.2)
Post parliamentary election*Election score
-0.18 (0.43)
Post presidential election 19.1 (12.1)
Post presidential election*Election score
-0.41 (0.62)
Constant -3.69
(968.1)
-45.8 (950.1)
Observations 1808 1808
Adjusted R2 0.054 0.053
Standard errors clustered at the country level in parentheses. All regressions include GDP per capita, population, time fixed effects and country-specific time trends. *p
34
These results are somewhat disappointing, and do not confirm those of Campello (2009). She uses a different definition of predictable elections, adopting a cut-off rule: When the winner obtains a 10 percent vote-share advantage over the runner-up, the election is defined as predictable. We use a continuous measure. Further research into the precise details of victory margins may be useful in order to better understand the mechanisms at play.
IX.
Democracy
We have so far ignored democratic political regimes. Two main questions have been posed. First, do more democratic countries receive more portfolio investments? Second, is a change in democracy accompanied by a change in portfolio (bond and equity) flows?
35
T able 8
(1) FE (2) FE (3) RE (4) FE (5) RE Equity Equity Equity Equity Equity Equity, lagged 0.14***
(0.030) 0.13*** (0.029) 0.16*** (0.036) 0.13*** (0.029) 0.16*** (0.035)
Democracy 0.86 (1.47) 0.35 (1.59) -0.68 (1.10) 0.64 (1.66) -0.59 (1.10)
Positive democracy change -1.92 (2.13) -0.88 (2.28) -0.0090 (2.12) 1.19 (2.56)
Negative democracy change -3.01* (1.62) -3.13** (1.52) -2.79* (1.63) -3.06** (1.50)
Election month 23.0
(26.0)
22.7 (25.3)
Post parliamentary election
2.49 (5.14)
1.40 (6.16)
Post presidential election
-40.6**
(18.6)
-41.8**
(19.0)
Constant -20.9 (314.4) -5.91 (320.4) 319.3 (233.0) -28.0 (322.2) 305.6 (235.2)
Observations 5805 5805 5805 5805 5805
Adjusted R2 0.105 0.105 0.106
Standard errors clustered at the country level in parentheses. All regressions include GDP per capita, population, time fixed effects and country-specific time trends. *p < 0.10, **p < 0.05, ***p < 0.01
The first column of Table 8 shows that democracy in itself does not play a significant role in portfolio allocation.7 This result is also consistent with Avendaño and Santiso (2009)
who analyse the political regimes of countries of destination for both major mutual funds and sovereign wealth funds. In both cases, for these two types of long-term investors, involved both in bond and equity markets, no democratic premium is observed. The same applies for short-term investors, portfolio bond and equity investors analysed here.
The second column looks at the changes in democracy, distinguishing positive and negative changes. A change is measured by its absolute value, so a negative change of -5 is coded as +5. The coefficient on the negative democracy change variable indicates that a fall in the polity2 score of 1 decreases equity flows by US $3.01 million. A
7 One might be concerned that there is not enough variation within countries for the fixed-effect
36
deterioration of democracy reduces portfolio investorV¶ appetite to invest in the country. A positive change, on the other hand, does not affect portfolio investment significantly. There is no democratic premium in terms of more capital inflows attached to an improvement in the scoring (i.e. quality) of democracy in a given country.
Column 3 replicates column 2 regression but using a random effect estimation. Our concern is that fixed effects standard errors are inflated because of the limited variation in the democracy score within countries. Random effects exploit more variation, though the trade-off is that they need more stringent assumptions to be consistent. Results indicate that our concerns seem justified. The standard error on the negative change coefficient falls, thereby increasing its significance. Columns 4 and 5 check to see that the election results are even after controlling for democracy and changes in democracy levels. If these changes occur mostly directly after an election, then the results of the preceding sections may simply proxy for shifts in democracy levels. We find that both political events matter, with coefficient on the post-presidential election dummy and the negative change in democracy score hardly affected. Results for bond flows are not presented, as no effect whatsoever on democracy is found for them.
X.
Conclusions
This paper examines the reactions of portfolio investors to elections and changes in the quality of democracy. It sheds more light on the relationship between finance and politics by using a large novel database of portfolio flows, which directly tracks the investment decisions of equity and bond holders.
37
ripple in the markets and spreads remained at historically low levels, as there was no policy uncertainty involved in the re-election of Lula.
Results on changes in the quality of democracy similarly tend to corroborate our hypothesis. The level of democracy is not in itself a predictor of portfolio flows, but negative changes are. Less democracy is not good news for investors as this situation is usually accompanied with more risk, arbitrariness and less transparency. However, once this uncertainty is resolved, less democratic regimes enjoy similar levels of portfolio flows than more democratic countries, everything else being equal. Investors tend to value the status quo, at least in terms of policies, and democracies actually pay a price for the change they inherently bring.
38
R
e
f
e
r
e
n
ce
s
Andrade, S. and E. Kohlscheen ³3HVVLPLVWLF )RUHLJQ ,QYHVWRUV DQG 7XUPRLO LQ (PHUJLQJ 0DUNHWV 7KH &DVH RI %UD]LO LQ ´ 8QLYHUVLW\ RI 0LDPL 6FKRRO RI Business Administration and University of Warwick, Economics Department, mimeo (unpublished).
Avendaño, R. and J. Santiso ³$UHVRYHUHLJQZHDOWKIXQGVLQYHVWPHQWVSROLWLFDOO\
ELDVHG"&RPSDULVRQZLWKPXWXDOIXQGV´OECD Development Centre Working Paper, No
283.
Bernhard, W. and D. Leblang ³'HPRFUDWLF3URFHVVHV3ROLWLFDO5LVNDQG)RUHLJQ ([FKDQJH0DUNHWV´$PHULFDQ-RXUQDORI3ROLWLFDO6FLHQFH-333.
Bernhard, W. and D. Leblang (2006), Democratic Processes and Financial Markets:
Pricing Politics, Cambridge, Mass.: Cambridge University Press.
&DPSHOOR ' ³'R PDUNHWV YRWH" $ V\VWHPDWLF DQDO\VLV RI SRUWIROLR LQYHVWRUV¶ UHVSRQVHWRQDWLRQDOHOHFWLRQV´'HSDUWPHQWRI3ROLWLFV3ULQFHWRQ8QLYHUVLW\PLPHR
&DPSRV1DQG)&RULFHOOL³)LQDQFLDOOLEHUDOL]DWLRQ and democracy: The role of
UHIRUPUHYHUVDOV´CEPR Working Paper, 7393. htm
&KDQJ 5 ³)LQDQFLDO &ULVHV DQG 3ROLWLFDO &ULVHV´ Journal of Monetary
Economics, Vol. 54 (8), pp. 2409-2420.
&KDQJ5³(OHFWLRQVFDSLWDOIORZVDQGSROLWLFRHFRQRPLFHTXLOLEULD´American
Economic Review, forthcoming.
(LFKHQJUHHQ % DQG ' /HEODQJ ³'HPRFUDF\ DQG JOREDOL]DWLRQ´BIS Working
Papers, 219.
Ferguson, N. (2008), The Ascent of Money: A Financial History of the World, New York: Penguin Press.
)HUJXVRQ1³3ROLWLFDOULVNDQGWKHLQWHUQDWLRQDOERQGPDUNHWEHWZHHQWKH
5HYROXWLRQDQGWKHRXWEUHDNRIWKH)LUVW:RUOG:DU´Economic History Review, 59 (1):
39
Ferguson T. and H.J. Voth (2008), « Betting on Hitler²The Value of Political Connections in Nazi Germany », Quarterly Journal of Economics, 123 (1), pp. 101-137 )ULHGHQ - 3 *KH]]L DQG ( 6WHLQ ³3ROLWLFV DQG ([FKDQJH 5DWHV $
&URVV-&RXQWU\$SSURDFK´,Q-)ULHGHQDQG(6WHLQHGVThe Currency Game: Exchange-Rate
Politics in Latin America, pp. 20±63. Baltimore, Johns Hopkins University Press.
*RXUHYLWFK 3 3 3LQWR DQG 6 :H\PRXWK ³7KH 3ROLWLFV RI 6WRFN 0DUNHW
'HYHORSPHQW´Review of International Political Economy, Vol. 17, No. 2 Issue 2, pp.
378-409.
-HQVHQ1 66FKPLWK³0DUNHW5HVSRQVHVWR3ROLWLFV7KH5LVHRI/XODDQGWKH
'HFOLQHRI%UD]LOLDQ6WRFN0DUNHW´Comparative Political Studies, Vol. 38 (1), pp.
245-270.
Kohlscheen, E. (2007), "Why are there Serial Defaulters? Evidence from Constitutions",
The Journal of Law and Economics, 50 (4), pp. 713-30.
Kohlscheen, E. (2010), "Sovereign risk: constitutions rule", Oxford Economic Papers, Oxford University Press, vol. 62 (1), pp. 62-85.
Magaloni, B. (2006), Voting for autocracy. Hegemonic Party Survival and its Demise in Mexico, New York: Cambridge University Press.
0DUWtQH]-DQG-6DQWLVR -XO\³)LQDQFLDO PDUNHWVDQGSROLWLFVWKHFRQILGHQFH game in Latin American HPHUJLQJ HFRQRPLHV´International Political Science Review, Vol. 24 (3), pp. 363-397.
0HL - ³3ROLWLFDO 5LVN )LQDQFLDO &ULVLV DQG 0DUNHW 9RODWLOLW\´NYU Working
Paper No. S-MF-99-08 (unpublished).
0RVOH\ / DQG 6 %URRNV ³5LVN 8QFHrtainty and Autonomy: Financial Market &RQVWUDLQWVLQ'HYHORSLQJ1DWLRQV´PLPHR
0RVOH\/DQG$6LQJHU³7DNLQJ6WRFN6HULRXVO\(TXLW\0DUNHW3HUIRUPDQFH
*RYHUQPHQW3ROLF\DQG)LQDQFLDO*OREDOL]DWLRQ´International Studies Quarterly, 52(2),
40
1LHWR 3DUUD 6 DQG - 6DQWLVR D ³5HYLVLWLQJ 3ROLWLFDO %XGJHW &\FOHV LQ /DWLQ
$PHULFD´OECD Development Centre Working Paper No. 281, OECD, Paris.
1LHWR 3DUUD 6 DQG - 6DQWLVR E ³(OHFWLRQV DQG ILQDQFLDO PDUNHWV LQ HPHUJLQJ countULHV $ /DWLQ $PHULFDQ SHUVSHFWLYH´OECD Emerging Markets Network (EmNet) Brief.
1LHWR 3DUUD 6 DQG - 6DQWLVR ³:DOO 6WUHHW DQG (OHFWLRQV LQ /DWLQ $PHULFDQ
(PHUJLQJ 'HPRFUDFLHV´OECD Development Centre Working Paper No. 272, OECD,
Paris.
PastRU / DQG 3 9HURQHVL ³8QFHUWDLQW\ DERXW JRYHUQPHQW SROLF\ DQG VWRFN
SULFHV´NBER Working Paper, 16128.
Spanakos, A.P. & Renno, L.R. and A.P. Spamnakos (2006), « Elections and Economic Turbulence in Brazil: Candidates, Voters and Investors », Latin American Politics and Society, Vol. 48 (4), pp.1-26.
5RGUtJXH]-$DQG-6DQWLVR³%DQNLQJRQ'HPRFUDF\7KH3ROLWLFDO(FRQRP\
RI,QWHUQDWLRQDO3ULYDWH%DQN/HQGLQJLQ(PHUJLQJ'HPRFUDFLHV´ International Political
Science Review, Vol. 29 (2), pp. 213-244.
Santa-&ODUD3DQG59DONDQRY³7KHSUHVLGHQWLDOSX]]OH3ROLWLcal cycles and the stock market´Journal of Finance, Vol. 58, pp. 1841-1872.
6DQWLVR - ³:DOO 6WUHHW DQG WKH 0H[LFDQ &ULVLV $ 7HPSRUDO $QDO\VLV RI
(PHUJLQJ0DUNHWV´International Political Science Review, Vol. 20 (1), pp. 49±72.
Santiso, J. (2003), The Political Economy of Emerging Markets: Actors, Institutions and Crisis in Latin America, New York, Palgrave.
6DQWLVR - /DWLQ $PHULFD¶V 3ROLWLFDO (FRQRP\ RI WKH 3RVVLEOH %H\RQG *RRG Revolutionaries and Free Marketeers, Cambridge, Mass. MIT Press.
6DQWLVR-³$HPHUJHQFLDGRSRVVLELOLVPRQR%UDVLOGRWXcano Cardoso ao Lula
/LJKW´ LQ '¶,QFDR 0$ DQG + 0DUWLQV HGVDemocracia, crise e reforma. Estudos
41
6QRZEHUJ(-:ROIHUVDQG(=LW]HZLW]³3DUWLVDQ,PSDFWV RQWKe Economy:
(YLGHQFH )URP 3UHGLFWLRQ 0DUNHWV DQG &ORVH (OHFWLRQV´ Quarterly Journal of
Economics, Vol., 122 (2), pp. 807-829.
Vaaler, P., B. Schrage, and S. Block (2005), "Counting the Investor Vote: Political Business Cycle Effects on Sovereign Spreads iQ 'HYHORSLQJ &RXQWULHV´Journal of