An Analysis of the Process of Adopting Local Digital Currencies in Support of Sustainable Development
19
0
0
Texto completo
(2) Sustainability 2019, 11, 849. 2 of 19. currencies (7.1%), and exchange systems (1.4%). Before continuing, it is important to point out that our work was conducted using the classification of [3], because it is the only classification that, in the current situation, allows us to quantify the presence of local digital currency (LDC)-based communities, both in Spain and around the world. Most time banks and mutual credit systems work in a digital format, as do a large number of local currencies, and it may be considered that at least 91.5% of the presently existing complementary currencies operate in a digital format [5]. Such a high percentage, together with the present and future repercussion of information and communication technologies (ICT) in the implementation and consolidation of technological innovations, mean that we can justify the research carried out into complementary currencies that operate, solely and exclusively, in the digital domain—that is, local digital currencies (LDCs). Despite the commitment to sustainable development, the use of complementary currencies is still very marginal and incipient, with relatively short lifecycles [3,5,17]. To understand why all this should be the case, in this research, we have set the general goal of modelling and analysing human behaviour associated with the use of LDCs. There are currently very few empirical analyses examining this, and the few that do exist have incomplete approaches with wildly varying methodologies, making their comparison and integration difficult [7,18–22]. To provide a response to this generic goal, three different specific goals have been defined: develop a conceptual model for the LDC adoption process; analyse this model, evaluating causal and measurement-related relationships between the existing variables; and analyse the moderating effect of subjects’ prior experience in LDCs. 1.1. Theoretical and Conceptual Framework LDCs can be regarded as a means to facilitate exchanges and transactions online, and is characterised by not using official legal tender, representing a technological innovation in the sharing economy [23,24]. Therefore, human behaviour associated with LDCs can be analysed by means of behavioural models based on attitudes and the adoption of technological innovations, such as the theory of reasoned action, or TRA [25], the theory of planned behaviour, or TPB [26], or its subsequent decomposition into decomposed theory of planned behaviour (DTPB) beliefs [27]. The theory of planned behaviour, or TPB [26], represents an extension of the TRA [25] to increase the predictive capacity in the case of behaviour over which there is limited control [28]. According to the TPB, behavioural intention (BEIN), as an antecedent of behaviour, is preceded by three different variables: attitude (ATTI) or assessment of the result of carrying out a behaviour; the subjective norm (NORM) or perception of the normative social pressure to carry out a behaviour; and perceived control (CONT) or assessment of one’s capacity to carry out a behaviour. Attitude, subjective norm, and perceived control are all preceded by a series of generic beliefs. For its part, the DTPB [27] is a development of TPB that explores the dimensions of attitude, subjective norm, and perceived behavioural control, decomposing them into specific beliefs applicable in all contexts. The DTPB provides greater consistency with the antecedents to behavioural intention and a greater predictive capacity than the non-decomposed version [29]. Whilst the TPB explains 51% of behaviour, the DTPB reaches up to 60%, whilst also providing a better goodness of fit [30]. In other words, by deconstructing the background data into different elements, greater consistency is given to the model, which does not depend solely on the items of those historical data. Moreover, the results obtained have a greater predictive capacity as new elements are introduced, all of which occurs without conferring any adverse effects on the goodness of fit of the model, but rather the reverse. The DTPB proposes three attributes as determinants of attitude: perceived usefulness (USEF), or the degree to which a person believes that the use of a given system will improve his or her performance [31]; ease of use (EASE), or the degree to which a given system is regarded as simple to use [31]; and compatibility (COMP), or the degree to which an innovation fits with the current needs and past experiences [32]. In the case of the subjective norm, two attributes are proposed as.
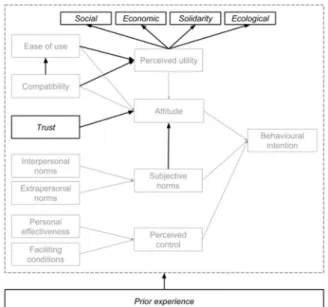
(3) Sustainability 2019, 11, 849. 3 of 19. Sustainability 2019, 11, 849. 3 of 19. determinants [33]: interpersonal influences (INTE), or thoseand of friends and relations; and extra-personal personal influences (EXTR), or those of the media experts. For perceived control, its influences (EXTR), or those of the media and experts. For perceived control, its decomposition is decomposition is based on two different attributes [27]: self-efficacy (EFFI), or confidence in carrying based on two different attributes [27]: self-efficacy (EFFI), in carrying out a behaviour; out a behaviour; and facilitating conditions (COND), or or theconfidence availability of the resources that are and facilitating conditions (COND), or the availability of the resources that are required to carry it out. required to carry it out. In the case of means to facilitate online exchanges and transactions, the determining factors In the case of means to facilitate online exchanges and transactions, the determining factors for for behavioural intention identified in a number of studies demographic behavioural intention have have been been identified in a number of studies [34–36]: [34–36]: demographic features, features, personality, service quality, website quality, brand effect, commercial motivation, personality, service quality, website quality, brand effect, commercial motivation, trust, trust, prior prior experience, As detailed and justified later this research hasinto taken into account only experience, etc. Asetc. detailed and justified later on, thison, research has taken account only two of two of these factors (Figure 1): Trust (TRUS) as an attitude-related belief, and prior experience as these factors (Figure 1): Trust (TRUS) as an attitude-related belief, and prior experience as aa moderating DTPB moderating variable. variable. Additionally, Additionally, we we have have introduced introduced aa series series of of extensions extensions (Figure (Figure 1) 1) into into the the DTPB itself, itself, such such as as the the decomposition decomposition of of perceived perceived usefulness usefulness into into four four different different dimensions dimensions (the (the social social (SOCI), the prosocial (PROS), the economic (ECON), and the environmental (ENVI)), as well as (SOCI), the prosocial (PROS), the economic (ECON), and the environmental (ENVI)), as well as the the incorporation incorporation of of new new causal causal relationships. relationships.. Figure 1. The (DTPB) model with additional factors The original originaldecomposed decomposedtheory theoryofofplanned plannedbehaviour behaviour (DTPB) model with additional facand extensions. tors and extensions.. 1.2. Research Hypotheses and Question 1.2. Research Hypotheses and Question On the basis of the DTPB, as well as the additional factors and extensions incorporated, the causal On the basis of the DTPB, as well as the additional factors and extensions incorporated, the and measurement hypotheses are set out below, as well as the research question making up the causal and measurement hypotheses are set out below, as well as the research question making up study model. the study model. 1.2.1. Causal Hypotheses 1.2.1. Causal Hypotheses The influence of attitudes on e-purchase intention has been tested by TPB-based research [37–39], The influence of attitudes on e-purchase intention has been tested by TPB-based research [37– amongst others. On this basis, and on that of the DTPB itself, we propose the following hypothesis: 39], amongst others. On this basis, and on that of the DTPB itself, we propose the following hypothesis: 1 (H1). An individual’s attitude (ATTI) towards LDCs has a direct and positive influence upon Hypothesis their intention1 (BEIN) to individual’s use them. attitude (ATTI) towards LDCs has a direct and positive influence upon Hypothesis (H1). An their intention (BEIN) to use them. The models of [31,40–42], amongst others, provide support for the influence of usefulness and The of models of [31,40–42], provide support for the influence usefulness the ease use upon attitudes,amongst both in others, the sphere of new technologies [43], andof that of meansand to the ease of use upon attitudes, both in the sphere of new technologies [43], and that of thesis meansthat to facilitate online exchanges and transactions [44–46]. In this latter case, [44,47] supported the facilitate online exchanges and transactions [44–46]. In this latter case, [44,47] supported the thesis compatibility influences attitude in online purchasing. Based on this, and on that of the DTPB itself, thatpropose compatibility influences attitude in online purchasing. Based on this, and on that of the DTPB we the following hypotheses: itself, we propose the following hypotheses:. Hypothesis 2 (H2). Perceived usefulness (USEF) in the use of LDCs has a direct and positive influence upon the attitude (ATTI) towards said behaviour..
(4) Sustainability 2019, 11, 849. 4 of 19. Hypothesis 2 (H2). Perceived usefulness (USEF) in the use of LDCs has a direct and positive influence upon the attitude (ATTI) towards said behaviour. Hypothesis 3 (H3). Perceived ease of use (EASE) of LDCs has a direct and positive influence upon the attitude (ATTI) towards said behaviour. Hypothesis 4 (H4). Perceived compatibility (COMP) in the use of LDCs has a direct and positive influence upon the attitude (ATTI) towards said behaviour. Perceived usefulness in an innovation is affected by ease of use [38,48–50]. Additionally, [51] incorporated compatibility into Davis’s model (1989), and suggested its direct relationship with perceived usefulness and ease of use, something that is consistent with the approaches of [27] in interrelating the different groups of belief. Accordingly, we propose the following hypotheses: Hypothesis 5 (H5). The perceived ease of use (EASE) of LDCs has a direct and positive influence upon perceived usefulness (USEF) in said behaviour. Hypothesis 6 (H6). Perceived compatibility (COMP) in the use of LDCs has a direct and positive influence upon perceived usefulness (USEF) in said behaviour. Hypothesis 7 (H7). Perceived compatibility (COMP) in the use of LDCs has a direct and positive influence upon perceived ease of use (EASE) in said behaviour. Trust is the belief that the other party will behave in an ethical and trustworthy manner [52]. [44,53,54], amongst others, have shown that trust influences attitudes towards online purchasing. Accordingly, we propose the following hypothesis: Hypothesis 8 (H8). Trust (TRUS) in the rest of LDC users has a direct and positive influence upon the attitude (ATTI) towards the use of these kinds of communities. In the case of means to facilitate online exchanges and transactions, [37,38], amongst others, obtained empirical evidence in support of the significant effect of the subjective norm upon behavioural intention. On this basis, and on that of the DTPB itself, we propose the following hypothesis: Hypothesis 9 (H9). The subjective norm (NORM) with regard to the use of LDCs has a direct and positive influence upon the intention (BEIN) to use them. Gatignon and Robertson’s model (1985) pointed to the effect of social groups upon individuals’ attitudes. Other authors [43,55] confirmed the significance of social influence upon attitudes towards an innovation. Accordingly, we propose the following hypothesis: Hypothesis 10 (H10). The subjective norm (NORM) with regard to the use of LDCs has a direct and positive influence upon the attitude (ATTI) towards said behaviour. As specified by [38], different points of reference have influence on the subjective norm on the adoption of technological innovations. Together with interpersonal groups such as friends and family, [56,57] pointed to the extra-personal influences of other Internet users. Based on this, and on that of the DTPB itself, we propose the following hypotheses: Hypothesis 11 (H11). Interpersonal influences (INTE) with regard to the use of LDCs have a direct and positive influence upon the subjective norm (NORM) with regard to said behaviour..
(5) Sustainability 2019, 11, 849. 5 of 19. Hypothesis 12 (H12). Extra-personal influences (EXTR) with regard to the use of LDCs have a direct and positive influence upon the subjective norm (NORM) with regard to said behaviour. In the field of means to facilitate online exchanges and transactions, [37,45,58,59], amongst others, noted that perceived control has a positive effect upon the intention to adopt said behaviour. On this basis, and on that of the DTPB itself, we propose the following hypothesis: Hypothesis 13 (H13). The control perceived (CONT) by individuals regarding the use of LDCs has a direct and positive influence upon the intention (BEIN) to use them. In the field of new technologies, [27] distinguished between two different antecedents for perceived control: the self-efficacy perceived by the individual and the existing facilitating conditions. [37] incorporated both variables as components of perceived control and observed a significant effect on behavioural intention. Accordingly, and on the basis of the DTPB itself, we propose the following hypotheses: Hypothesis 14 (H14). The self-efficacy perceived (EFFI) by the individual regarding the use of LDCs has a direct and positive influence upon the perceived control (CONT) regarding said behaviour. Hypothesis 15 (H15). The existing facilitating conditions (FACI) for the use of LDCs have a direct and positive influence upon the perceived control (CONT) regarding said behaviour. 1.2.2. Measurement-Based Hypotheses Although, traditionally, perceived usefulness has been regarded as a one-dimensional concept, in the field of the sharing economy and complementary currencies, a number of authors have posited the need to analyse it from a multidimensional standpoint [10,20,60–64]. Therefore, our proposal is to decompose perceived usefulness into the four most representative dimensions within the context of this study: the social, the prosocial, the economic, and the environmental. Accordingly, we propose the following hypotheses: Hypothesis 16 (H16). (H16.1)—Perceived usefulness (USEF) with regard to the use of LDCs is determined by perceived usefulness on a social level (SOCI). (H16.2)—Perceived usefulness (USEF) with regard to the use of LDCs is determined by perceived usefulness on a prosocial level (PROS). (H16.3)—Perceived usefulness (USEF) with regard to the use of LDCs is determined by perceived usefulness on an economic level (ECON). (H16.4)—Perceived usefulness (USEF) with regard to the use of LDCs is determined by perceived usefulness on an environmental level (ENVI). 1.2.3. The Research Question Studies associated with means to facilitate online exchanges and transactions, such as those of [52,53,65], amongst others, have explored the role of prior experience, associating it with subsequent behavioural intentions and suggesting that it helps reduce consumer uncertainty. According to these studies, the experience acquired by individuals who have already performed a certain behaviour in the past has an influence on the shaping of their attitudes, perception, and beliefs, and ultimately conditions subsequent repetition. It also affects the strength of the causal relations between intent, historical background, and current behaviour. Accordingly, we set the following research question: Question 1 (P1). Does the magnitude of the relationships established between the model’s variables differ between individuals with and without prior experience in LDCs? Or, put another way, does it depend upon whether the behaviour is new or repeated? Responding to the research question that is raised will help discern whether the reason for the marginality in the use of LDCs could be related to single strategies being used to promote their use,.
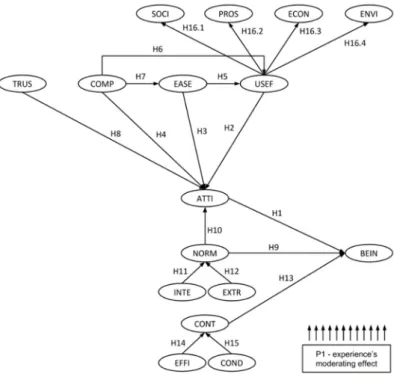
(6) Sustainability 2019, 11, 849. 6 of 19. regardless of previous user experience. If these strategies are erroneous, it could occur that potential new users never get to register, or that potential users who are obliged to re-register never do so. 1.2.4. Summary of Hypotheses and Research Question Figure 2 shows the resulting research model, with the hypotheses raised, both causal (H1 and of 19 (H16.1 to H16.4), and the research question that was formulated6(P1).. Sustainability 2019, 11, 849 H15) and measurement-related. Figure 2. 2. Hypotheses Hypotheses and and research research question. question. SOCI: SOCI: social, social, PROS: PROS: prosocial, prosocial, ECON: ECON: economic, economic, ENVI: ENVI: Figure environmental, TRUS: trust, COMP: compatibility, EASE: ease of use, USEF: perceived usefulness, ATTI: environmental, TRUS: trust, COMP: compatibility, EASE: ease of use, USEF: perceived usefulness, attitude, NORM: subjective norm, BEIN: behavioural intention, INTE: interpersonal influences, EXTR: ATTI: attitude, NORM: subjective norm, BEIN: behavioural intention, INTE: interpersonal influences, extra-personal influences, CONT: perceived control, EFFI: self-efficacy, COND: facilitating conditions. EXTR: extra-personal influences, CONT: perceived control, EFFI: self-efficacy, COND: facilitating conditions. 2. Materials and Methods. 2. Materials and Methods 2.1. Data Gathering DataGathering was gathered by means of an online questionnaire sent by email or published on the 2.1. Data Universitat Oberta de Catalunya (UOC) Virtual Campus, depending on the study population. Prior to Data was gathered by means of an online questionnaire sentThis by email or published on the the submission of this questionnaire, a pre-test was carried out. allowed the identification Universitat Oberta de Catalunya (UOC) Virtual Campus, depending on the study population. and/or elimination of possible problems in the content of the questions, their wording, form,Prior and to the submission of relation this questionnaire, a pre-test was carried out. some This allowed the identification distribution [27]. In to the online questionnaire, and after initial sociodemographic and/or elimination of possible problems in thejob, content the questions, their wording, and identification questions (age, gender, residence, familyofsituation, and educational level), form, it set forth distribution [27]. In relation to the online questionnaire, and after some initial sociodemographic a series of statements associated with the subjects’ perceptions, beliefs, attitudes, and behavioural identification questions gender, residence, job,a Likert family scale situation, educational level), it set intentions, which had to(age, be responded to by using from and one (completely disagree) to forth a series of statements associated with the subjects’ perceptions, beliefs, attitudes, and seven (completely agree). The research was aimed at those individuals who are habitual Internet behavioural had toeffect be responded to by usinginaLDCs, Likert and scaleexamining from one whether (completely users [66]. Tointentions, assess thewhich moderating of prior experience the disagree) to seven (completely agree). The research was aimed at those individuals who are habitual different relationships studied present variations according to that experience, a distinction was drawn Internet [66]. To groups: assess the moderating effect of prioralumni, experience LDCs, and examining between users two different Population 1 (UOC students, staff,inand partners), contacted whether different relationships studied present variations according to that experience, a by meansthe of the UOC Virtual Campus, and Population 2 (users of time banks, eco-networks, and distinction was drawn between two different groups: Population 1 (UOC students, alumni, staff, and social currency networks within Spain), contacted by means of an email sent to the managers of the partners), means offor thethis UOC Virtual Campus, 2 (users of time banks, respective contacted platforms.by The reason distinction was that and usersPopulation in Population 1, a priori, were not eco-networks, and any social currency with networks Spain), contacted of an email sent to supposed to have experience LDCswithin (although, in fact, 12.8%by of means them did admit to having the managers respective platforms. The forofthis distinction wasexperience that users through in Population experience, as of wethe shall see below), while all of reason the users Population 2 had being 1, a priori, were not supposed to have any experience with LDCs (although, in fact, 12.8% of them did admit to having experience, as we shall see below), while all of the users of Population 2 had experience through being members of an LDC. Taking into consideration that the person surveyed had no knowledge of LDCs and what they represent, a brief conceptual introduction to LDCs was included at the beginning of the questionnaire.
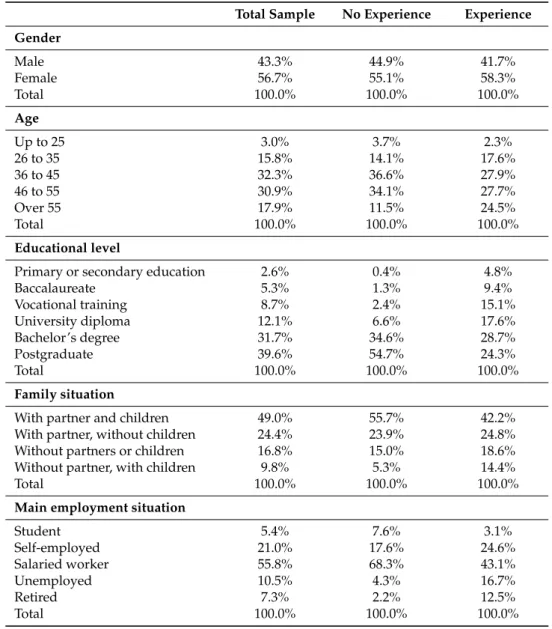
(7) Sustainability 2019, 11, 849. 7 of 19. members of an LDC. Taking into consideration that the person surveyed had no knowledge of LDCs and what they represent, a brief conceptual introduction to LDCs was included at the beginning of the questionnaire Of the 126,587 subjects surveyed, the total sample gathered comprised 1559 (1.23%) subjects: 901 (0.83%) of the 108,587 from Population 1 and 658 (3.06%) of the 21,500 from Population 2. Despite the low level of participation, the total number of samples collected was sufficient to be able to perform the statistical analysis presented below. Before going on, it is important to highlight that in the case of Population 2, there is no current official register of the number and typology of communities that exist in Spain. Ad hoc research based on websites and the collaboration of entities and activists in the area of study had to be performed in order to determine and quantify Population 2. At a confidence level of 95.5%, sampling errors of 3.33% and 3.76% were obtained for Population 1 and Population 2, respectively. Regarding gender, 56.4% of Sample 1 and 52.9% of Population 1 as a whole were female. In the case of Sample 2, 59.7% were female (57.0% of Population 2). In terms of experience, 49.6% of the total sample, 12.8% of Sample 1, and 100.0% of Sample 2 were subjects with prior experience in LDCs. Table 1 shows the sociodemographic characteristics of the participants. Table 1. Sociodemographic characteristics. Total Sample. No Experience. Experience. 43.3% 56.7% 100.0%. 44.9% 55.1% 100.0%. 41.7% 58.3% 100.0%. 3.0% 15.8% 32.3% 30.9% 17.9% 100.0%. 3.7% 14.1% 36.6% 34.1% 11.5% 100.0%. 2.3% 17.6% 27.9% 27.7% 24.5% 100.0%. 2.6% 5.3% 8.7% 12.1% 31.7% 39.6% 100.0%. 0.4% 1.3% 2.4% 6.6% 34.6% 54.7% 100.0%. 4.8% 9.4% 15.1% 17.6% 28.7% 24.3% 100.0%. 49.0% 24.4% 16.8% 9.8% 100.0%. 55.7% 23.9% 15.0% 5.3% 100.0%. 42.2% 24.8% 18.6% 14.4% 100.0%. 5.4% 21.0% 55.8% 10.5% 7.3% 100.0%. 7.6% 17.6% 68.3% 4.3% 2.2% 100.0%. 3.1% 24.6% 43.1% 16.7% 12.5% 100.0%. Gender Male Female Total Age Up to 25 26 to 35 36 to 45 46 to 55 Over 55 Total Educational level Primary or secondary education Baccalaureate Vocational training University diploma Bachelor’s degree Postgraduate Total Family situation With partner and children With partner, without children Without partners or children Without partner, with children Total Main employment situation Student Self-employed Salaried worker Unemployed Retired Total.
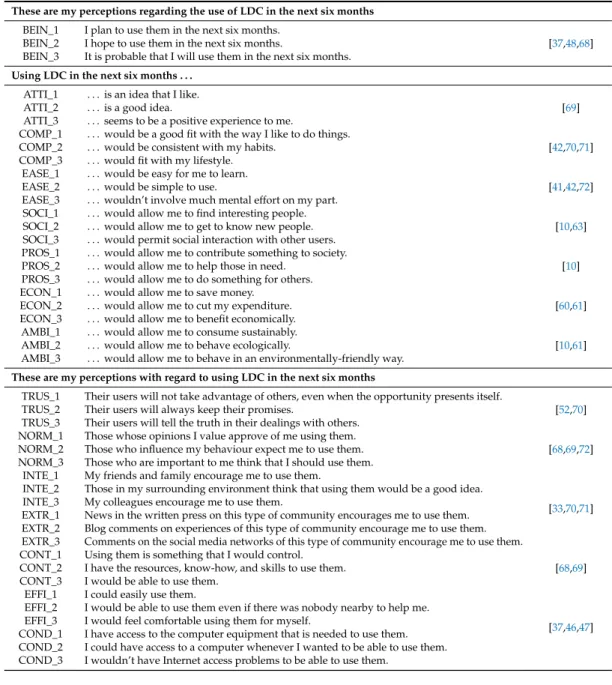
(8) Sustainability 2019, 11, 849. 8 of 19. 2.2. Definition of Measurement Scales Over the course of 2017, work was carried out on the basis of the data collected. This began by measuring the variables, using composite scales, which allow for the assessment of variables that are not directly observable [67]. To this end, we had to specify the behaviour to be analysed [25]: “using a LDC to carry out transactions in the next six months”. For its part, behavioural intention was regarded as a dependent variable and a direct antecedent to the LDC adoption process [37,52]. Given that the research model is fundamentally based on the DTPB, the definition of the majority of items has been based on Taylor and Todd’s original work (1995), which has been adapted to the context based on prior research. For the remaining scales, existing literature of the field of study was analysed. Table 2 below shows the items used and the bibliography referenced. Table 2. Items on the measurement scale and bibliography referenced. LDC: local digital currency. These are my perceptions regarding the use of LDC in the next six months BEIN_1 BEIN_2 BEIN_3. I plan to use them in the next six months. I hope to use them in the next six months. It is probable that I will use them in the next six months.. [37,48,68]. Using LDC in the next six months . . . ATTI_1 ATTI_2 ATTI_3 COMP_1 COMP_2 COMP_3 EASE_1 EASE_2 EASE_3 SOCI_1 SOCI_2 SOCI_3 PROS_1 PROS_2 PROS_3 ECON_1 ECON_2 ECON_3 AMBI_1 AMBI_2 AMBI_3. ... ... ... ... ... ... ... ... ... ... ... ... ... ... ... ... ... ... ... ... .... is an idea that I like. is a good idea. seems to be a positive experience to me. would be a good fit with the way I like to do things. would be consistent with my habits. would fit with my lifestyle. would be easy for me to learn. would be simple to use. wouldn’t involve much mental effort on my part. would allow me to find interesting people. would allow me to get to know new people. would permit social interaction with other users. would allow me to contribute something to society. would allow me to help those in need. would allow me to do something for others. would allow me to save money. would allow me to cut my expenditure. would allow me to benefit economically. would allow me to consume sustainably. would allow me to behave ecologically. would allow me to behave in an environmentally-friendly way.. [69]. [42,70,71]. [41,42,72]. [10,63]. [10]. [60,61]. [10,61]. These are my perceptions with regard to using LDC in the next six months TRUS_1 TRUS_2 TRUS_3 NORM_1 NORM_2 NORM_3 INTE_1 INTE_2 INTE_3 EXTR_1 EXTR_2 EXTR_3 CONT_1 CONT_2 CONT_3 EFFI_1 EFFI_2 EFFI_3 COND_1 COND_2 COND_3. Their users will not take advantage of others, even when the opportunity presents itself. Their users will always keep their promises. Their users will tell the truth in their dealings with others. Those whose opinions I value approve of me using them. Those who influence my behaviour expect me to use them. Those who are important to me think that I should use them. My friends and family encourage me to use them. Those in my surrounding environment think that using them would be a good idea. My colleagues encourage me to use them. News in the written press on this type of community encourages me to use them. Blog comments on experiences of this type of community encourage me to use them. Comments on the social media networks of this type of community encourage me to use them. Using them is something that I would control. I have the resources, know-how, and skills to use them. I would be able to use them. I could easily use them. I would be able to use them even if there was nobody nearby to help me. I would feel comfortable using them for myself. I have access to the computer equipment that is needed to use them. I could have access to a computer whenever I wanted to be able to use them. I wouldn’t have Internet access problems to be able to use them.. [52,70]. [68,69,72]. [33,70,71]. [68,69]. [37,46,47]. 2.3. Data Analysis Methodology After descriptive analysis (DA) of the data, which is required to be able to identify the possibly anomalous behaviour within it, we proceeded to corroborate its univariate and multivariate normality..
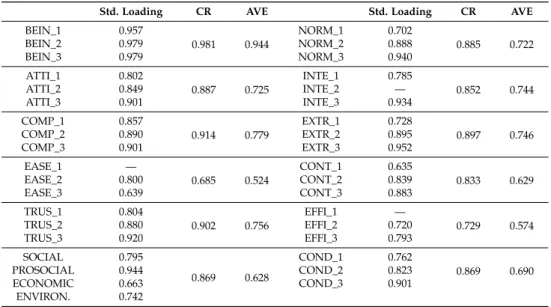
(9) Sustainability 2019, 11, 849. 9 of 19. Once we corroborated all that, we carried out confirmatory factor analysis (CFA) for both the identification of the measurement model and the analysis of its goodness of fit, reliability, and convergent and discriminant validity. The following step was structural equation modelling (SEM), including analysis of the goodness of fit of the structural model and its nomological validity. Lastly, multigroup analysis (MGA) was performed to analyse the moderating effect of prior experience. To do this, the sample was divided into the two groups that were necessary to carry out the corresponding comparison (with and without prior experience). To perform these analyses, we used the efficient, non-skewed maximum likelihood method, as well as the AMOS v22 module of the SPSS v21 statistics package. 3. Results and Discussion 3.1. Confirmatory Factor Analysis After identification of the measurement model, its goodness of fit was analysed:. •. •. •. Absolute: X2 /df = 4.768, below 5.0 [73]; GFI = 0.901, above 0.9 [74]; SRMR = 0.051, below 0.08 [75]; and RMSEA = 0.049, below 0.08 [76]. Notes: X2 (minimum fit function chi-square), df (degrees of freedom), GFI (goodness-of-fit index), SRMR (standardised root mean square residual), and RMSEA (root mean square error of approximation). Incremental: AGFI = 0.879, not above 0.9 [74]; TLI = 0.946, above 0.9 [77]; NFI = 0.942, above 0.9 [78]; CFI = 0.953, above 0.9 [79]; and IFI = 0.953, above 0.9 [80]. Notes: AGFI (adjusted goodness-of-fit index), TLI (Tucker–Lewis index), NFI (normed fit index), CFI (comparative fit index), and IFI (incremental fit index). Parsimonious: PGFI = 0.740, PNFI = 0.812 and PCFI = 0.822, all above 0.5 [81]. Notes: PGFI (parsimonious goodness-of-fit index), PNFI (parsimonious normed fit index), and PCFI (parsimonious comparative fit index).. Although the AGFI parameter does not exceed the established threshold of 0.9 [74], ref [82] suggested that the said parameter may be regarded as valid above 0.85. Accordingly, it is confirmed that the measurement model presents an adequate goodness of fit. The modification of the coefficients that were analysed eliminated four items: EASE_1, INTE_2, EFFI_1, and ENVI_1. Analysis of the reliability and convergent validity has been carried out by analysing the standardised factor loadings, as well as the composite reliability (CR) and average variance extracted (AVE) parameters. As can be seen from Table 3, all of the factor loadings were above 0.5 [83]. As far as the CR factor is concerned, the values were always in an excess of 0.7 [83], except for the scale associated with ease of use, which showed a value of 0.685 (its closeness to the minimum recommended value and the validation of the rest of the parameters for the said scale mean that can be validated). For all of the measurement scales, AVE values of above 0.5 were obtained [84]. Thus, the measurement model’s adequate reliability and convergent validity is corroborated. Discriminant validity analysis was performed using the confidence interval and variance extracted tests. As Table 4 shows, the range between the correlation coefficient plus and minus twice its typical error never includes one [83], whilst the square root of the AVE of the factors is greater than the correlation of said factor with the remaining factors (only in three cases was this criterion not met, although it takes place between pairs of variables that are causally and directly related in the DTPB). This, together with this representing a very small percentage of cases and could be due to coincidences [85], means that this test can be validated. Accordingly, it is confirmed that the measurement model has adequate discriminant validity..
(10) Sustainability 2019, 11, 849. 10 of 19. Table 3. Reliability and convergent validity of the measurement model. CR: composite reliability, AVE: average variance extracted. Std. Loading. CR. Std. Loading. CR. AVE. 0.944. NORM_1 NORM_2 NORM_3. 0.702 0.888 0.940. 0.885. 0.722. 0.887. 0.725. INTE_1 INTE_2 INTE_3. 0.785 — 0.934. 0.852. 0.744. 0.857 0.890 0.901. 0.914. 0.779. EXTR_1 EXTR_2 EXTR_3. 0.728 0.895 0.952. 0.897. 0.746. EASE_1 EASE_2 EASE_3. — 0.800 0.639. 0.685. 0.524. CONT_1 CONT_2 CONT_3. 0.635 0.839 0.883. 0.833. 0.629. TRUS_1 TRUS_2 TRUS_3. 0.804 0.880 0.920. 0.902. 0.756. EFFI_1 EFFI_2 EFFI_3. — 0.720 0.793. 0.729. 0.574. SOCIAL PROSOCIAL ECONOMIC ENVIRON.. 0.795 0.944 0.663 0.742. 0.869. 0.628. COND_1 COND_2 COND_3. 0.762 0.823 0.901. 0.869. 0.690. BEIN_1 BEIN_2 BEIN_3. 0.957 0.979 0.979. 0.981. ATTI_1 ATTI_2 ATTI_3. 0.802 0.849 0.901. COMP_1 COMP_2 COMP_3. AVE. Table 4. Discriminant validity of the measurement model. Note: The diagonal includes the square root of each factor’s AVE. Below the diagonal are the correlations between the different factors, whilst above it are the associated confidence intervals. Abbreviations: subjective norm (NORM), attitude (ATTI), ease of use (EASE), compatibility (COMP), trust (TRUS), extra-personal influences (EXTR), facilitating conditions (COND), behavioural intention (BEIN), perceived usefulness (USEF), interpersonal influences (INTE), self-efficacy (EFFI) and perceived control (CONT). NORM. ATTI. EASE. COMP. TRUS. EXTR. COND. BEIN. USEF. INTE. EFFI. CONT. NORM. 0.849. 0.430 0.517. 0.378 0.483. 0.506 0.585. 0.513 0.592. 0.717 0.768. 0.132 0.237. 0.555 0.626. 0.469 0.556. 0.941 0.968. 0.347 0.452. 0.328 0.426. ATTI. 0.474. 0.852. 0.636 0.723. 0.815 0.858. 0.495 0.578. 0.449 0.536. 0.427 0.518. 0.619 0.682. 0.826 0.869. 0.406 0.497. 0.670 0.7489. 0.615 0.686. EASE. 0.431. 0.680. 0.724. 0.643 0.726. 0.405 0.510. 0.335 0.444. 0.396 0.501. 0.492 0.587. 0.592 0.687. 0.382 0.491. 0.671 0.769. 0.685 0.768. COMP. 0.546. 0.837. 0.685. 0.883. 0.538 0.613. 0.487 0.566. 0.315 0.413. 0.677 0.732. 0.731 0.786. 0.490 0.573. 0.658 0.737. 0.572 0.647. TRUS. 0.553. 0.537. 0.458. 0.576. 0.869. 0.495 0.574. 0.215 0.316. 0.472 0.551. 0.552 0.631. 0.495 0.578. 0.465 0.563. 0.352 0.447. EXTR. 0.743. 0.493. 0.390. 0.527. 0.535. 0.864. 0.113 0.218. 0.525 0.596. 0.485 0.568. 0.744 0.795. 0.380 0.481. 0.318 0.416. COND. 0.185. 0.473. 0.449. 0.364. 0.266. 0.166. 0.831. 0.179 0.280. 0.337 0.435. 0.101 0.210. 0.624 0.707. 0.718 0.777. BEIN. 0.591. 0.651. 0.540. 0.705. 0.512. 0.561. 0.230. 0.972. 0.497 0.576. 0.560 0.631. 0.565 0.648. 0.514 0.593. USEF. 0.513. 0.848. 0.640. 0.759. 0.592. 0.527. 0.386. 0.537. 0.793. 0.446 0.537. 0.535 0.630. 0.477 0.568. INTE. 0.955. 0.452. 0.437. 0.532. 0.537. 0.770. 0.156. 0.596. 0.492. 0.863. 0.327 0.436. 0.301 0.402. EFFI. 0.400. 0.710. 0.720. 0.698. 0.514. 0.431. 0.666. 0.607. 0.583. 0.382. 0.757. 0.885 0.940. CONT. 0.377. 0.651. 0.717. 0.610. 0.400. 0.367. 0.748. 0.554. 0.523. 0.352. 0.913. 0.793. 3.2. Structural Equation Modelling and Presentation of Results Firstly, the structural model’s goodness of fit was analysed:. • • •. Absolute fit: X2 /df = 4.939, below 5.0 [73]; GFI = 0.892, not above 0.9 [74]; SRMR = 0.058, below 0.08 [75]; and RMSEA = 0.050, below 0.08 [76]. Incremental fit: AGFI = 0.874, not above 0.9 [74]; TLI = 0.943, above 0.9 [77]; NFI = 0.937, above 0.9 [78]; CFI = 0.949, above 0.9 [79]; and IFI = 0.949, above 0.9 [80]. Parsimonious fit: PGFI = 0.765, PNFI = 0.844 and PCFI = 0.855, all above 0.5 [81]..
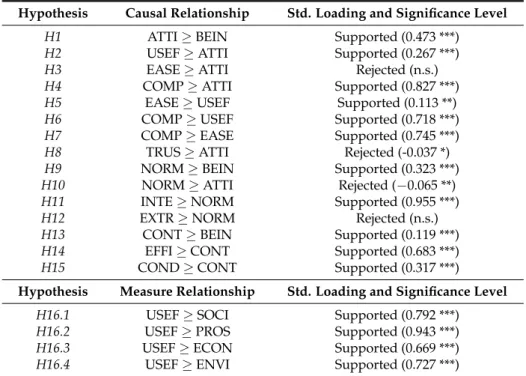
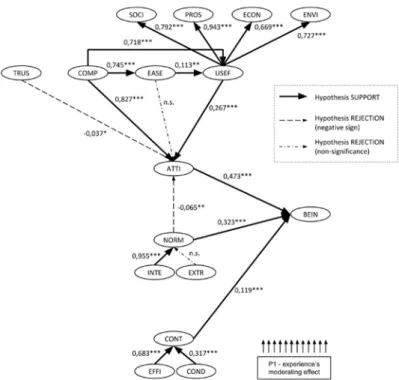
(11) Sustainability 2019, 11, 849. 11 of 19. Although GFI and AGFI do not exceed the established threshold of 0.9 [74], ref [82] suggested that the said parameter may be regarded as valid above 0.85. Accordingly, it is confirmed that the structural model has an adequate goodness of fit. For the structural model being analysed, we compared the three indicators of goodness of fit (RMSEA = 0.050, CFI = 0.949 and TLI = 0.943) with different, less saturated models. Removing three of the proposed causal relationships generated the same or marginally worse adjustment indices than the model that was analysed: relation of compatibility with perceived usefulness (RMSEA = 0.051. CFI = 0.947, and TLI = 0.941), relation of ease-of-use with perceived usefulness (RMSEA = 0.050, CFI = 0.949, and TLI = 0.943), and relation of the subjective norm with attitude (RMSEA=0.050, CFI=0.949 and TLI = 0.943). Only removing compatibility with ease-of-use resulted in slightly better adjustment indices (RMSEA = 0.049, CFI = 0.952, and TLI = 0.946). Hence, we opted to keep all the causal relationships for their theoretical contribution. Our decisions was based on the following: ref [51] proposed that there are direct relationships between compatibility and both utility and ease-of-use; and [27] recommended testing the whole DTPB. Table 5 displays the results that should allow us to assess the nomological validity and the support and/or rejection of the research hypotheses that were initially formulated. As can be seen, a total of 15 of the 19 hypotheses formulated have been supported, whilst the four remaining ones have had to be rejected (H3 and H12 as not being statistically significant, and H8 and H10 because they present factor loadings with the contrary sign to that proposed in the hypotheses). Table 5. Support or rejection of research hypotheses: *** (p < 0.001) ** (p < 0.05) * (p < 0.10). Hypothesis. Causal Relationship. Std. Loading and Significance Level. H1 H2 H3 H4 H5 H6 H7 H8 H9 H10 H11 H12 H13 H14 H15. ATTI ≥ BEIN USEF ≥ ATTI EASE ≥ ATTI COMP ≥ ATTI EASE ≥ USEF COMP ≥ USEF COMP ≥ EASE TRUS ≥ ATTI NORM ≥ BEIN NORM ≥ ATTI INTE ≥ NORM EXTR ≥ NORM CONT ≥ BEIN EFFI ≥ CONT COND ≥ CONT. Supported (0.473 ***) Supported (0.267 ***) Rejected (n.s.) Supported (0.827 ***) Supported (0.113 **) Supported (0.718 ***) Supported (0.745 ***) Rejected (-0.037 *) Supported (0.323 ***) Rejected (−0.065 **) Supported (0.955 ***) Rejected (n.s.) Supported (0.119 ***) Supported (0.683 ***) Supported (0.317 ***). Hypothesis. Measure Relationship. Std. Loading and Significance Level. H16.1 H16.2 H16.3 H16.4. USEF ≥ SOCI USEF ≥ PROS USEF ≥ ECON USEF ≥ ENVI. Supported (0.792 ***) Supported (0.943 ***) Supported (0.669 ***) Supported (0.727 ***). Figure 3 provides a graphical representation of the structural model, indicating the standard factor loadings of the different relationships, their statistical significance, and the support or rejection of the associated hypotheses. Eleven of the 15 hypotheses that were formulated are supported, while the four remaining hypotheses have had to be rejected (two of them because they are not statistically significant, and the other two because they have standard loads of the opposite sign to the one initially proposed)..
(12) Sustainability 2019, 11, 849 Sustainability 2019, 11, 849. 12 of 19 12 of 19. Figure 3. Standard loadings and significance level: *** (p < 0.001) ** (p < 0.05) * (p < 0.10). Figure 3. Standard loadings and significance level: *** (p < 0.001) ** (p < 0.05) * (p < 0.10).. •. •. •. As a consequence of these results, the following outcomes can be confirmed: As a consequence of these results, the following outcomes can be confirmed: As established by the DTPB [27], the three direct antecedents of behavioural intention (attitude, • As established by the DTPB [27], the three direct antecedents of behavioural intention subjective norm, and perceived control) have a direct and positive effect thereon. Comparatively, (attitude, subjective norm, and perceived control) have a direct and positive effect thereon. the one that has greater influence on the behavioural intention is the attitude (0.473 ***), Comparatively, the one that has greater influence on the behavioural intention is the attitude followed by the subjective norm (0.323 ***) and the perceived control (0.119 ***). Therefore, (0.473***), followed by the subjective norm (0.323***) and the perceived control (0.119***). a person will have the intent to participate in LDC or not, according to his or her perception Therefore, a person will have the intent to participate in LDC or not, according to his or her of them. These perceptions will be influenced as much by the person’s attitude as by the perception of them. These perceptions will be influenced as much by the person’s attitude subjective regulation or influences received from third parties, and the perceived control or as by the subjective regulation or influences received from third parties, and the perceived the self-perception of being competent to act. Any strategy to promote the use of LDCs must control or the self-perception of being competent to act. Any strategy to promote the use of focus on aligning LDCs with the perceptions of potential users. LDCs must focus on aligning LDCs with the perceptions of potential users. As specified by the consulted [10,20,60–64,86], perceived usefulness can be regarded • As specified bybibliography the bibliography consulted [10,20,60–64,86], perceived usefulness can be as aregarded multidimensional (social, prosocial, economic, and environmental) variable. Comparatively, as a multidimensional (social, prosocial, economic, and environmental) variable. the Comparatively, largest of the determinations of the utility comes prosocial utility (0.943from ***), the largest of the perceived determinations of the from perceived utility comes followed by social (0.792 ***),***), environmental and ***), economic (0.669 ***). (0.727 It is noteworthy prosocial utility (0.943 followed by(0.727 social***), (0.792 environmental ***), and thateconomic the smallest of the four is the economic, which is a sign that LDCs not only promotes (0.669 ***). It is noteworthy that the smallest of the four is the economic, economic which is sustainability, but also the environmental, and above all, the social and prosocial. Accordingly, a sign that LDCs not only promotes economic sustainability, but also the environmental, and people seeall, LDCs as having This means be useful for people with above the social and different prosocial.utilities. Accordingly, peoplethat see they LDCscan as having different utilities. veryThis different social, prosocial, financial, or environmental interests, thereby reaching a broader means that they can be useful for people with very different social, prosocial, financial, range of potential users. The strategy follow in promoting the of use of LDCsusers. will be tostrategy provide or environmental interests, therebytoreaching a broader range potential The eachtouser with evidence of the utility that is of the most interest to them. follow in promoting the use of LDCs will be to provide each user with evidence of the As established byofthe amongst others, compatibility and perceived usefulness have a utility that is theDTPB most[27], interest to them. direct and positive influence on attitude, but this others, is not socompatibility in the case of ease use. Comparatively, • As established by the DTPB [27], amongst and of perceived usefulness the have one that has a greater influence on the attitude is compatibility (0.827 ***), by a direct and positive influence on attitude, but this is not so in the case of followed ease of use. perceived utility (0.267 ***).that As has remarked in the previous LDCsisare viewed as having Comparatively, the one a greater influence on point, the attitude compatibility (0.827 different utilities by different people. Decision making on the use of LDCs will also beLDCs sensitive ***), followed by perceived utility (0.267 ***). As remarked in the previous point, are to the ability potential usersutilities to see them as to some extent compatible with personality viewed asof having different by different people. Decision making ontheir the use of LDCs andwill lifestyle. On the other hand, the study did not detect thatthem decision is influenced by also be sensitive to the ability of potential users to see as to making some extent compatible difficulty of use of LDCs; LDCs were rather seen as straightforward and easy to use. In contrast with their personality and lifestyle. On the other hand, the study did not detect that decision withmaking the findings of the bibliography consulted trust does not have direct and positive is influenced by difficulty of use of[44,52–54], LDCs; LDCs were rather seenaas straightforward. and easy to use. In contrast with the findings of the bibliography consulted [44,52–54], trust.
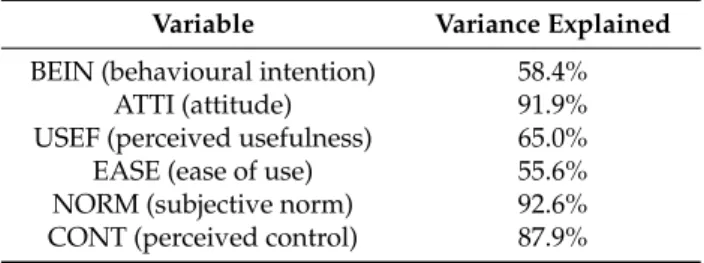
(13) Sustainability 2019, 11, 849. •. •. 13 of 19. influence on attitude. Neither was it detected that decision making is influenced by the need to have trust in the LDC-based community, but rather that trust, in both the platform and its users, is taken as a given. Based on the above, the strategy to follow in promoting the use of LDCs will be to provide each user with evidence that LDCs are wholly compatible with their lifestyle. As specified by the bibliography consulted, compatibility has a direct and positive influence on ease of use [51], as does ease of use on perceived usefulness [31,38,41,48–50], and compatibility on perceived usefulness [51]. If a person sees LDCs as compatible with their personality and lifestyle, then by implication they will view them as useful and easy to use. In the same way, if a person finds LDCs easy to use, they will end up seeing their utility, regardless of the type. In contrast with the findings of the bibliography consulted [40,43,52], the subjective norm does not have a direct and positive influence on attitude. The attitudes of people towards the use of LDCs will not change in response to the influence of others. This influence will directly affect their decision making, but not their attitude to this type of community. As stated above, their attitude will only be affected by their perceived compatibility and utility. Based on the above, the strategy to follow in promoting the use of LDCs will be, once again, to provide each user with evidence that LDCs are wholly compatible with their lifestyle. As established by the DTPB [27], amongst others, interpersonal influences have a direct and positive influence on the subjective norm, whilst extra-personal influences do not. The potential users of LDCs will be influenced by third parties that are close to them, but not by communications media or social networks. Therefore, the strategy to follow in promoting the use of LDCs will be to foster word-of-mouth and close personal referrals. Additionally, self-efficacy and facilitating conditions have a direct and positive influence on perceived control. Comparatively, the one that has a greater influence on perceived control is self-efficacy (0.683 ***), followed by facilitating conditions (0.317). People will have to have a degree of proficiency to opt to use LDCs, in order to see themselves as capable of operating them, as well as having the necessary infrastructure to be able to use them. Therefore, the strategy to follow in promoting the use of LDCs will be to transmit the message that they are easily accessible and controllable by potential users.. Below, Table 6 shows the results of the variance explained by each of the structural model’s dependent variables. Table 6. Variance explained. Variable. Variance Explained. BEIN (behavioural intention) ATTI (attitude) USEF (perceived usefulness) EASE (ease of use) NORM (subjective norm) CONT (perceived control). 58.4% 91.9% 65.0% 55.6% 92.6% 87.9%. In light of these results, the following can be confirmed:. • •. •. The predictive capacity of behavioural intention stands at 58.4%, which is a figure very close to the 60% given by the DTPB [27]. In the case of the antecedents to behavioural intention, the variable with the greatest predictive capacity is the subjective norm, at 92.6%, followed by attitude and perceived control, at 91.9% and 87.9%, respectively. In the case of the antecedents to attitude, perceived usefulness and ease of use show predictive capacities of 65.0% and 55.6%, respectively..
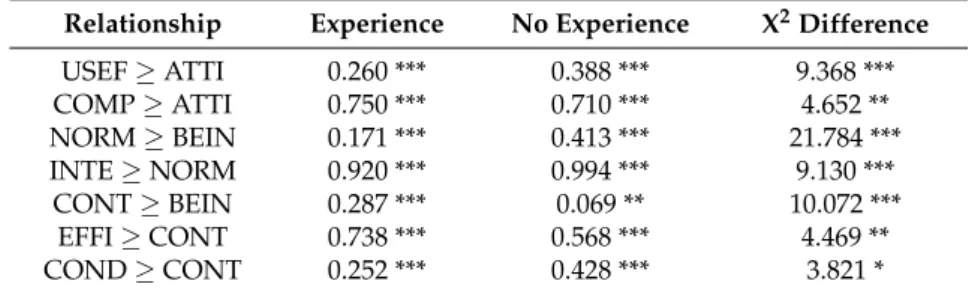
(14) Sustainability 2019, 11, 849. 14 of 19. 3.3. Multigroup Analysis and Moderating Effect of Prior Experience After analysing the configural (pattern) and measurement invariance of the measurement model, multigroup analysis of the structural model was performed, obtaining standardised coefficients in the two study groups (with and without prior experience), the X2 difference associated with each model restriction, and the level of statistical significance. Below, Table 7 shows the results that are statistically significant, and that therefore represent causal relationships with a moderating effect of prior experience. Given that seven of the causal relationships show statistically significant X2 differences, it can be confirmed that prior experience of LDCs has a moderating effect in the research model. Table 7. Relationships moderated by prior experience: *** (p < 0.001) ** (p < 0.05) * (p < 0.10). Relationship. Experience. No Experience. X2 Difference. USEF ≥ ATTI COMP ≥ ATTI NORM ≥ BEIN INTE ≥ NORM CONT ≥ BEIN EFFI ≥ CONT COND ≥ CONT. 0.260 *** 0.750 *** 0.171 *** 0.920 *** 0.287 *** 0.738 *** 0.252 ***. 0.388 *** 0.710 *** 0.413 *** 0.994 *** 0.069 ** 0.568 *** 0.428 ***. 9.368 *** 4.652 ** 21.784 *** 9.130 *** 10.072 *** 4.469 ** 3.821 *. Accordingly, the employment of the model to evaluate the process of LDC adoption will have to take into consideration the level of previous experience of the subjects that make up the sample studied. In other words, on the one hand subjects with previous experience will have to be studied, and on the other, subjects without any experience will have to be studied as well. In particular, of the seven causal relationships that are moderated by experience, in four of these, the factorial loads are greater in subjects without experience, as is the case with the relationships between utility and attitude, subjective regulation and behavioural intent, and interpersonal influences and subjective regulation, in addition to enabling conditions and perceived control. The opposite is the case in the three remaining relationships; that is, the factorial loads are greater in subjects with experience. This would be the case for the relationships between compatibility and attitude, perceived control and behavioural intent, as well as self-efficacy and perceived control. Therefore, analysis of these seven relationships without taking into consideration the experience of the subjects would lead to an erroneous interpretation of the results. 4. Conclusions Few empirical studies have analysed human behaviour that is associated with the use of LDCs, showing incomplete approaches and wildly varying methodologies, which makes standardising and comparing them difficult. The few studies that have used attitude-based behavioural models do so using the TPB without decomposition into beliefs. When they do employ the decomposed version, they only use attitude, but not subjective norm or perceived control. As we have shown, the proposed model is a preliminary integrated model that includes all of the DTPB’s variables and causal and measurement relationships, together with a series of additional factors and extensions. Our research’s empirical evidence helps understand the LDC adoption process. The three direct antecedents of behavioural intention (attitude, subjective norm, and perceived control) have a direct and positive influence thereon. Of the four beliefs and attitudes, compatibility and perceived usefulness have a direct and positive influence thereon. Perceived usefulness is decomposed into four different dimensions: the social, prosocial, economic, and environmental. Of the two beliefs of the subjective norm, only interpersonal influences have a direct and positive influence thereon. In the case of perceived control, we have confirmed the direct and positive influence of self-efficacy and the facilitating conditions upon it. Furthermore, three of the four causal relationships additional to.
(15) Sustainability 2019, 11, 849. 15 of 19. the DTPB have been confirmed: compatibility with ease of use, ease of use with perceived usefulness, and compatibility with perceived usefulness. Finally, the proposed research model is moderated by the subjects’ prior experience in LDC. These conclusions provide us with a more in-depth understanding of what people’s motives are when it comes to initiating or forming part of LDC-based communities. Therefore, they represent a theoretical contribution of interest to networks and systems that, as the literature notes, are the precursors of a series of benefits, in terms of both sustainability and development, and also socially, economically, and environmentally. Understanding the determinants of the behavioural intention to participate in these LDCs permits one to have an impact on their development, which can boost different competences, such as based on entrepreneurship and innovation, as well as collaboration and the promotion of opportunities. These results have important implications for the management of LDC-based communities. As we have shown, both attitudes and the subjective norm influence behavioural intention. So, to promote positive attitudes, communication in this kind of communities must be aimed at making potential users see that they are compatible with their own way of life and doing things, whilst also being of some use to them. In their management, consideration should be given to granting bonuses for interpersonal-type recommendations. Whenever a user manages to attract new users, then, they should be rewarded, whether with an addition to their balance or by increasing their visibility and reputation on the platform. For its part, perceived control has a slight influence on behavioural intentions, and so it will be necessary for this type of community to carry out campaigns to raise people’s awareness of their self-efficacy when it comes to carrying out transactions, and that they enjoy the facilitating conditions to execute them. Tutorials on procedure and operating methodology should also be published, along with the organisation of face-to-face workshops in which people can find out firsthand whether they are able to use LDCs. In any case, we believe that any studies that are to be performed on managing LDCs need to take into account the subjects’ prior experience, or whether what they wish to analyse is new or repetitive behaviour. This study has its limitations. Firstly, it should be noted that whilst expectancy-value models, including the one proposed in this research, do incorporate social aspects, they tend to explain a person’s behaviour as an individual, ignoring behaviours that require the presence of other persons to be carried out. Additionally, we have only been able to contemplate two of the determining factors of behavioural intention—trust and prior experience—leaving out others such as demographic features, personality, service quality, the brand effect, motivation, and others. Another limitation is that of the 126,587 subjects surveyed, the total sample gathered comprised only 1559 (1.23%) subjects: 901 (0.83%) of the 108,587 from Population 1, and 658 (3.06%) of the 21,500 from Population 2. Despite the low level of participation, the total number of samples collected was sufficient to be able to perform the statistical analysis. Likewise, and despite the limitation of this article because it is based solely on a psychological analysis, it is necessary to acknowledge the role of organisational resources and other environmental factors that impact the development and growth of LDCs. Additionally, although this research work has not been able to include the cultural variable, support should be given to future lines of research that try to explain not only individual but also group and intergroup behavior. To do this, there will be the need to include an understanding of the influence of culture on behavior. Finally, another limitation of this research has been the non-inclusion of digital currencies based on blockchain technology and token economy, such as Bitcoin [87] or Steemit [88], especially taking into account the influence that they can have on sustainability and development. Lastly, we regard this study as a first step towards further research in the coming years. In this regard, our interest will be focused on performing a multigroup analysis between the different types of communities analysed (time banks, eco-networks, and social currency networks). We are also interested in more fully assessing the mediating effect, beyond the direct influences analysed, as well as in carrying out a quantitative study to understand why certain causal relationships are moderated by prior experience. We also believe that this type of research could be furthered through an analysis.
(16) Sustainability 2019, 11, 849. 16 of 19. of moderation that includes other study variables (gender, age, and employment situation). Finally, we consider it necessary to continue this research with a study of the contribution of commercial and business LDCs, primarily those linked to mutual exchange systems, and digital currencies based on blockchain technology and the token economy. Author Contributions: A.F.C.G. has contributed in the conceptualisation, methodology, validation, formal analysis, investigation, data curation, writing-original draft preparation, visualisation and project administration. L.G.T. has contributed in the conceptualisation, methodology, validation, writing-review & editing, and supervision. Funding: This research received no external funding. Conflicts of Interest: The authors declare no conflict of interest.. References 1. 2. 3. 4. 5.. 6. 7. 8. 9. 10. 11. 12. 13. 14. 15. 16. 17. 18. 19.. Lietaer, B. El Futuro del Dinero: Cómo Crear Nueva Riqueza, Trabajo y un Mundo Más Sensato; Errepar-Longseller: Buenos Aires, Argentina, 2005. Goerner, S.; Lietaer, B.; Ulanowicz, R. Quantifying economic sustainability: Implications for free-enterprise theory, policy and practice. Ecol. Econ. 2009, 69, 76–81. [CrossRef] Seyfang, G.; Longhurst, N. Growing green money? Mapping community currencies for sustainable development. Ecol. Econ. 2013, 86, 65–77. Michel, A.; Hudon, M. Community currencies and sustainable development: A systematic review. Ecol. Econ. 2015, 116, 160–171. [CrossRef] Corrons, A. Análisis de La Influencia de Los Valores Humanos y Las Actitudes en el Proceso de Adopción de Redes Virtuales de Intercambio no Monetario: Enfoques Actitudinal, Motivacional y Panárquico. Ph.D. Thesis, Universitat Jaume I, Valencia, Spain, 2018. Hopkins, R. The Transition Handbook: Creating Local Sustainable Communities Beyond Oil Dependency; Finch Publishing: Sydney, Australia, 2008. Williams, C.; Aldridge, T.; Lee, R.; Leyshon, N.T.; Tooke, J. Bridges into work? An evaluation of local exchange trading schemes (LETS). Policy Stud. 2011, 22, 119–132. Fare, M. The SOL: A complementary currency for the social economy and sustainable development. Int. J. Community Curr. Res. 2011, 15, 57–60. Cahn, E. No More Throwaway People: The Co-Production Imperative; Essential Books: Washington, DC, USA, 2000. Collom, E. The Motivations, Engagement, Satisfaction, Outcomes, and Demographics of Time Bank Participants: Survey Findings from U.S. System. Int. J. Community Curr. Res. 2007, 11, 36–83. Gómez, G. Making Markets. The Institutional Rise and Decline of the Argentine Red de Trueque. Ph.D. Thesis, Instituto de Estudios Sociales, La Haya, The Netherlands, 2008. Seyfang, G.; Smith, A. The Time of Our Lives: Using Time Banking for Neighborhood Renewal and Community Capacity Building; New Economics Foundation: London, UK, 2002. Cuenca, C. Bancos de Tiempo: Comunidades e Internet. Ph.D. Thesis, Departamento de Psicología Social, Facultad de Ciencias Políticas y Sociología, Unviersidad Complutense de Madrid, Madrid, Spain, 2015. Bostman, R.; Rogers, R. What’s Mine Is Yours: The Rise of Collaborative Consumption; Harper Collins: New York, NY, USA, 2010. Holdsworth, M.; Boyle, D. Carrots Not Sticks: The Possibilities of a Sustainability Reward Card for the UK; New Economics Foundation and National Consumer Council: London, UK, 2004. Turnbull, S. Options for Rebuilding the Economy and the Financial System; International Institute for Self-Governance. Sustainable Money Working Group: London, UK, 2009. Hughes, N. The community currency scen in Spain. Int. J. Community Curr. Res. 2015, 19, 1–11. Liesch, P.W.; Birch, D. Community-Based LETSystems in Australia: Localised Barter in a Sophisticated Western Economy. Int. J. Community Curr. Res. 2000, 4, 1–12. Caldwell, C. Why Do People Join Local Exchange Trading Systems? Int. J. Community Curr. Res. 2000, 4, 1–16..
(17) Sustainability 2019, 11, 849. 20.. 21. 22. 23. 24. 25. 26. 27. 28. 29. 30.. 31. 32. 33. 34. 35. 36. 37. 38. 39. 40. 41. 42. 43.. 44. 45.. 17 of 19. Scherpenborg, S. What Drives the Willingness to Participate in a Community Currency? An Application of the Theory of Planned Behavior. Master’s Thesis, Master Inetrnational Business Marketing-Finance, School of Economics and Business, Maastrich University, Maastricht, The Netherlands, 2014. Oliver, E. Community currency (CC) in Spain. An empirical study of their social effects. Research article. Ecol. Econ. 2016, 121, 20–27. Franková, E.; Fousek, J.; Kala, L.; Labohý, J. Transaction network analysis for studying Local Exchange Trading Systems (LETS): Research potentials and limitations. Ecol. Econ. 2014, 107, 266–275. [CrossRef] Casares, J. El Comercio Electrónico. Luces y Sombras. Distrib. Consumo 2000, 10, 5–8. Jaén, I.; Liñán, F. Work Values in a Changing Economic Environment: The Role of Entrepreneurial Capital. Int. J. Manpow. 2013, 34, 939–960. [CrossRef] Ajzen, I.; Fishbein, M. Understanding Attitudes and Predicting Social Behavior; Prentice Hall: Madrid, Spain, 1980. Schifter, D.B.; Ajzen, I. Intention, perceived control, and weight loss: An application of the theory of planned behavior. J. Personal. Soc. Psychol. 1985, 49, 842–851. [CrossRef] Taylor, S.; Todd, P.A. Understanding Information Technology Usage: A Test of Competing Models. Inf. Syst. Res. 1995, 6, 144–176. [CrossRef] Ajzen, I. The Theory of Planned Behavior. Organ. Behav. Hum. Decis. Process. 1991, 50, 179–511. [CrossRef] Venkatesh, V.; Morris, M.G.; Davis, G.B.; Davis, F.D. User acceptance of information technology: Toward a unified view. MIS Q. 2003, 27, 425–478. [CrossRef] Vera, V.D. Determinants of Online Purchasing Behavior: An Empirical Investigation Using an Extensión of the Theory of Planned Behavior. Master’s Thesis, Master of Science in Marketing, Business and Social Sciences, Department of Business Administration, Aarhus University, Aarhus, Denmark, 2012. Davis, F.D. Perceived Usefulness, Perceived Ease of Use and User Acceptance of Information Technology. MIS Q. 1989, 13, 319–339. [CrossRef] Rogers, E.M. Diffusion of Innovations, 4th ed.; The Free Press: New York, NY, USA, 1995. Bhattacherjee, A. Acceptance of e-commerce services: The case of electronic brokerages. IEEE Trans. Syst. Man Cybern. Part A Syst. Hum. 2000, 30, 411–420. [CrossRef] Cheung, C.M.; Chan, G.W.; Limayem, M. A Critical Review of Online Consumer Behavior: Empirical Research. J. Electron. Commer. Organ. 2005, 3, 1–19. [CrossRef] Monsuwé, T.P.; Dellaert, B.G.; de Ruyter, K. What drives consumers to shop online? A literature review. Int. J. Serv. Ind. Manag. 2004, 15, 102–121. [CrossRef] Zhou, L.; Dai, L.; Zhang, D. Online shopping acceptance model—A critical survey of consumer factors in online shopping. J. Electron. Commer. Res. 2007, 8, 41–62. Limayem, M.; Khalifa, M.; Frini, A. What Makes Consumers Buy from Internet? A Longitudinal Study of Online Shopping. IEEE Trans. Syst. Man Cybern. Part A Syst. Hum. 2000, 30, 421–432. [CrossRef] Gentry, L.; Calantone, R. A Comparison of Three Models to Explain Shop-Bot Use on the Web. Psychol. Mark. 2002, 19, 945–956. [CrossRef] Khalifa, M.; Cheng, S. Adoption of Mobile Commerce: Role of Exposure. In Proceedings of the 35th Hawaii International Conference on System Science, Big Island, HI, USA, 7–10 January 2002. Gatignon, H.; Robertson, T.S. A Propositional Inventory for New Diffusion Research. J. Consum. Res. 1985, 11, 849–867. [CrossRef] Davis, F.D.; Bagozzi, R.P.; Warshaw, P.R. User Acceptance of Computer Technology: A Comparison of Two Theoretical Models. Manag. Sci. 1989, 35, 982–1003. [CrossRef] Moore, G.C.; Benbasat, I. Development of an Instrument to Measure the Perceptions of Adopting an Information Technology Innovation. Inf. Syst. Res. 1991, 2, 192–222. [CrossRef] Malhotra, Y.; Galletta, D.F. Extending the Technology Acceptance Model to Account for Social Influence: Theoretical Bases and Empirical Validation. In Proceedings of the 32nd Hawaii International Conference on System Sciences, Maui, HI, USA, 5–8 January 1999; pp. 6–14. Chen, L.D.; Tan, J. Technology Adaptation in E-commerce: Key Determinants of Virtual Stores Acceptance. Eur. Manag. J. 2004, 22, 74–86. [CrossRef] Pavlou, P.A. A Theory of Planned Behavior Perspective to the Consumer Adoption of Electronic Commerce. MIS Q. 2002, 30, 115–143. [CrossRef].
(18) Sustainability 2019, 11, 849. 46. 47. 48. 49. 50. 51. 52. 53. 54. 55. 56. 57. 58. 59. 60.. 61. 62. 63.. 64. 65. 66.. 67. 68. 69. 70.. 18 of 19. Vijayasarathy, L.R. Predicting consumer intentions to use on-line shopping: The case for an augmented technology acceptance model. Inf. Manag. 2004, 41, 747–762. [CrossRef] Lin, H.F. Predicting consumer intentions to shop online: An empirical test of competing teories. Electron. Commer. Res. Appl. 2007, 6, 433–442. [CrossRef] Gefen, D.; Straub, D. The Relative Importance of Perceived Ease of Use in IS Adoption: A Study of E-Commerce Adoption. J. Assoc. Inf. Syst. 2000, 1, 8. [CrossRef] Featherman, M.S.; Pavlou, P.A. Predicting E-services Adoption: A Perceived Risk Facets Perspective. Int. J. Hum. Comput. Stud. 2003, 59, 451–474. [CrossRef] Shang, R.-A.; Chen, Y.C.; Shen, L. Extrinsic versus Intrinsic Motivations for Consumer to Shop On-line. Inf. Manag. 2005, 42, 401–413. [CrossRef] Agarwal, R.; Karahanna, E. A Conceptual and Operational Definition of Personal Innovativeness in the Domain of Information Technology. Inf. Syst. Res. 1998, 9, 204–215. [CrossRef] Hsu, M.H.; Chiu, C.M. Internet Self-efficacy and Electronic Service Acceptance. Decis. Support Syst. 2004, 38, 369–381. [CrossRef] Ling, K.C.; Chai, L.T.; Piew, T.H. The Effects of Shopping Orientations, Online Trust and Prior Online Purchase Experience toward Customers. Int. Bus. Res. 2010, 3, 63. [CrossRef] Suh, B.; Han, I. Effect of trust on customer acceptance of Internet banking. Electron. Commer. Res. Appl. 2003, 1, 247–263. [CrossRef] Gefen, D.; Karahanna, E.; Straub, D.W. Inexperience and experience with online stores: The importance of TAM and trust. IEEE Trans. Eng. Manag. 2003, 50, 307–321. [CrossRef] Korgaonkar, P.K.; Wolin, L.D. A Multivariate Analysis of Web Usage. J. Advert. Res. 1999, 39, 53–68. Bagozzi, R.P.; Dholakia, U.M. Intentional Social Action in Virtual Communities. J. Interact. Mark. 2002, 16, 2–21. [CrossRef] Chang, M.K.; Cheung, W.; Lai, V.S. Literature Derived Reference Models for the Adoption of Online Shopping. Inf. Manag. 2005, 42, 543–559. [CrossRef] Aldas, J.; Lassala, C.; Ruiz, C.; Sanz, S. Key Drivers of Internet Baking Service Use. Online Inf. Rev. 2009, 33, 672–695. [CrossRef] Bock, G.W.; Zmud, R.W.; Kim, Y.G.; Lee, J.N. Behavioral intention formation in knowledge sharing: Examining the roles of extrinsic motivators, social-psychological forces, and organizational climate. MIS Q. 2005, 29, 87–111. [CrossRef] Hamari, J.; Sjöklint, M.; Ukkonen, A. The Sharing Economy: Why People Participate in Collaborative Consumption. J. Assoc. Inf. Sci. Technol. 2015, 67, 2047–2059. [CrossRef] Martin, C.; Upham, P.; Budd, L. Commercial orientation in grassroots social innovation: Insights from the sharing economy. Ecol. Econ. 2015, 118, 240–251. [CrossRef] Hawlitschek, F.; Teubner, T.; Gimpel, H. Understanding the Sharing Economy. Drivers and Impediments for Participation in Peer-to-Peer Rental. In Proceedings of the Hawai International Conference on System Science (HICSS), Koloa, HI, USA, 5–8 January 2016. Johe, M.; Bhullar, N. To buy or not to buy: The roles of self-identity, attitudes, perceived behavioural control and norms in organic consumerism. Ecol. Econ. 2016, 128, 99–105. [CrossRef] Jayawardhena, C.; Wright, L.T.; Dennis, C. Consumers online: Intentions, orientations and segmentation. Int. J. Retail Distrib. Manag. 2007, 35, 515–526. [CrossRef] Bigné, J.E.; Ruiz, C. Antecedentes de la Decisión de Compra en los Entornos Virtuales. In Proceedings of the Actas del XV Encuentro de Profesores Universitarios de Marketing, Córdoba, Spain, 1–17 September 2003; pp. 437–451. Churchill, G.A. Investigación de Mercados, 4th ed.; Thomson: Ciudad de México, Mexico, 2003. Pavlou, P.A.; Fygenson, M. Understanding and Predicting Electronic Commerce Adoption: An Extension of the Theory of Planned Behavior. MIS Q. 2006, 30, 115–143. [CrossRef] George, H.F. The theory of planned behavior and Internet purchasing. Internet Res. 2004, 14, 198–212. [CrossRef] Hung, J.; Lu, C.C.; Huh, C.A.; Liu, J.T. Geochemical control son distributions and speciation of As and Hg in sediments along the Gaoping (Kaoping) Estuary-Canyon system off southwestern Taiwan. J. Mar. Syst. 2009, 76, 479–495. [CrossRef].
(19) Sustainability 2019, 11, 849. 71.. 72. 73. 74. 75. 76. 77. 78. 79. 80. 81. 82. 83. 84. 85. 86. 87. 88.. 19 of 19. Lau, A. Hospital-Based Nurses’ Perceptions of the Adoption of Web 2.0 Tools for Knowledge Sharing, Learning, Social Interaction and the Production of Collective Intelligence. J. Med. Internet Res. 2011, 13, e92. [CrossRef] [PubMed] Venkatesh, V.; Davis, F.D. A Theoretical Extension of the Technology Acceptance Model: Four Longitudinal Field Studies. Manag. Sci. 2000, 46, 186. [CrossRef] Marsh, H.W.; Hocevar, D. Application of confirmatory factor analysis to the study of self-concept: First- and higher order factor models and their invariance across groups. Psychol. Bull. 1985, 97, 562–582. [CrossRef] Jöreskog, K.G.; Sorbom, D. PRELIS: A Program for Multivariate Data Screening and Data Summarization: A Preprocessor for LISREL; Ind. Scientific Software: Moreesville, NC, USA, 1986. Byrne, B.M. Structural Equation Modeling with LISREL, PRELIS and SIMPLIS: Basic Concepts, Applications and Programming; Lawrence Erlbaum Associates: Mahwah, NJ, USA, 1998. Steiger, J.H. Structural model evaluation and modification: An interval estimation approach. Multivar. Behav. Res. 1990, 25, 173–180. [CrossRef] [PubMed] Tucker, L.R.; Lewis, C. The reliability coefficient for maximum likelihood factor anlysis. Psychometrika 1973, 38, 1–10. [CrossRef] Bentler, P.M.; Bonett, D.G. Significance tests and goodness of fit in the analysis of covariance structures. Psychol. Bull. 1980, 88, 588–606. [CrossRef] Bentler, P.M. Fit indexes, lagrange multipliers, constraint changes and incomplete data in structural models. Multivar. Behav. Res. 1990, 25, 163–172. [CrossRef] Bollen, K.A. Structural Equations with Latent Variables; Wiley: New York, NY, USA, 1989. Mulaik, S.A.; James, L.R.; van Alstine, J.; Bennett, N.; Lind, S.; Stilwell, C.D. Evaluation of goodness-of-fit indices for structural equation models. Psychol. Bull. 1989, 105, 430–445. [CrossRef] Schermelleh-Engel, K.; Moosbrugger, H.; Müller, H. Evaluating the fit of structural equation models: Test of significance and descriptive goodness-of-fit measures. Methods Psychol. Res. Online 2003, 8, 23–74. Hair, J.E.; Anderson, R.E.; Tatham, R.L.; Black, W.C. Análisis Multivariante, 5th ed.; Prentice Hall: Madrid, Spain, 2008. Fornell, C.; Larcker, D.F. Evaluating structural equation models with unobservable variables and measurement error. J. Mark. Res. 1981, 18, 39–50. [CrossRef] Campbell, D.T.; Fiske, D.W. Convergent and discriminant validation by multitrait-multimethod matrix. Psychol. Bull. 1959, 56, 81–105. [CrossRef] [PubMed] Collom, E. Motivations and differential participation in a community currency system: The dynamics within a local social movement organization. Sociol. Forum 2011, 26, 144–168. [CrossRef] Giungato, P.; Rana, R.; Tarabella, A.; Tricase, C. Current Trends in Sustainability of Bitcoins and Related Blockchain Technology. Sustainability 2017, 9, 2214. [CrossRef] Kim, M.S.; Chung, J.Y. Sustainable Growth and Token Economy Design: The Case of Steemit. Sustainability 2019, 11, 167. [CrossRef] © 2019 by the authors. Licensee MDPI, Basel, Switzerland. This article is an open access article distributed under the terms and conditions of the Creative Commons Attribution (CC BY) license (http://creativecommons.org/licenses/by/4.0/)..
(20)
Figure
+6
Documento similar
Based on this premise, and in order to provide added value to measure objectively the websites’ degree of tourist information, the following variables were added to measure
The Moderating Role of Family Functionality in Prosocial Behaviour and School Climate in Adolescence
Subsequently, in order to examine the behaviour of family functioning as a moderat- ing variable of prosocial behaviours (empathy, respect, social relations and leadership)
Artadi (2002), "Economic Growth and Investment in the Arab World”, Columbia University Discussion Paper, No. 37 The country article on Syria provides a comprehensive
The proposed positive effects of legal, ethical, economic, philanthropic and environmental dimensions of CSR on consumers’ support for corporate reputation, the selection of
The assessment of the value of the filtration process was assayed for the nanoformulation and, although the results showed no significant changes in the particle size when using
Tables 2 and 3a and b show the results of the GLS econometric estimation of the relationship between economic freedom and economic institutions on the one hand
ABSTRACT: Cooperatives have gained prominent attention in recent years as strategic elements to achieve sustainable economic development and greater social co- hesion in the context
This framework consists of three practices (economic, environmental and social) with twelve sub- practices (Cost management, research and development, limited landfilling,
