www.elsevier.com.mx
medicina
universitaria
* Corresponding author: Pediatrics Department, “Dr. José Eleuterio González” University Hospital. Francisco I. Madero and Gonzalitos Avenue, Mitras Centro, Z.P. 64460, Monterrey, N.L., Mexico. Telephone: (+52 81) 8348 5421. E-mail address: [email protected] (M. E. de la O-Cavazos).
OrIGINAL ArTICLE
Body composition by dual X-ray absorptiometry in Mexican
schoolchildren with or without obesity
M. E. de la O-Cavazos
a,*, C. Treviño-Garza
a, I. Rodríguez-Balderrama
a, J. Z.
Villarreal-Pérez
b, R. Elizondo-Omaña
c, R. Montes de Oca-Luna
c, S. Sánchez-González
a, D.
Cantú-Moreno
a, P. Rodríguez-Calderón
d, J. Argente-Oliver
ea Pediatrics Department, “Dr. José Eleuterio González” University Hospital, Universidad Autónoma de Nuevo León,
Monterrey, N.L., Mexico
b Endocrinology Service, “Dr. José Eleuterio González” University Hospital, Universidad Autónoma de Nuevo León,
Monterrey, N.L., Mexico
c School of Medicine, Universidad Autónoma de Nuevo León, Monterrey, N.L., Mexico d Children’s Medical Center S.A of C.V., Monterrey, N.L., Mexico
e Pediatrics Department, School of Medicine, Universidad Autónoma de Madrid, Ciudad Universitaria de Cantoblanco,
Madrid, Spain
received: February 2014; Accepted: May 2014
KEYWORDS Body composition; Dual X-ray absorptiometry; Childhood obesity; Body mass index; Fat mass; Mexico.
Abstract
Objective: Apply dual X-ray absorptiometry (DXA) to determine the amount of fat mass, lean mass, and bone mineral density in Mexican schoolchildren with and without obesity.
Material and methods: We performed an observational, analytical, comparative, cross-sectional study of 80 Mexican schoolchildren who attended the Nutrition Clinic of the Pediatric Medical Center in Monterrey, Mexico during the period of January to April 2005. Body mass index (BMI) was determined to classify the participants according to the growth charts of the Centers for Disease Control and Prevention. Two groups of 40 children each (with and without obesity) were formed and DXA was carried out on each individual. Cronbach’s Alpha was used to determine instrument reliability and the Kolmogorov-Smirnov test was used to test the normality of nume-rical variables. Means were compared using Student´s t test.
Results: Statistically signiicant differences were found in fat mass (p≤0.001) and lean mass (p≤0.001), but not in bone mineral content (p=0.051) between both groups.
Conclusions: Differences exist in fat mass and lean mass in both groups, but not in bone mineral content between both groups. A signiicant positive correlation was found between fat mass, determined by DXA, and BMI in schoolchildren with and without obesity.
Introduction
The prevalence of obesity is increasing in children and ado-lescents in developed and developing countries and has be-come a health problem of great importance.1 According to the National Health and Nutrition Survey, the combined na-tional prevalence of obesity in 2012 in school-age children, using the World Health Organization (WHO) criteria, was 34.4% (19.8% and 14.6%, respectively).2 Although the body mass index (BMI) remains the most widely used method for clinical diagnosis of obesity, it is not a measure of body com-position because it only provides information about global changes in the body, without specifying the components
that are speciically affected in situations of malnutrition
and/or obesity.3,4
There are several ways to indirectly measure adipose tis-sue. Among these are 2 kinds of impedance analyses: single frequency and multi-frequency, which both calculate lean body mass; however, their accuracy varies with hydration
and the presence of body luids, although they have the ad -vantage of being non-invasive and accessible. Likewise, the-re athe-re other mothe-re sophisticated methods to assess body composition: dual X-ray absorptiometry (DXA), computeri-zed tomography (CT), and magnetic resonance imaging (MrI), with the latter 2 being used for research purposes. Although various methods are available, some have a num-ber of disadvantages, such as low precision and a need for
the individual’s cooperation. This makes it necessary to ind
an easy, reliable, and economical method that can be used in professional clinical practice.
DXA is a method commonly used to determine bone mine-ral density, but it also accurately estimates fat mass and fat-free mass.5,6 It is relatively fast and safe, providing high accuracy and requiring little patient cooperation.7 Thus DXA has some advantages over MrI, such as the relative ease of access and simplicity of measurements.8,9
This highlights the importance of this study for clinical application in children with and without obesity with res-pect to body composition by DXA, relating this to BMI and associating the latter with metabolic abnormalities related to excess adipose tissue.10 The purpose of this study is to use DXA to determine whether there is any difference in the content of fat mass, lean mass, and bone mineral density in Mexican schoolchildren with and without obesity.
Material and methods
We developed an observational, cross-sectional, analytical and comparative study. The participants were selected by
convenience and incidental sampling. The study included
80 Mexican children (6-12 years), who attended the Nutri-tion Clinic of the Child Medical Center in Monterrey, Mexico, during the period of January to April 2005. All patients in-cluded in the study were sedentary and were divided into 2 groups: one group of 40 non-obese schoolchildren with a BMI < 85th percentile only within the normal weight range and
another group of 40 obese students with a BMI ≥ 95th percen-tile. Female students who presented their menarche, both male and female patients with onset of puberty, patients taking corticosteroids and patients with conditions such as Prader-Willi, Brader-Biedl, Ahlstrom, and Cohen syndrome
were excluded. The study was approved by the research Ethics Committee of the “Dr. José Eleuterio González” Uni-versity Hospital of the Universidad Autónoma de Nuevo León (UANL, by its Spanish acronym). Patients older than 8 years provided assent and parents of all patients signed an informed consent before entering their children in the stu-dy.11
Prior to the DXA study, a complete pediatric medical exa-mination was performed and the patient’s weight was obtai-ned with a scale with a 100 g precision (Health-O-Meter®, McCook, IL, USA). Height was measured using a stadiometer to the nearest 1 mm (SECA model 242, Hammer Steindam, Hamburg, Germany). With these results, BMI (weight/ height2) was obtained.
Body composition analysis was performed by DXA (QDr, Hologic Inc., Bedford, MA, USA), which provides measure-ments of the following variables: fat mass in grams, lean mass in grams, and bone mineral content. Data were tabu-lated using Microsoft Excel®. Cronbach´s Alpha coeficient was used to obtain the reliability of the instrument and the Kolmogorov-Smirnov test was used to determine the norma-lity in the numeric variables. Frequencies and percentages are used for descriptive statistics, as well as measures of central tendency (mean, median) and standard deviation (SD). Finally, Student´s t test was used for comparison of data.
Results
In this study, BMI was determined in 80 schoolchildren who
were classiied as obese and non-obese, according to the
Centers for Disease Control and Prevention growth charts and divided into 2 equal groups. Children of different ages were included and the median age for both groups was de-termined; in the non-obese group the median was 9 years, and in the obese group it was 8.5 years. The demographic characteristics of the groups are shown in Table 1.
regarding BMI, the girls in the non-obese group (n=16) had a mean of 17.27 Kg/m2 and the boys (n=24) 18.45 Kg/m2; in the obese group, girls (n=20) had a mean of 24.49 Kg/m2 and boys (n=20) 25.14 Kg/m2. Fat mass in grams, lean mass in grams, and bone mineral content were determined in both groups, obtaining the mean, median, SD and p value for the different parts of the body, and as a whole (Table 2). With regard to the analysis of fat mass in grams in the different parts of the body, the non-obese group showed that the greatest amount was located in the trunk ( = 2,958 ± 1,502 g), while the lowest value was found in the left arm ( = 504 ± 288 g). In the group with obesity, for fat mass in grams according to the different parts of the body, the trunk was also the area with the highest value ( = 7,297 ± 2,376 g), with the head scoring the lowest ( = 857 ± 122 g).
In the non-obese group, lean mass in grams was greater in the trunk ( = 10,555 ± 2,546 g) and lowest in the left arm ( = 1,138 ± 333 g). When lean mass in grams was determi-ned in different areas of the body, in the obese group it was observed that the trunk had the greatest amount ( = 12,809 ± 2,804 g) and the left arm the lowest ( = 1,279 ± 351 g).
44.1 g) and the lowest in the left arm ( = 52.9 ± 21.5 g). In the obese group, the bone mineral content in grams was greatest in the head ( = 309.0 ± 51.7 g) with the lowest content in the left arm ( = 64.1 ± 17.0 g). Moreover, body composition as a percentage of total fat mass, lean mass and bone mineral content were determined in both groups.
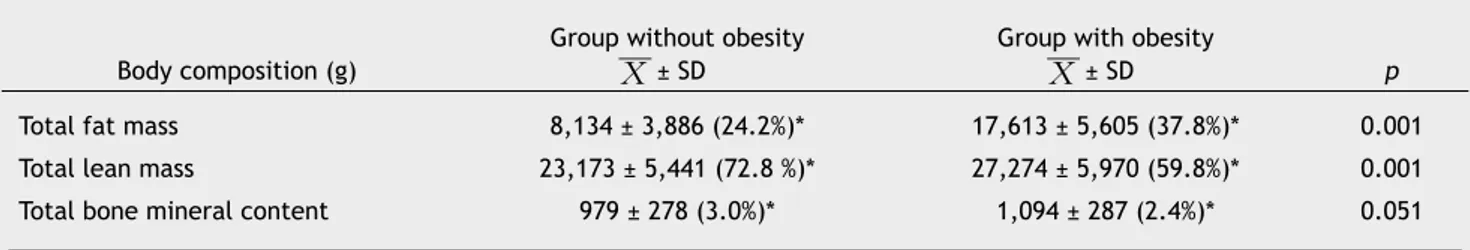
When comparing the means of both groups, signiicant diffe -rences in fat mass and lean mass were found. In the obese group a mean bone mineral content of 1,094 was found and in the non-obese group of 979, which, although it was not
statistically signiicant (p=0.051) showed a trend toward in-creased bone mineral content in obese children, which is probably due to dietary and environmental factors (Table
3). A signiicant positive correlation was found between BMI
and total fat mass in grams calculated by DXA (Table 4).
Discussion
Although a consensus on the clinical parameter with the most discriminative ability to detect and quantify excess body fat has not been reached, most agree that the most suitable method for estimating body fat should be based on anthropometric measures because of its accessibility, sim-plicity and reproducibility, harmlessness, and low cost. The BMI is an indicator of body fat, but the relationship between BMI and percentage of body fat varies among individuals. Therefore, it is important to distinguish whether the excess weight is truly due to fat or muscle since we must not forget that children who are overweight but do not have excess fat do not have an increased health risk.12-15
DXA is becoming an extremely useful tool for assessing changes in bone mass, muscle mass, and especially fat mass not only in adults but children and adolescents.
Haroun et al.16 analyzed body composition in obese and non-obese Ukrainian children analyzing lean mass. Their study showed that lean mass is different in obese and non-obese children. Body water and mineral content are higher in obese children. These results are consistent with our data
regarding the analysis of lean mass, where we also found
statistically signiicant differences between the 2 groups.
Again, as with fat mass, the trunk had the greatest percen-tage of lean body mass in both groups. Likewise, boys had the highest amount of lean mass.
The trunk was the area where the greatest amount of fat was found in both groups; this amount showed statistically
signiicant differences between children with and without
obesity. These results are consistent with data published in medical literature in studies using the same method to as-sess body composition.17 Wefound that boys in both groups showed more body fat than girls, while female patients with obesity often have early, accelerated and rapidly progressi-ve puberties compared to their non-obese peers, leading to an earlier presentation of pubertal changes in body compo-sition, the group of female patients in our study had not yet presented pubertal changes. The distribution of fat mass is clinically important because these deposits in the thora-coabdominal region could be predictive in children with di-seases such as diabetes and hyperlipidemia, among others.
We found a positive and statistically signiicant correla -tion between BMI and fat mass in both groups of Mexican schoolchildren, making it possible to conclude that this in-dex can also be applied to the Mexican population. The re-sults of our study show that BMI is an indicator of adiposity and it correlates with fat mass determined by DXA. These results are consistent with those described in other publica-tions. Pietrobelli et al.18 found a correlation between BMI and percentage of body fat measured by DXA in ranges of 0.85 and 0.89 for children 5 to 19 years of age.
Leonard et al.19 mentioned in their research that obesity during childhood and adolescence is associated with increa-sed bone density and body mass. It is also known that estro-gen plays a role in female patients who have already submitted their menarche and likewise in pubertal male patients; aromatase converts testosterone to estrogen, and these play an important role in bone mass gain. However, this was not the case in our study as none of the patients
Table 1 Distribution by age and gender of children in groups with and without obesity.
Group with obesity (n=40) Group without obesity (n=40)
Gender Gender
Female Male Female Male
Age, years Frequency (%) Frequency (%) Frequency (%) Frequency (%)
6 2 (2.5) 4 (5) 0 (0) 6 (7.5)
7 3 (3.7) 2 (2.5) 2 (2.5) 3 (3.7)
8 6 (7.5) 3 (3.7) 5 (6.2) 1 (1.2)
9 6 (7.5) 3 (3.7) 7 (8.7) 4 (5)
10 1 (1.3) 2 (2.5) 0 (0) 7 (8.7)
11 2 (2.5) 3 (3.7) 1 (1.2) 2 (2.5)
12 0 (0) 3 (3.7) 1 (1.2) 1 (1.2)
had onset of puberty. In our study, the determination of
bone mineral content showed no statistically signiicant di -fference between the 2 groups. These data do not agree with what is described in medical literature,20-22 although it is probably due to dietary and environmental factors as des-cribed by Jurimae23 in Estonia, who conducted a study on the factors affecting bone density and bone mineral con-tent. These factors include age, since 90% of bone mass is reached at age 18 for women and 22 years for men, making those the best ages for evaluation; nutritional status, which should be taken into account since obese patients often have accelerated bone mineralization, with advanced bone age and size above the familiar; and physical activity, with the latter playing an important role in bone density develo-pment. Likewise, there are other rare diseases that affect bone mineral density, namely Turner syndrome, Noonan syn-drome, Klinefelter synsyn-drome, Kallman syndrome and others associated with hypogonadism, congenital adrenal hyper-plasia, Cushing’s endogenous syndrome, rickets, renal tubu-lar acidosis, deletions of 22q11, hypo and hyperthyroidism
disorders, hormone deficiency and growth resistance, parathyroid disorders, kidney disorders, inactivating and ac-tivating mutations of GNAS, use of loop diuretics, bone dys-plasias and rheumatic diseases.
By using DXA, we were able to assess its application in children. One of its main advantages is its low radiation dose, plus the pediatric patient is at an age to cooperate comfortably during the procedure, therefore there is no need for sedation and it is very quick. It would be desirable in the future to expand the sample size and classify patients by pubertal stage to establish baseline reference values. It is important to continue studies involving DXA, so that it becomes a useful tool for assessing changes in fat mass, lean mass, and bone mineral content in childhood, to unify reference values.
Conlicts of interest
The authors have no conlicts of interest to declare. Table 2 Differences in body composition in children with and without obesity in Monterrey, Mexico.
Group without obesity (n=40) Group with obesity (n=40)
SD Median SD Median p
Fat mass (g) by area
Left arm 504 288 448 1,296 545 1,124 <0.0001
right arm 519 320 447 1,366 604 1,184 <0.0001
Trunk 2,958 1,502 2,535 7,297 2,376 7,046 <0.0001
Left leg 1,725 866 1,681 3,367 964 3,25 <0.0001
right leg 1,733 841 1,678 3.43 993 3,204 <0.0001
Head 695 68 679 857 122 849 <0.0001
Total 8,134 3,759 7,267 17,613 5,331 16,669 <0.0001
Lean mass (g) by area
Left arm 1,138 333 1,109 1,279 351 1,177 0.0692
right arm 1,211 357 1,226 1,377 406 1,288 0.0559
Trunk 10,555 2,546 10,545 12,809 2,804 12,453 0.0003
Left leg 3,791 975 3,86 4,298 1,009 4,078 0.025
right leg 3,797 972 3,894 4,356 1,043 4,163 0.0153
Head 2,681 258 2,628 3,154 357 3,152 <0.0001
Total 23,173 5,262 23,678 27,274 5,724 26,525 0.0013
Bone mineral content (g) by area
Left arm 52.9 21.5 49.2 64.1 17 63.6 0.0022
right arm 55.7 23.9 53.8 68.2 20.3 64.6 0.0138
Trunk 215.2 62.4 208 247.2 64 236.6 0.0025
Left leg 169.2 63.7 164.5 201.3 65.8 188.4 0.0296
right leg 166.8 62.5 157.3 204.7 68.3 195.4 0.0115
Head 319.4 44.1 324.7 309 51.7 300.2 <0.0001
Total 979.3 259.7 931.3 1,094.5 261.3 1,041.4 0.0515
SD: standard deviation.
Funding
No inancial support was provided.
References
1. Singhal A, Kennedy K, Lanigan J, et al. Nutrition in infancy and long-term risk of obesity: evidence from 2 randomized contro-lled trials. Am J Clin Nutr 2010;92:1133–1144.
2. Accesed in June 2013. http://ensanut.insp.mx/informes/ENSA-NUT2012resultadosNacionales.pdf
3. Freedman DS, Wang J, Maynard LM, et al. relation of BMI to fat and fat-free mass among children and adolescents. Int J Obes (Lond) 2005;29:1-8.
4. Arroyo M, rocandio A, Ansotegui L, et al. Comparison of predic-ted body fat percentage from anthropometric methods and from impedance in university students. Brit J Nutr 2004;92:827– 832.
5. Horlick M, Wang J, Pierson r Jr., et al. Prediction models for evaluation of total-body bone mass with Dual-Energy X-ray Ab-sorptiometry among children and adolescents. Pediatrics 2004;114:e337.
6. Bauer J, Thornton J, Heymsield S, et al. Dual-energy X-ray ab -sorptiometry prediction of adipose tissue depots in children and adolescents. Pediatr res 2012;72:420–425.
7. Wells J, Haroun D, Williams JE, et al. Evaluation of DXA against the four-component model of body composition in obese chil-dren and adolescents aged 5 to 21 years. Int J Obes (Lond) 2010;34:649–655.
8. Gately PJ, radley D, Cooke CB, et al. Comparison of body com-position methods in overweight and obese children. J Appl Phy-siol 2003;95:2039–2046.
Table 4 Correlation between BMI and total fat mass calculated by dual X-ray absorptiometry in both groups.
Group TFM/BMI
r p
Without obesity (n=40) 0.92 <0.001 With obesity (n=40) 0.86 <0.001
TFM: total fat mass; BMI: body mass index.
9. Wilson JP, Mulligan K, Fan B, et al. Dual-energy X-ray absorptio-metry-based body volume measurement for 4-compartment body composition. Am J Clin Nutr 2012;95:25–31.
10. Sopher AB, Thornton JC, Wang J, et al. Measurement of percen-tage of body fat in 411 children and adolescents: a comparison of dual-energy x-ray absorptiometry with a four-compartment model. Pediatrics 2004;113:1285-1290.
11. Ize LL. Aspectos éticos de la atención nutricia. In: Casanueva E, Kaufer HM, Pérez LA, et al (eds). Nutriología Médica. 2a Ed.
Mé-xico: Panamericana; 2001. p. 350-352.
12. Freedman DS, Khan LK, Serdula MK, et al. The relation of child-hood BMI to adult adiposity: the Bogalusa Heart Study. Pedia-trics 2005;115:22-27.
13. Calarge CA, Xie D, Fiedorowicz JG, et al. rate of weight gain and cardiometabolic abnormalities in children and adolescents. J Pediatr 2012;161:1010-1015.
14. Sabin MA, De Hora M, Holly JM, et al. Fasting nonesteriied fatty acid proiles in childhood and their relationship with adi -posity, insulin sensitivity and lipid levels. Pediatrics 2007;120:e1426.
15. Lindsay rS, Hanson rL, roumain J, et al. Body mass index as a measure of adiposity in children and adolescents: relationship to adiposity by dual-energy X-ray absorptiometry and to cardio-vascular risk factor. J Clin Endocrinol Metab 2001;86:4061-4067. 16. Haroun D, Wells JC, Williams JE, et al. Composition of the
fat-free mass in obese and non-obese children: matched casa-con-trol analyses. Int J Obes (Lond) 2005;29:29-36.
17. Goran MI. Metabolic precursors and effects of obesity in chil-dren: a decade of progress, 1990-1999. Am J Clin Nutr 2001;73:158-171.
18. Pietrobelli A, Heymsield SB. Establishing body composition in obesity. J Endocrinol Invest 2002;25:884-892.
19. Leonard MB, Schults J, Wilson BA, et al. Obesity during child-hood and adolescence augments bone mass and bone dimen-sions. Am J Clin Nutr 2004;80:514-523.
20. Horlick M, Wang J, Pierson rN, et al. Prediction models for eva-luation of total-body bone mass with dual-energy X-ray absorp-tiometry among children and adolescents. Pediatrics 2004;114:337-345.
21. Bachrach LK. Bone mineralization in childhood and adolescen-ce. Curr Opin Pediatr 1993;5:467-473.
22. Gafni rI, Baron J. Childhood Bone Mass Acquisition and Peak Bone Mass May Not Be Important determinants of bone mass in late adulthood. Pediatrics 2007;119:S131.
23. Jurimae J. Bone mineral density in adolescent girls with diffe-rent physical activities pattern: relationship with body compo-sition and muscle performance parameters. Papers Anthropol XIV 2005;14:126-131.
Table 3 Comparison of body composition between 2 groups of children in Monterrey, Mexico.
Body composition (g)
Group without obesity ± SD
Group with obesity
± SD p
Total fat mass 8,134 ± 3,886 (24.2%)* 17,613 ± 5,605 (37.8%)* 0.001
Total lean mass 23,173 ± 5,441 (72.8 %)* 27,274 ± 5,970 (59.8%)* 0.001
Total bone mineral content 979 ± 278 (3.0%)* 1,094 ± 287 (2.4%)* 0.051
SD: standard deviation.
* Total percentage of body composition.