Computer simulations of the structure of
nanoporous carbons and higher density phases
of carbon
Lydia Alonso, Julio A. Alonso, and María J. López
AbstractThe most stable form of solid carbon is graphite, a stacking of graphene layers in which the carbon atoms showsp2hybridization which leads to strong
intra-layer bonding. Diamond is a denser phase, obtained at high pressure. I n diamond the carbon atoms showsp3hybridization. Metastable solid carbon phases can be
pre-pared also with lower density than graphite (in fact, densities lower than water); for instance the carbide-derived carbons. These are porous materials with a quite disor-dered structure. Atomistic computer simulations of carbide-derived carbons indicate that the pore walls can be viewed as curved and planar nanographene ribbons with numerous defects and open edges. Consequently, the hybridization of the carbon atoms in the porous carbons issp2. Because of the high porosity and large specific
surface area, nanoporous carbons find applications in gas adsorption, batteries and nanocatalysis, among others. We have performed computer simulations, employing large simulation cells and long simulation times, to reveal the details of the structure of the nanoporous carbons. In the dynamical simulations the interactions between the atoms are represented by empirical many-body potentials. We have also investi-gated the effect of the density on the structure of the disordered carbons and on the hybridization of the carbon atoms. At low densities, typical of the porous carbide-derived carbons formed experimentally, the hybridization issp2. On the other hand,
as the density of the disordered material increases, a growing fraction of atoms with
sp3hybridization appears.
Work dedicated to Professor N.H. March
Lydia Alonso·Julio A. Alonso·María J. López
Departamento de Física Teórica, Atómica y Óptica, Universidad de Valladolid, 47011 Valladolid, Spain
e-mail: jaalonso@fta.uva.es , e-mail: maria.lopez@fta.uva.es
3.1 Introduction
Nanoporous carbons exhibit a quite disordered structure with internal pores of nano-metric size. These materials have low densities and high specific surface areas, prop-erties which make them attractive in applications to gas adsorption and hydrogen storage, among others. The carbide-derived carbons (CDC) form an interesting fam-ily of nanoporous carbons. CDCs can be easfam-ily produced from metal carbides [1, 2], ZrC for instance, by selectively extracting the metal atoms through a chemical chlo-rination process performed at temperatures between 600◦C and 1200◦C. The struc-tural characteristics and the properties of these materials can be tuned by selecting the production conditions, in particular the reaction temperature, and the appropriate post-treatments of the samples. The microstructure of the CDCs has been investi-gated by Raman spectroscopy, X-ray diffraction and high-resolution transmission electron microscopy [3]. The elucidation of the structure of nanoporous carbons is greatly aided by computer simulations. Atomistic computer simulations of carbide-derived carbons reveal a disordered structure of connected pores of different size and shape [4, 5]. The pore walls can be viewed as curved and planar graphene frag-ments with numerous defects and some open edges. Consequently, the hybridization of the carbon atoms in this family of porous materials is that typical of graphene, that is,sp2. The increase of the experimental reaction temperature, and the increase
of the temperature and annealing time in the computer simulations, both induce a progressive repair of the long range disorder and a substantial increase of the de-gree of graphitization in the system [6]. A main characteristic of the porous carbons is their small densities (number of atoms per unit volume), and this is the reason for the easy formation of a network of interconnected planar and curved two dimen-sional graphene-like layers. In the other extreme, diamond is a solid phase of carbon denser than graphite, produced under extreme high pressure and temperature con-ditions in the earth mantle or by synthetic methods in the laboratory [7, 8, 9]. The atomic coordination around each carbon atom in diamond is four, and the electronic hybridization issp3. Although diamond is metastable (the most stable solid phase
of carbon is graphite), the rate of conversion of diamond to graphite is negligible at ambient conditions.
Early in 1977, Norman March and coworkers pioneered the investigation of the structure of amorphous carbon [10, 11]. Their conclusion was that the X-ray and electron diffraction intensities cannot be explained by simply considering a model structure and the appropriate atomic scattering factor, and that an explicit modelling of the chemical (covalent) bonds, is required. Amorphous carbon obtained by differ-ent experimdiffer-ental methods shows values of the interatomic distances and coordina-tion numbers in between those for graphite and diamond [12, 13]. An early proposal for the structure of amorphous carbons was a disordered mixture of small two-dimensional graphitic fragments (in which the carbon atoms havesp2
hybridiza-tion) linked by tetrahedrally bonded (sp3) atoms [14]. However, neutron diffraction
[4] revealed disordered structures formed by planar and curved graphitic fragments connected in a way leaving abundant empty spaces (pores), and the analysis of the structures indicated a very small amount of tetrahedrally coordinated carbon, cer-tainly below one per cent. The resulting material can be viewed as low density (0.77 g/cm−3) disordered carbon. Despite the highly disordered structure this type of car-bons are not clasified as amorphous carcar-bons. According to the recommendations of IUPAC [15], the term amorphous carbon is restricted to carbon materials having short-range order only (no long-range crystalline order) with deviations of the in-teratomic distances and/or interbonding angles with respect to the graphite lattice as well as to the diamond lattice. So, the term amorphous carbon is not applicable to materials with two-dimensional structural elements such as polyaromatic layers with a nearly ideal interatomic distance and an extension greater than one nanome-ter. Using density-functional molecular dynamics and simulation cells containing 216 atoms, Deringer and Csanyi [16] have found that the structure of amorphous carbon is a mixture of threefold (sp2) and fourfold (sp3) bonded atoms, the
pro-portion of these depending sensitively on the density. The densities investigated by these authors are between 1.5 and 3.5 g/cm−3(notice that the densities of graphite and diamond are 2.1−2.2 g/cm−
3and 3.5 g/cm−3, respectively). Motivated by all the above works we present here the results of an investigation of the structure of non crystalline carbons (including amorphous carbon) over a wide range of densi-ties, between 0.77 g/cm−3and 2.87 g/cm−3. One of the main purposes is to investi-gate the transition between disordered porous carbons and amorphous carbons, and to detect the critical density for which the amount of atoms with tetrahedral (sp3)
coordination begins to be noticeable. Because the proportion of atoms with tetrahe-dral coordination is expected to be small, except at high densities, it is necessary to work with simulation cells having a large enough number of atoms.
3.2 Theoretical models and dynamical simulations
Molecular dynamics simulations are performed to investigate the structural features of a variety of disordered carbon materials spanning a broad range of densities (0.7−2.8 g/cm
3). CDCs are porous carbon materials placed on the low density
N, constant volumeV, and constant temperatureT, at several temperatures. Thus we
simulate the structural transformation of the carbon skeleton of the carbide keeping constant the density of the carbon material along the simulation, similarly to the experimental conformal transformation. Two carbides have been considered: ZrC, which has a structure of two fcc interpenetrated lattices, andα-SiC, which has a 6H-hexagonal structure. The densities of the C atoms in the carbides are 0.77 g/cm3
and 0.96 g/cm3, respectively. Large simulation cells are used within the periodic
boundary conditions scheme to represent appropriately the disordered CDC porous structures. A 12×12×12 cubic cell of 56.376 Å of side, containing 6912 C atoms is used to simulate the CDCs derived from ZrC, and a 10×6×18 tetrahedral cell of dimensions 53.36×55.458×45.3 Å, containing 6480 C atoms is used for the CDCs derived from SiC. Amorphous carbons, on the other hand, are disordered high den-sity carbons, with densities between the denden-sity of graphite 2.1−2.2 g/cm
3and the
density of diamond, 3.5 g/cm3. As the density of carbon increases from the densities
typical of CDCs to the densities typical of amorphous carbons, the structure of the material is expected to experience a profound transformation. To assess the depen-dence of the final carbon structures on the density and on the initial configuration of the carbon atoms we have considered two types of materials, M1 and M2, having the initial structure of the carbon squeleton in ZrC and SiC, respectively, but with scaled C–C distances to produce the desired densities in the range of 0.77−2.87 g/cm
3.
Notice that the CDC derived from ZrC is the M1 material with density 0.77 g/cm3
and the CDC derived from SiC is the M2 material with density 0.96 g/cm3.
The selected temperatures for the simulations1,T
=350, 2100 and 3010 K, are higher than the temperatures of the chlorination process of about 600−1500 K. The reason being that the former determine the speed of the structural changes in the material whereas the latter correspond to the chemical procedure for extraction of the metal or silicon [4]. Moreover the simulation time, of the order of a few hundred picoseconds, is orders of magnitud smaller than the experimental times of several minutes or hours. Thus, the higher temperatures of the simulations spead up the structural changes and therefore compensate for the shorter simulation times. An empirical correlation can be established between the temperatures of the simulations and the experimental ones [4, 17]. To start the simulations, the initial velocities of the carbon atoms are set to a Maxwellian distribution corresponding to the selected simulation temperature. The Nosé-Hoover thermostat is used to keep constant the temperature along the simulations. The equations of motion are integrated with a time step of 0.5 fs. Simulation runs of 300 ps lead to well converged final structures, as it has been checked by performing simulation runs of 600 ps for some selected cases. The final structures obtained in the simulations are quenched down to 0 K in order to perform the structural analysis. The structures are then characterized on the basis of (i) the local ordering as measured by the coordination of the C atoms, which reflect thesp2orsp3hybridization of C, and the ring pattern of the C network, and
(ii) global quantities such as the specific surface area of the pore walls, the porosity
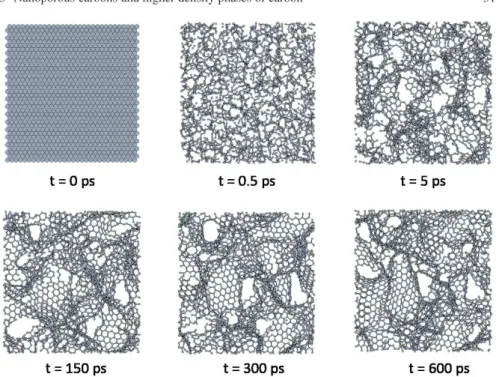
Fig. 3.1 Snapshots, for several times, of the formation of the CDC structure derived from SiC at a
simulation temperature of 3010 K. A slab of 25 Å of depth is shown for clarity.
(ratio of empty to total volume) and the size distribution of pores. In the simula-tions, the interatomic C-C interactions are mimicked through the Tersoff potential [18, 19, 20], that appropriately represents the covalent bonds between carbon atoms in graphite and diamond, plus a weak interaction potential [21] which is added to represent the interaction between layers in graphite.
3.3 Results
Fig. 3.2 Snapshots, for several times, of the formation of the M1 material with a density of
2.2 g/cm3, at a simulation temperature of 3010 K. A slab of 10 Å of depth is shown for clarity.
Clearly, after the removal of the metal atoms from the carbide the structure of the carbon atoms is highly unstable, and the internal collapse of the structure occurs very fast. C–C bonds begin to form in the material, and after 0.5 ps most atoms are linked together forming a highly disordered carbon network. Figure 3.1 shows several snapshots at different times of the simulation of the formation of a CDC de-rived from SiC at a simulation temperature of 3010 K. After about 5 ps, the structure evolves forming an incipient porous structure which fully develops at longer times. After 300 ps, the final porous structure is almost reached, the pore walls are graphitic layers with defects, interconnected with each other. It is clearly apparent that the car-bon atoms are not uniformly distributed in the material. Longer simulation times of the order of 600 ps only lead to minor modifications of the nanoporous structure of the CDC. This can be explained by the high thermal stability of the graphitic nanos-trips [22]. Quite similar formation pathways and final structures have been obtained for CDCs derived from the other precursor carbide, ZrC, at the same (T=3010 K)
simulation temperature [4].
However, different structures are produced for carbon materials with higher den-sities, of the order or higher than the density of graphite. As an example, Fig. 3.2 shows snapshots along the dynamics, of the formation of the M1 material (initial fcc configuration of the C atoms) with a density of 2.2 g/cm3. The internal collapse
of the carbon structure also occurs very fast, in about 0.5 ps, as in the previous case. However, at this relatively high density, the subsequent evolution of the carbon net-work is quite different. In contrast with the CDC’s, the high density M1 material does not develop a porous structure and it is not possible to identify in the structure flakes of graphitic layers. The C atoms form, instead, a disordered three-dimensional C network.
The local structure of the carbon network and the level of graphitization of the pore walls can be analized by investigating the coordination of the carbon atoms. The coordination number is defined as the number of nearest neighbors of an atom. Three-fold coordinated carbon atoms with sp2 hybridization are characteristic of
Fig. 3.3 Ratio of carbon atoms with coordinations one, two, three and four as a function of the
simulation time, for the CDC structure derived from SiC at a simulation temperature of 3010 K.
four (sp3hybridization) leads to three dimensional structures and is characteristic
of diamond. Figure 3.3 shows the time evolution along the simulation of the coor-dinations of the C atoms in the CDC structure obtained from the SiC precursor at a temperature of 3010 K. Coordinations two an three rise up within a few picoseconds. In about 5 ps, 70% of the C atoms become three-fold coordinated and about 30% become two fold coordinated. Coordinations one and four, on the other hand, are only marginaly present in the structure. As the time proceeds, the number of three-fold coordinated atoms increases slowly at the expense of the two-three-fold coordinated atoms. This indicates an increase of the size of the graphitic flakes accompained by the corresponding reduction of the edges. After about 600 ps the structure does not change any further and the different coordinations become almost flat as a function of time. The ratio of the number of C atoms with different coordinations is well converged within 1%. A slightly relaxed convergence criterion of 2−3% is fulfilled with simulation times of about 300 ps (see Fig. 3.3). A similar convergence with time has been found for the simulated M1 and M2 structures generated at differ-ent temperatures and for differdiffer-ent densities of carbon. Therefore, we will limit the simulations to 300 ps in order to reduce the computational cost of this study. The final structures obtained in the simulations are then quenched down 0 K in order to perform the structural analysis of the materials at equilibrium conditions.
For the low density materials (M1 and M2 with densities below 1.7 g/cm3), the
number of three-fold coordinated atoms increases with the simulation temperature indicating that the level of graphitization of the structure improves with tempera-ture. However, even at the highest simulation temperature (T =3010 K), the
Fig. 3.4 Number (in percent) of carbon atoms with coordinations one, two, three and four. Left pannel gives the coordinations as a function of the simulation temperature for the CDCs derived from SiC. Right pannel gives the coordinations as a function of the density for the M1 (open symbols) and M2 (solid symbols) materials produced atT=2100 K.
the coordinations as a function of temperature of the CDCs produced using SiC as the precursor.
Figure 3.4 also shows, in the right panel, the coordinations of the C atoms in the M1 and M2 materials as a function of the C density. The number of three-fold co-ordinated atoms increases and the number of two-fold coco-ordinated atoms decreases with increasing density, up to approximately the density of graphite (2.2 g/cm3).
This increase of 3-fold coordinated atoms, however, is not indicative of an improve-ment in the level of graphitization of the material, as can be clearly seen from the snapshots of Fig. 3.2. The graphitic layers become smaller and more interconnected among them giving rise to a highly disordered three-dimensional network ofsp2
C atoms. For larger densities, above the density of graphite, the trend changes and the number of three-fold coordinated atoms decreases in favor four-fold coordinated atoms, withsp3hybridization, which are characteristic of diamond-like structures.
Thus, the materials with a density of 2.7 g/cm3are formed by a mixture of
three-and four-fold coordinated C atoms with a ratio of about three (75%) to one (25%), respectively. This mixture of coordinations is also found in amorphous carbon ma-terials [16] although one should notice that a broad range of densities and ratio of coordinations is included under the generic name of amorphous carbons. The struc-tures obtained for a given density and at a given simulation temperature for the two types of materials investigated here, M1 and M2, are very similar, what leads us to conclude that the initial configuration of the C atoms for the simulations (cubic or hexagonal) has little effect in the final structure of the simulated materials. The more relevant parameter being the density of carbon atoms.
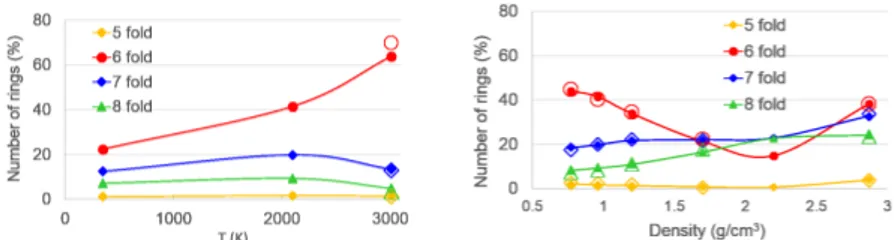
Fig. 3.5 Number (in percent with respect to the ideal number of hexagonal rings in a graphitic
layer) of five-, six-, seven-, and eight-fold rings. Left pannel: number of rings as a function of the simulation temperature for the CDCs derived from SiC. The solid and empty symbols correspond to simulation times of 300 and 600 ps, respectively. Right pannel: number of rings as a function of the density for the M1 (open symbols) and M2 (solid symbols) materials produced atT=2100 K.
materials are mainly formed by hexagonal rings, defining graphitic layers. Pentag-onal and smaller rings are completely absent and, therefore, closed pores can not be formed. However, there is a non negligible number of heptagons and octagons in the layers which lead to the interconnection of the pore walls and to the open character of the pores in these materials. The number of hexagonal rings increases with increasing simulation temperature, as it is shown in Fig. 3.5 (left panel) for the CDCs derived from SiC (a similar behaviour is observed for the CDCs derived from ZrC). This confirms the observed improvement with temperature of the level of graphitization of the pore walls. However, the number of heptagons and octagons, although smaller than the number of hexagons, remains almost constant with tem-perature; these rings do not disappear even at the highest simulation temperature, what prevents the formation of large graphitic layers.
The right pannel of Fig. 3.5 reveals that with increasing carbon density, up to ap-proximately the density of graphite, the number of hexagons decreases whereas the number of heptagons and octagons increases. As a consequence, the graphitic struc-ture and the local order of the strucstruc-ture disappear and, as it is observed in Fig. 3.2, a three-dimensional disordered network of sp2 C atoms develops. For densities
above the density of graphite, the number of hexagonal rings increases again and the number of heptagons and octagons also increases. The hexagonal rings, how-ever, now contain four-fold coordinated carbon atoms and are the signature of the development of diamond like structures. Thus, at high densities (below the densidy of diamond, 3.53 g/cm3) the materials become amorphous with highly disordered
structures and formed by a mixture of three- and four-fold coordinated C atoms, as discussed above.
Fig. 3.6 Specific surface area (SSA) as a function of the simulation temperature for the CDCs
derived from ZrC, empty symbols, and from SiC solid symbols.
fully available for gas adsorption, mainly due to the interconnection between lay-ers. From the simulated structures one can estimate that, in average, only about one side and half of the other side of the layers are exposed for gas adsorption. Thus to calculate the SSA, we multiply the surface of one side of the layers by the empirical factor of 1.5. Figure 3.6 shows the SSA for the CDCs derived from ZrC and SiC as a function of temperature. The SSA increases moderately with the temperature of the simulation following a similar trend as the experimentally determined SSA [23] for various CDCs as a function of chlorination temperature. The simulated values match rather well the experimental values. Moreover we found no much difference between the two low density CDC’s investigated, derived from ZrC and from SiC, respectively. For the high density simulated materials, the geometrical determina-tion of the SSA is not physically meaningful since the number of rings does not correlate with the surface available for gas adsorption, as it has been seen above.
Fig. 3.7 Specific pore volume, SPV. Left pannel: SPV as a function of the simulation temperature
for the CDCs derived from ZrC, empty symbols, an from SiC solid symbols. Right pannel: SPV as a function of the density for the M1 (open symbols) and M2 (solid symbols) materials produced at T=2100 K.
exhibit a broader range of variation of the porosity with the chorination tempera-ture, most probably due to a better level of annealing of the structures. The porosity, however, depends sensitively on the density of the material (see Fig. 3.7). With the geometrical definition given above, the porosity of graphite results in a negligible value, as is confirmed from adsorption experiments. The simulations lead to small values ot the porosity for both M1 and M2 materials for densities of the order of the density of graphite, and zero porosities for larger densities. The simulated M1 and M2 materials exhibit the same porosities for the same densities, confirming once more the weak dependence on the initial configuration of the C atoms and the more relevant dependence on the density of the material.
The gas adsorption capacity of a material is related with its specific surface area and its porosity. However, it has been shown both, from the experimental [24, 25] and theoretical [26] sides, that the adsorption capacity does not perfectly correlate with these two quantities but it depends on the size of the pores. For instance, it has been determined that the optimum pore size for hydrogen adsorption at room temperature is in the range of 7−11 Å [27]. Thus, to fully characterize the porous structure of a material and its adsorption characteristics it is convenient to determine the pore size distribution function (PSD), that measures the total volume contained in pores of a given size. From the simulation side, PSD is a very demanding quantity to compute since large simulation cells are required to obtain meaningful distribu-tions. The simulation cells considered in this work (of about 50 Å wide) are suf-ficiently large to reproduce the distribution functions for pores smaller than about 20 Å. Larger pores are escarcely produced in these cells and, therefore, the distribu-tion funcdistribu-tions are not accurate for pores larger than about 20 Å. On the other hand, since the pores have not regular shapes and are interconnected among them, one has to introduce a model of pores to determine their size distribution. Based on our simulated structures we found appropriate to use a geometrical model of nonover-lapping spheres [4] to represent the pores. Figure 3.8 shows the pore size distribution function, PSD, of the CDCs obtained using SiC as the precursor, for several simu-lation temperatures. The CDCs produced at low temperatures (T =350 K) exhibit
Fig. 3.8 Pore size distribution function, PSD of the CDCs obtained using SiC as the precursor, for
several simulation temperatures (left panels). PSD of M2 materials of various densities produced at a temperature ofT=3010 K (right panels). Average pore size is indicated in each graph.
average pore size increases up to a value of about 11 Å forT =3010 K. Although
the maximum size of the pores (about 20 Å) is limited by the size of the simulation cell, this does not affect the general trends of the PSDs below that size. A similar behaviour has been obtained for the CDCs derived from ZrC as a precursor. The trends in the simulated PSD functions are in good agreement with the PSDs de-termined from experimental adsorption isotherms for CDCs produced from several precursor carbides [3].
On the other hand, similarly to the porosity, the PSD depends strongly on the density of the material. The PSD becomes narrower with increasing density and the size of the pores decreases. At approximately the density of graphite, the network of C atoms does not leave empty space and therefore the material does not contain pores any more (see Fig. 3.8 for M2 materials; a similar behaviour has been found for M1 materials).
3.4 Conclusions
materials ranging from CDCs porous carbons with densities of 0.77−0.96 g/cm
3to
amorphous carbons with densities of 2.8 g/cm3have been considered. The
simula-tions have been designed to closely mimic the experimental process of formation of CDCs from metal carbides once the extraction of the metal has taken place and gen-eralized for materials with different densities. Thus, the initial configurations for the NVT dynamical simulations were the structures of the C atoms in two carbides, ZrC an SiC. Moreover, materials with different densities are generated using those two initial configurations but scaling the C–C distances to produce the desired densities. Upon removal of the metal from the carbide, the collapse of the structure takes place very fast, in about a few ps, giving rise to a C network ofsp2C atoms. A porous
structure of open interconnected pores appears; the pore walls are one atom thick graphitic-like layers interconnected among them. The level of graphitization of the pore walls is assessed in terms of the coordinations of the C atoms and the ring structure of the C network. For the CDCs and the low density C materials with den-sities below 1.7 g/cm3, there is a prevalence of three-fold coordinated C atoms and
hexagonal rings, confirming the graphitic-like structure of the pore walls. However, there is a non negligible number of two-fold coordinated C atoms, corresponding to the edges of the graphitic flakes, and heptagonal and octagonal rings that lead to open pores. With increasing temperature, the level of graphitizacion improves, al-though the edges and the heptagonal/octogonal defects do not disappear completely. At higher densities, of the order or higher than the density of graphite, there is still a prevalence of the coordination three, but four-fold coordinated C atoms appear and its percentage increases with increasing density. The carbon network loses pro-gressively its graphitic character with the appearance of diamond-like tetrahedral structures that mark the transition towards amorphous carbons. Thus, the high den-sity materials are formed by a combination ofsp2andsp3C atoms and the three
dimensional C network does not enclose pores.
The specific surface area (SSA), the porosity, and the pore size distribution func-tion (PSD) characterize the adsorpfunc-tion properties of a material. In agreement with experimental determinations, we found that the SSA of the simulated CDCs in-creases with increasing temperature, reaching values close to 2000 m2/g. The
poros-ity of the CDCs and the average size of the pores also increase with increasing temperature and the PSD becomes wider in close analogy with the experimental trends. However, with increasing carbon densities, the porosity drops dramatically and, as expected, for densities of the order and higher than the density of graphite the porosity vanishes.
In summary, we have found that the structure of the simulated carbon materials is not sensitive to the initial configuration of the C atoms. However, the structure is strongly dependent on the density, observing a transition from porous to amorphous structures at approximately the density of graphite. High temperatures favor higher level of graphitization in lower density, CDCs carbons.
Acknowledgements This work was supported by MINECO of Spain (Grant MAT2014-54378-R)
References
1. W.A. Mohun, inProceedings of the 4th biennial conference on carbon, ed. by Y. Zhou (Perg-amon Press, Oxford, 1960), pp. 443–453
2. Y. Gogotsi, A. Nikitin, H. Ye, W. Zhou, J.E. Fischer, B. Yi, H.C. Foley, M.W. Barsoum, Nat. Mater.2(9), 591 (2003). DOI 10.1038/nmat957
3. G. Yushin, R. Dash, J. Jagiello, J. Fischer, Y. Gogotsi, Adv. Funct. Mater.16(17), 2288 (2006).
DOI 10.1002/adfm.200500830
4. M.J. López, I. Cabria, J.A. Alonso, J. Chem. Phys. 135(10), 104706 (2011). DOI
10.1063/1.3633690
5. J.A. Alonso, I. Cabria, M.J. López, J. Mater. Res. 28(4), 589 (2013). DOI 10.1557/jmr.2012.370
6. C. de Tomás, I. Suarez-Martinez, F. Vallejos-Burgos, M.J. López, K. Kaneko, N.A. Marks, Carbon119, 1 (2017). DOI 10.1016/j.carbon.2017.04.004
7. J.C. Angus, C.C. Hayman, Science 241(4868), 913 (1988). DOI
10.1126/science.241.4868.913
8. F.P. Bundy, W.A. Bassett, M.S. Weathers, R.J. Hemley, H.U. Mao, A.F. Goncharov, Carbon
34(2), 141 (1996). DOI 10.1016/0008-6223(96)00170-4
9. J. Narayan, A. Bhaumik, J. Appl. Phys.118(21), 215303 (2015). DOI 10.1063/1.4936595
10. B. Stenhouse, P.J. Grout, N.H. March, J. Wenzel, Phil. Mag. 36(1), 129 (1977). DOI
10.1080/00318087708244453. Reprinted in Ref. [28].
11. B.J. Stenhouse, P.J. Grout, J. Non-Cryst. Sol. 27(2), 247 (1978). DOI 10.1016/0022-3093(78)90127-8
12. D.F.R. Mildner, J. Carpenter, J. Non-Cryst. Solids47(3), 391 (1982). DOI 10.1016/0022-3093(82)90215-0
13. C.A. Majid, J. Non-Cryst. Solids57(1), 137 (1983). DOI 10.1016/0022-3093(83)90416-7
14. T. Noda, M. Inagaki, Bull. Chem. Soc. Jap.37(10), 1534 (1964). DOI 10.1246/bcsj.37.1534
15. E. Fitzer, K. Kochling, H.P. Boehm, H. Marsh, Pure Appl. Chem.67, 473 (1995). DOI
10.1351/pac199567030473. (IUPAC Recommendations 1995)
16. V.L. Deringer, G. Csányi, Phys. Rev. B 95, 094203 (2017). DOI
10.1103/PhysRevB.95.094203
17. C. de Tomas, I. Suarez-Martinez, N.A. Marks, Carbon 109, 681 (2016). DOI
10.1016/j.carbon.2016.08.024
18. J. Tersoff, Phys. Rev. B37, 6991 (1988). DOI 10.1103/PhysRevB.37.6991
19. J. Tersoff, Phys. Rev. Lett.61, 2879 (1988). DOI 10.1103/PhysRevLett.61.2879
20. Marcos, P. A., Alonso, J. A., Rubio, A., López, M. J., Eur. Phys. J. D6(2), 221 (1999). DOI
10.1007/s100530050304
21. K. Nordlund, J. Keinonen, T. Mattila, Phys. Rev. Lett. 77, 699 (1996). DOI
10.1103/PhysRevLett.77.699
22. M.J. López, I. Cabria, N.H. March, J.A. Alonso, Carbon 43(7), 1371 (2005). DOI
10.1016/j.carbon.2005.01.006
23. R.K. Dash, G. Yushin, Y. Gogotsi, Micropor. Mesopor. Mat. 86(1), 50 (2005). DOI
10.1016/j.micromeso.2005.05.047
24. A. Linares-Solano, M. Jordá-Beneyto, D.L.C.M. Kunowsky, F. Suárez-García, D. Cazorla-Amorós, inCarbon Materials: Theory and Practice, ed. by A. Terzyk, P. Gauden, P. Kowal-czyk (Research Signpost, Kerala, India, 2008), pp. 245–281
25. Y. Gogotsi, R.K. Dash, G. Yushin, T. Yildirim, G. Laudisio, J.E. Fischer, J. Am. Chem. Soc.
127(46), 16006 (2005). DOI 10.1021/ja0550529
26. I. Cabria, M.J. López, J.A. Alonso, Carbon 45(13), 2649 (2007). DOI
10.1016/j.carbon.2007.08.003
27. I. Cabria, M.J. López, J.A. Alonso, Int. J. Hydrogen Energy 36(17), 10748 (2011). DOI
10.1016/j.ijhydene.2011.05.125. International Conference on Hydrogen Production (ICH2P)-2010