Contents lists available atScienceDirect
Respiratory Physiology & Neurobiology
j o u r n a l h o m e p a g e :w w w . e l s e v i e r . c o m / l o c a t e / r e s p h y s i o l
Effects of mitochondrial poisons on glutathione redox potential and
carotid body chemoreceptor activity
A. Gomez-Ni ˜
no, M.T. Agapito, A. Obeso, C. Gonzalez
∗Departamento de Bioquímica y Biología Molecular y Fisiología, Universidad de Valladolid, Facultad de Medicina, Instituto de Biología y Genética Molecular, CSIC, Ciber de Enfermedades Respiratorias, CIBERES, Instituto de Salud Carlos III, 47005 Valladolid, Spain
a r t i c l e
i n f o
Article history:
Accepted 28 October 2008
Keywords: Oxygen-sensing Carotid body
Reactive oxygen species Hypoxia
GSH GSSG Catecholamine ATP
a b s t r a c t
Low oxygen sensing in chemoreceptor cells involves the inhibition of specific plasma membrane K+
chan-nels, suggesting that mitochondria-derived reactive oxygen species (ROS) link hypoxia to K+ channel
inhibition, subsequent cell depolarization and activation of neurotransmitter release. We have used sev-eral mitochondrial poisons, alone and in combination with the antioxidant N-acetylcysteine (NAC), and quantify their capacity to alter GSH/GSSG levels and glutathione redox potential (EGSH) in rat diaphragm.
Selected concentrations of mitochondrial poisons with or without NAC were tested for their capacity to activate neurotransmitter release in chemoreceptor cells and to alter ATP levels in intact rat carotid body (CB). We found that rotenone (1M), antimycin A (0.2g/ml) and sodium azide (5 mM) decreasedEGSH;
NAC restoredEGSHto control values. At those concentrations mitochondrial poisons activated
neurotrans-mitter release from CB chemoreceptor cells and decreased CB ATP levels, NAC being ineffective to modify these responses. Additional experiments with 3-nitroprionate (5 mM), lower concentrations of rotenone and dinitrophenol revealed variable relationships betweenEGSHand chemoreceptor cell neurotransmitter
release responses and ATP levels. These findings indicate a lack of correlation between mitochondrial-generated modifications ofEGSHand chemoreceptor cells activity. This lack of correlation renders unlikely
that alteration of mitochondrial production of ROS is the physiological pathway chemoreceptor cells use to signal hypoxia.
© 2008 Elsevier B.V. All rights reserved.
1. Introduction
Carotid body (CB) chemoreceptor cells and pulmonary artery smooth muscle cells (PASMC) detect hypoxia with a very low threshold (PO2 70–75 mmHg) (Gonzalez et al., 1994; Marshall et al., 1994) generating adaptive responses (Richalet, 1997; Gonzalez, 1998). In both cell types the hypoxic transduction cascade involves inhibition of O2-sensitive K+channels, activation of voltage oper-ated Ca2+channels, and generation of Ca2+-dependent responses (López-Barneo et al., 1988; Post et al., 1992; Gonzalez et al., 2002). In CB chemoreceptor cells, final output of the hypoxic transduc-tion cascade is the Ca2+-dependent release of neurotransmitters, and the magnitude of neurotransmitter release response is propor-tional to the intensity of hypoxia (Fidone et al., 1982; Montoro et al., 1996; Vicario et al., 2000). In both cell types it has been proposed that reactive oxygen species (ROS) play a critical role linking low PO2to K+channel inhibition.
For CB chemoreceptor cellsAcker (1994)proposed that the O2 -sensor would be a phagocyte-like NADPH oxidase, which inhibited
∗ Corresponding author. Tel.: +34 983 423089; fax: +34 983 423588.
E-mail address:[email protected](C. Gonzalez).
by hypoxia would cause a decrease in the rate of ROS production; decreased ROS levels would increase the cellular GSH/GSSG ratio, and thereby a reduction of S S bridges in the K+channel protein, leading to the observed inhibition of K+channels. Later on,Obeso et al. (1999)and byHe et al. (2005)found, respectively, that maximal pharmacological inhibition of NADPH oxidase did not abolished the release of neurotransmitters elicited by hypoxia in chemorecep-tor cells and that NADPH oxidase knockout mice cells exhibited normal or even exaggerated sensitivity to hypoxia. More recently it has been suggested that in chemoreceptor cells hypoxia would increase (Chandel and Schumacker, 2000) or decrease mitochon-drial ROS production (Porwol et al., 2001). Mitochondria would represent the O2-sensor, and altered levels of mitochondrial ROS would gain cell cytoplasm to oxidize SH or to reduce S S groups in K+channels leading to their inhibition. Along these lines, increased mitochondrial ROS production has been implicated in the long-term facilitation of the CB function produced by intermittent hypoxia (Peng et al., 2003).
In the case of PASMC it has also been published that modu-lation of the rate of mitochondrial ROS production plays a role in the hypoxic inhibition of K+ channels. There are also two dia-metrically opposed views: that hypoxia increases mitochondrial ROS (Waypa et al., 2001; Waypa and Schumacker, 2006) and that
hypoxia decreases mitochondrial ROS (Archer et al., 1999; Moudgil et al., 2005). Implications derived from these opposed views are that an augmentation or a diminution of mitochondrial ROS are the factors coupling hypoxia to K+channel inhibition in PASMC.
These uncertainties regarding the significance of mitochondrial ROS in O2-sensing have prompted the present study. We have used several mitochondrial blockers and the uncoupler dinitrophenol (DNP) to modify the rate of mitochondrial ROS production and have concomitantly studied the function of chemoreceptor cells. We have assessed the rate of ROS production by measuring tissue levels of reduced and oxidized glutathione (GSH and GSSG respectively) and deriving the glutathione redox potential (EGSH) (Schafer and Buettner, 2001). The activity of chemoreceptor cells was measured as their rate of catecholamine (CA) release (Gonzalez et al., 1994); we also measured ATP content in the CB. The experimental setup was as follows: different concentrations of each mitochondrial poi-son were tested for their ability to alterEGSHon rat diaphragms, and selected concentrations capable of altering theEGSH, were used to study their effects on the release of CA and ATP content. We also tested the effect of the antioxidant N-Acetylcysteine (NAC), a known precursor for glutathione synthesis and ROS scavenger, on the redox balance and CB responses.
2. Material and methods
2.1. Surgical procedures
2.1.1. Removal and dissection of rat diaphragm
Adult Wistar rats of both sexes (body weight 250–300 g) were anaesthetized with sodium pentobarbital (60 mg/kg, i.p.) dissolved in physiological saline. Diaphragm was removed and placed in a lucite chamber filled with ice-cold 100% O2saturated Tyrode (in mM: NaCl, 140; KCl, 5; CaCl2, 2; MgCl2, 1.1; glucose, 5.5; HEPES, 10; pH 7.40 with 1N NaOH). Under a dissecting microscope, the diaphragm was cleaned and cut in four quadrants, each constituting an experimental sample.
2.1.2. Removal and dissection of rat CB
Under the same anesthesia a longitudinal incision was made in the ventral surface of the neck. This permitted the location of carotid arteries, and the dissection of the carotid bifurcation region, which was then placed in a lucite chamber. With the aid of a dissecting microscope the CB was identified and cleaned of connective tissue. Animals were killed by an intracardiac overdose of Na-pentobarbital. Protocols were approved by the Institutional Committee of the University of Valladolid for Animal Care and Use.
2.2. Measurement of GSH and GSSG levels
2.2.1. Tissue incubation
Each of the four segments of the diaphragm was placed in a glass scintillation vial containing 10 ml of bicarbonate-buffered Tyrode (composition as before except for the substitution of 24 mM NaCl with 24 mM of NaHCO3) and kept in a metabolic shaker bath at 37◦C. They were initially incubated for 30 min in Tyrode-bicarbonate equilibrated with 21% O2/5% CO2allowing the tissue to recover from the dissection stress and thereby assuring uniformity of conditions throughout the samples. This incubating solution was discarded and replaced by fresh control solution or solutions con-taining the different metabolic poisons at concentrations specified in Section3; in most of the experiments this incubation lasted 10 min. Incubating vials were continuously bubbled with the gas mixture saturated with water vapor. At the end of the incubation, the samples were placed for 5 min in new glass vials contain-ing 10 ml of ice-cold Tyrode equilibrated with 100% O2. Tissues
were dry-blotted on filter paper, weighed and placed in eppendorf tubes with a solution of 5-sulfosalicylic acid (SSA) at 5% contain-ing 0.25 mM EDTA; SSA solution volume was adjusted to 5×tissue weight. Tissues were glass to glass homogenized at 0–4◦C or stored at−80◦C until assay (Gonzalez et al., 2004b). Homogenates were centrifuged (4◦C, 10 min) and the supernatant was used to measure GSH/GSSG.
2.2.2. GSH and GSSG assays
The measurement of GSH and GSSG was made with the method ofGriffith (1980)as described in detail (Gonzalez et al., 2004b). Spontaneous reduction of 5,5-dithiobis-(2-nitrobenzoic acid) (DTNB) by GSH generates 5-thio-2-nitrobenzoic acid (TNB; peak absorbance at 412 nm) and GSSG. The GSSG formed is back-reduced enzymatically to GSH by glutathione reductase coupled to NADPH oxidation. This enzymatic step makes the assay highly specific, and cycling renders it very sensitive (10−10mol/assay). Reactant concentrations (DTNB, NADPH and glutathione reductase) were selected to obtain a linear rate of color formation during 2–3 min. The slope of the linear color formation (absorbance/min) is directly proportional to the glutathione in the sample. Assaying standards with different amounts of GSH and plotting absorbance change as a function of time yield several lines with different slopes. The plot of slopes of these lines as a function of the GSH used is also linear and defines the standard curve. This standard curve allows calculation by interpolation of the concentrations of total glutathione (GSt = GSH + GSSG) in the problem samples. To specif-ically determine GSSG, the GSH present in the supernatants is destroyed with 2-vinylpyridine and later assayed as before, except for the use of sample and glutathione reductase amounts due to the lower concentration of GSSG in the tissues. Standard and prob-lem samples were assayed in triplicate. In probprob-lem samples, the concentration of GSH is obtained as the difference GSt−GSSG. The standard curves to measure GSt and GSSG are usually prepared with GSH because the enzymatic cycling makes it irrelevant to start with GSH or GSSG. It should be noted that each molecule of GSSG yields two molecules of GSH and therefore, when we determine GSt in the tissue we are actually measuring GSH + 0.5 GSSG, and when we are measuring GSSG we are in fact measuring half its molar concentration. Adequate corrections were made when plotting the data. Glutathione redox potential (EGSH) was calculated as a Nernst potential (Schafer and Buettner, 2001).
2.3. Catecholamine release by the CB
2.3.1. Isotopic labeling of CA deposits in the CB
Deposits of CA present in chemoreceptor cells were labeled by incubating the organs with3H-tyrosine, the natural precursor of CA. The intact CBs were incubated in small glass vials (37◦C; 2 h; in a shaking bath) containing 0.5 ml of Tyrode solution. The incubating solution contained 3,5-3H-tyrosine (30M; 45 Ci/mmol; Amer-sham, Spain) and 100M 6-methyl-tetrahydropterine and 1 mM ascorbic acid, cofactors for tyrosine hydroxylase and dopamine- -hydroxylase, respectively (Fidone and Gonzalez, 1982); usually 8 CBs were incubated simultaneously.
2.3.2. 3H-CA release measurement
glass scintillation vials and, to prevent degradation of the3H-CA released, they were acidified to pH 3 by the addition of glacial acetic and ascorbic acid and maintained at 4◦C. Finally CB tis-sues were homogenized (0.4N perchloric acid; 1 ml), centrifuged for 10 min and the supernatant stored for3H-CA analysis.3H-CA were adsorbed into alumina at alkaline pH (8.6), bulk eluted with 1 ml of 1N HCl and quantified by liquid scintillation counting.
2.4. Measurement of ATP content
Since ATP levels in tissues are very labile and potentially altered by experimental manipulations, special precautions were taken to perform all the assays in strictly identical conditions (Obeso et al., 1986, 1989). Briefly, after surgical removal and cleaning, CBs were incubated in Tyrode-bicarbonate at 37◦C and continuously bubbled with 20%O2, 5%CO2,75%N2saturated with water vapor for 20 min. This initial incubation solution was discarded and replaced by a new one, either control or drug-containing solution and the incubation proceeded for an additional 10 min. At the end of the incubation CBs were placed on pre-cooled (−20◦C) homogenizer pestles and homogenized (glass to glass) in ice-cold 0.6N PCA (100l). The samples were then centrifuged at 4◦C, the supernatants neutral-ized with 2.4N potassium bicarbonate, and after 20 min centrifuged again. ATP was measured in these last supernatants by a bio-luminescence luciferine-luciferase assay (FLE50, Sigma). For ATP quantification 100l of sample supernatants were added to 2 ml of buffer (20 mM HEPES, 5 mM NaHPO4, 25 mM MgCl2, pH 7, 4) at room temperature. The reaction begins when the enzyme is added to the mixture. The samples were analyzed for 1 min by biolumi-nescence using a lumibiolumi-nescence counter (Beckman). Quantification of endogenous ATP levels in the CB was calculated by interpolation in standard curves.
2.5. Drugs
The following mitochondrial poisons were used in the present study: rotenone (Rot, blocker of complex I), 3-nitropropionic acid (3-NP, blocker of complex II), antimycin A (AA, blocker of complex III), sodium azide (SA, blocker of complex IV), and the mito-chondrial uncoupler 2,4-dinitrophenol (DNP). We have also used N-acetylcysteine (NAC), which is a precursor for glutathione syn-thesis and ROS scavenger. All drugs were obtained from Sigma (Madrid, Spain).
2.6. Statistics
Data are expressed as mean±SEM and compared for statisti-cal significance using a two tails Student-t-test for unpaired data. Significance level was established atp< 0.05.
3. Results
3.1. Effects of mitochondrial blockers and DNP on ROS production in rat diaphragm
Selection of mitochondrial poisons concentrations. The size of the CB (≈50g) (Vicario et al., 2000) precludes its use for measur-ing GSH and GSSG and for derivmeasur-ingEGSH (Gonzalez et al., 2004a). Therefore, we used diaphragm to test the effects of mitochon-drial poisons onEGSH, and based upon these, concentrations for use in the CB were selected. Fig. 1 shows findings obtained in response to different concentrations of rotenone, a blocker of the complex I. In the upper and middle panel are shown, respectively, the levels of GSH and GSSG present in the diaphragm in control
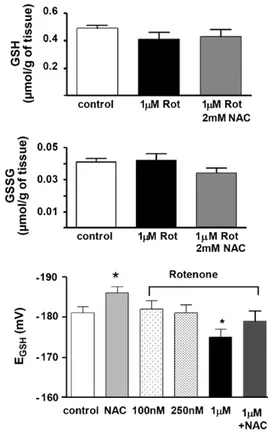
Fig. 1.Effects of the complex I blocker, rotenone (0.1–1M), and the antioxidant NAC (2 mM) on GSH, GSSG, and glutathione redox potential in rat diaphragm. Top panel shows the level of GSH in control conditions (empty bar), in tissue incubated with 1M rotenone (dark bar) and in tissue incubated with rotenone 1M plus NAC 2 mM (grey bar). Middle panel shows the amounts of GSSG on the above conditions. Data are expressed asmol/g of tissue. The bottom panel represents data expressed as glutathione redox potential (mV). NAC (2 mM) induced a significant increase on glutathione redox potential due mainly to the increase of GSH. Only rotenone 1M caused a significant decrease onEGSHpotential. The addition of NAC reversed the effect of rotenone 1M onEGSH(data are mean±SEM of 10–12 individual values. *p< 0.05).
conditions, in diaphragms incubated with 1M rotenone and in diaphragms incubated with 1M rotenone + 2 mM NAC. GSH lev-els in control tissues were 0.49mol/g fresh tissue with GSSG levels amounting to 0.020mol/g fresh tissue. Rotenone 1M caused a tendency for GSH to decrease to 0.41mol/g and a tendency for GSSG to increase to 0.021mol/g. Preincubation (10 min) of the diaphragms with 2 mM NAC immediately prior to and during the incubation with 1M rotenone altered the effects induced by rotenone (GSH rose to 0.43 and GSSG decrease to 0.018mol/g). The lower panel shows meanEGSHpotentials in control conditions, in the presence of NAC (2 mM), in the presence of different concen-trations of rotenone and in the presence of 1M rotenone + 2 mM NAC. As expected NAC significantly increased controlEGSH from
−181±1.5 to−186±1.5 mV (p< 0.05). Rotenone at concentrations of 100 and 250 nM did not alter theEGSH, but at 1M decreased it to−175±2 mV (p< 0.05). Rotenone (1M) in NAC preincubated tissues yieldedEGSHof−179±2.5 mV, not different from control.
Fig. 2.Effects of mitochondrial poisons onEGSHin rat diaphragm. Top panel shows EGSHin control tissues (empty bar), in tissues treated with 2 mM NAC (grey bar) and in tissues incubated with different mitochondrial poisons as labeled in the drawing (Rot, 1M; 3-NP, 5 mM; AA, 0.2g/ml; SA, 5 mM, and; DNP, 100M). Lower panel shows the effects of same mitochondrial poisons onEGSHin tissues incubated NAC the 10 min prior to and during the treatment with mitochondrial poisons (data are mean±SEM of 10–12 individual values. *p< 0.05; **p< 0.01; ***p< 0.001).
GSSG concentrations, and consequentlyEGSH potential decreased
−160 mV; p< 0.01 vs. control). Antimicyn A is a blocker of the coenzyme Q–cytochrome c reductase (complex III), which at a concentration of 0.2g/ml caused a very significant decrease of EGSH to−165±2 mV (p< 0.001). No additional concentrations of antimicyn A were tested. Sodium-azide, a blocker of cytochrome coxidase (complex IV), was tested at concentrations of 1, 5 and 10 mM. Sodium azide (1 mM) produced a minor decline inEGSH that did not reach statistical significance when compared with con-trol tissues. As plotted inFig. 2, 5 mM sodium azide decreased the EGSHto−163±1.5 mV (p< 0.001). A higher concentration (10 mM) further decreased EGSH to−160±1.5 mV (p< 0.001; not shown). The mitochondrial uncoupler DNP was tested at concentrations of 100 (plotted in the figure), 250 and 1000M. DNP did not alter EGSH at none of the concentrations used. Bottom panel ofFig. 2 shows results obtained in parallel experiments in which mitochon-drial poisons were tested in tissues treated with 2 mM NAC. This antioxidant reversed the oxidative effect of blockers of the electron transport chain onEGSH; NAC did not modifyEGSH levels in DNP treated tissues. Concentrations of mitochondrial poisons shown in Fig. 2were used in the rest of experiments.
3.2. Effects of mitochondrial blockers and DNP on the release of 3H-CA from CB chemoreceptor cells
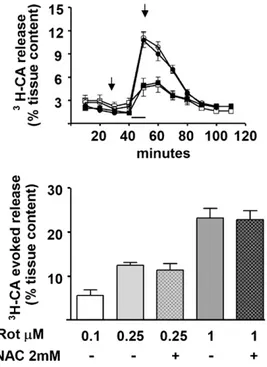
Fig. 3shows the capacity of rotenone to activate chemoreceptor cells and their release of3H-CA; this figure also aims to illustrate the general protocol of the release experiments. The upper panel of Fig. 3 shows the time course of the 3H-CA release response elicited by 250 nM and 1M rotenone. Rotenone applied for 10 min elicited a prompt release that declined slowly to basal levels upon incubation with rotenone-free solutions; note also that treatment with NAC (10 min before and during rotenone application) did not alter the time course of the3H-CA release response elicited by
Fig. 3.Effects of Rotenone on the normoxic3H-CA release from rat CB. Top panel shows the mean time course of the release response elicited by 0.25 (empty circles) and 1M (empty squares) rotenone. The filled symbols represent the time course of the release elicited by the same concentrations of rotenone in CBS that have been treated with NAC as the indicated in the drawing by the arrows. Lower panel shows the release evoked by different concentrations of rotenone with or without NAC. Note the clear dose-dependence effect of rotenone and the lack of effect of NAC both, in the time course and in the total evoked response (data are mean±SEM of 8–10 individual values).
250 nM and 1M rotenone. The bottom panel shows the accumu-lated release response, equivalent to the area under the curves in previous panel, elicited by 100, 250 and 1000 nM rotenone in the absence and in the presence of NAC. In addition to a clear dose dependence of rotenone action, data also indicate that the release response elicited by rotenone is not affected by the treatment with the antioxidant.
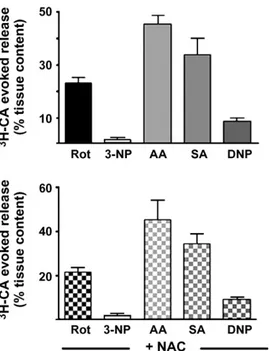
Fig. 4 shows a summary of the accumulated 3H-CA release responses elicited by different mitochondrial poisons in the CB chemoreceptor cells (top); the bottom part of the figure shows release responses elicited by the same drugs in CBs treated with 2 mM NAC. All mitochondrial poisons were applied for 10 min, except 3-NP that was applied for 30 min. Concentrations of drugs were those represented in Fig. 2, i.e., 1M rotenone, 5 mM 3-NP, 0.2g/ml antimycin A, 5 mM sodium azide and 100M DNP; as in previous experiments NAC was applied 10 min before and during mitochondrial poisons application. 3-NP elicited a very small release response that barely doubled the3H-CA basal release obtained in the absence of any drug. On the contrary, antimycin A and sodium azide were potent stimuli that promoted a fast onset response with a slow recovery of basal release rates upon drug removal. DNP at the concentration plotted produced a moderate release response, but higher concentrations produced a dose-dependent increase in the secretory response (Obeso et al., 1989). Treatment of CBs with the antioxidant did not modify the3H-CA release elicited by any of the mitochondrial poisons (bottom panel).
3.3. Effects of mitochondrial blockers and DNP on the CB ATP content
Fig. 4. Release of3H-CA by chemoreceptor cells evoked by mitochondrial poisons in normoxia. Top panel shows the evoked release response elicited by Rot (1M), 3-NP (5 mM), AA (0.2g/ml), SA (5 mM) and DNP (100M). Lower panel shows the effects of same mitochondrial poisons on CB treated with NAC. The antioxidant did not modify any of the response (data are mean±SEM of 8–10 individual values).
to isolated organs and isolated cells. O2-sensing and hypoxia generated responses have been linked to mitochondria and elec-tron transport chain-ATP synthesis, albeit in different manners (Mulligan and Lahiri, 1982vs.Obeso et al., 1989; Ortega-Sáenz et al., 2003vs.Wyatt and Buckler, 2004). The apparent lack of correlation between ROS production and chemoreceptor cell activation exhib-ited by mitochondrial poisons (e.g., experiments with and without NAC), prompted a group of experiments aimed to verify that at the concentrations tested, mitochondrial poisons were indeed effec-tive mitochondrial agents in the CB. Top panel of Fig. 5shows that basal ATP concentration in the rat CB was 1.46±0.07mol/g of fresh tissue. Rotenone applied for 10 min at a concentration of 1M decreased the CB ATP content to around 1/3 of the control level (0.51±0.09mol/g of fresh tissue). 3-NP (5 mM; 30 min) did not alter ATP levels in the CB. Antimycin A (10 min; 0.2g/ml) decreased ATP levels to nearly 50% (0.77±0.09mol/g), and the concentration of sodium azide tested (5 mM, 10 min) was also very effective in reducing ATP levels in the CB. The uncoupler DNP (100M) did not decrease ATP levels (1.46±0.09mol/g of fresh tissue), however, increasing the concentration to 500M reduced ATP to 0.81±0.06mol/g of fresh tissue (not shown). The bottom panel ofFig. 5demonstrate that NACper seneither modified the ATP content in control CBs nor altered the effects induced by mito-chondrial poisons.
4. Discussion
The aim of the present study has been to search for a link between levels of mitochondrial-derived ROS and the activity in chemoreceptor cells. To alter mitochondrial ROS production we have used several blockers of the respiratory chain and the mito-chondrial uncoupler DNP, and assessed ROS production as the change in EGSH. Our findings on mitochondrial ROS production conform to current literature: blockers of the respiratory chain cause a decrease inEGSH, albeit with different potencies, while the uncoupler did not measurably alter ROS production (Votyakova
Fig. 5.Effects of mitochondrial poisons on ATP levels in the CB. Upper panel shows that Rot (1M), AA (0.2g/ml) and SA (5 mM) caused very significant decreases in the ATP levels of the CB. On the contrary, 3-NP (5 mM) and DNP (100M) did not alter ATP content. Lower panel shows that treatment with NAC did not modify the effects of mitochondrial poisons on ATP levels (data are mean±SEM of 6–8 individual values; ***p< 0.001).
and Reynolds, 2001; Sipos et al., 2003). Additionally, and also in accord with literature (Kim et al., 2004; Zhang et al., 2004; Wang et al., 2006; Hu et al., 2007) the oxidative status produced by mito-chondrial inhibition is prevented by incubation of tissues with NAC. Selected concentrations of mitochondrial poisons, effective to decreaseEGSH, also activated CB chemoreceptor cells eliciting the release of neurotransmitters. Finally, the same doses of mitochon-drial poisons caused a decrease of ATP levels in the CB. The last two responses, neurotransmitter release and ATP decrease, were not affected by NAC treatment indicating that their genesis is inde-pendent of the general redox status of chemoreceptor cells.
We selected rat diaphragm to assess the effects of mitochondrial poisons on ROS production because we previously founded that contained similar GSH/GSSG content and redox capacity than calf CB (Sanz-Alfayate et al., 2001; Gonzalez et al., 2004a) and the thick-ness of the tissue, comparable to that of the CB (< 1 mm), assured similar drugs and gas diffusion than rat CB.
lower concentrations. If this were the case a parallelism (and poten-tial causal relationship) between decrease inEGSH (or increased ROS) and the activity of the cells might exist. However, NAC was able to reverse the oxidative status produced by the highest con-centration of rotenone in diaphragm, rendering most plausible that if lower rotenone concentrations have produced any oxidative sta-tus in chemoreceptor cells it also would be normalized by NAC. As mentioned above, NAC is very effective in this regard due to its double effect as H2O2scavenger and GSH precursor (Villagrasa et al., 1997), and in fact the increase inEGSHproduced in diaphragm and calf CB was nearly identical (Sanz-Alfayate et al., 2001). In sum, rotenone activates chemoreceptor cells by a mechanism unrelated to mitochondrial ROS production and theEGSHof the cells.
The intimate mechanism mediating the mitochondrial produc-tion of superoxide by 3-NP is controversial (Bacsi et al., 2006). Yet, it is well established that 3-NP is an irreversible inhibitor of succinate dehydrogenase capable of producing marked amounts of superox-ide and oxidative damage when applied to isolated cell systems or injected in intact animals (Bacsi et al., 2006; Herrera-Mundo et al., 2006). There are many studies indicating that the neurotoxic manifestations of 3-NP injections are prevented or ameliorated by concomitant antioxidant treatment (Nam et al., 2005) and attenu-ated in transgenic mice overexpressing superoxide dismutase (Beal et al., 1995). It is worth noting that the observed acute neuro-toxic manifestations of 3-NP injection in rats which represent early markers of oxidative stress, were fully prevented by prior admin-istration of the antioxidant S-allylcysteine (Herrera-Mundo et al., 2006), conforming present findings in intact tissue in vitro where the decrease of theEGSHwas reversed by treatment with NAC. How-ever, although 3-NP was more effective that rotenone altering the EGSHit was almost incapable of activating chemoreceptor cells, and this limited effectiveness in promoting neurosecretion in chemore-ceptor cells was not modified by NAC treatment. Our findings with 3-NP fail to show a link between mitochondrial ROS production and chemoreceptor cell activation.
Antimycin A and sodium azide, inhibitors of complex III and IV, respectively, produced as expected a marked decrease inEGSH (Votyakova and Reynolds, 2001; Turrens, 2003; He et al., 2005), and both of them were powerful stimulants of neurosecretion in chemoreceptor cells. Then, a parallelism between ROS production and chemoreceptor cell activity was apparent for these two block-ers of the respiratory chain. However, treatment of the tissues with NAC fully reversed theEGSHto normality, but normalization of the redox status did not modify their neurosecretory power. These last observations coupled to the well known ability of NAC to buffer the increased production of ROS induced by complex III and IV inhibitors in many cell systems (Watabe and Nakaki, 2007; Stöckl et al., 2006; Suzuki et al., 1998; Satpute et al., 2008; Zhang et al., 2007), would indicate that there is not any relationship between ROS levels and chemoreceptor cell activity.
As expected DNP did not modify theEGSHbecause it is known that uncouplersper sedo not increase the rate of ROS production (Votyakova and Reynolds, 2001). Then it would appear that DNP does not activate chemoreceptor cells via modification of the redox status of the cells.
On discussing present findings on the redox changes produced by metabolic poisons, we want to link them to previously pub-lished data using lowPO2. InSanz-Alfayate et al. (2001)we tested 21% O2(normoxia)vs. 5% O2(moderately intense hypoxia) on calf CBs and found that theEGSH were, respectively,−186.9±1.1 and
−184.5±1.2. Additionally, we showed that NAC increased signif-icantly normoxicEGSH to−201.1±1.1.Sanz-Alfayate et al. (2001) also showed that hypoxia increased normoxic release by a factor of 3–5 and NAC neither modified normoxic nor hypoxic release response. Thus, as it is the case with metabolic poisons, these data
with different O2tensions and NAC indicate that the response of chemoreceptor cells to the natural stimuli is neither linked to the redox status of the cells.
A general consideration should be made, namely where or how do mitochondrial poisons act to generate an activation of chemore-ceptor cells. As discussed above we exclude ROS/general redox status of cells as a common denominator of poisons to activate chemoreceptor cells. Below we discuss a possible link between metabolic poisons effects on energy charge of the cells and their activation. Yet, we cannot exclude that mitochondrial poisons have neither ROS nor energy charge related effects that can afford or con-tribute to the observed activation of chemoreceptor cells that they produce. In this regard, it should be mentioned thatOrtega-Sáenz et al. (2003)have suggested that rotenone activates chemorecep-tor cells by a mechanism independent of mitochondrial respirachemorecep-tory chain and proposed that chemoreceptor cells express a rotenone-sensitive molecule that is critical for O2-sensing.
poisons activation of chemoreceptor cells could be mediated by AMP kinase-dependent inhibition of K+channels in chemoreceptor cells (Wyatt et al., 2007). In fact, these authors have observed in isolated type I cells that pharmacological activation of AMP kinase lead to plasma membrane depolarization and Ca2+influx, and in the intact CB-carotid sinus preparation increased chemosensory fiber discharge. They also showed that the AMP kinase antagonist compound C reversed the effects of hypoxia on chemoreceptor cell activation.
In sum, our study does not support the existence of a causal link between the levels of mitochondrial-derived ROS and activ-ity of chemoreceptor cells. It is possible to activate chemoreceptor cells with agents that do not modify mitochondrial ROS lev-els (low concentrations of rotenone and DNP) and with agents that do increase ROS production (highest rotenone concentration, antimycin A and sodium azide); finally, there are mitochondrial poisons (3-NP) that causing an increase in mitochondrial ROS do not activate chemoreceptor cells. The deviations of ROS levels pro-duced by mitochondrial agents were in all instances corrected by treatment with the antioxidant NAC, and yet the effectiveness of the mitochondrial agents to activate CB chemoreceptor cells remained unaltered. However, because signal transduction reac-tions are localized processes (Forman et al., 2004), our conclusions do not exclude that specific redox signalling reactions might be linked to oxygen sensing in chemoreceptor cells.
Acknowledgements
We want to thank Made los Llanos Bravo for technical assistance. The work was supported Grants: BFU2007-61848 (DGICYT), CIBER CB06/06/0050 (FISS-ICiii) and JCyL-GR242.
References
Acker, H., 1994. Cellular oxygen sensors. Ann. N. Y. Acad. Sci. 718, 3–10.
Archer, S.L., Reeve, H.L., Michelakis, E., Puttagunta, L., Waite, R., Nelson, D.P., Dinauer, M.C., Weir, E.K., 1999. O2sensing is preserved in mice lacking the gp91 phox subunit of NADPH oxidase. Proc. Natl. Acad. Sci. U.S.A. 96 (14), 7944–7949. Bacsi, A., Woodberry, M., Widger, W., Papaconstantinou, J., Mitra, S., Peterson, J.W.,
Boldogh, I., 2006. Localization of superoxide anion production to mitochondrial electron transport chain in 3-NPA-treated cells. Mitochondrion 6 (5), 235–244. Beal, M.F., Ferrante, R.J., Henshaw, R., Matthews, R.T., Chan, P.H., Kowall, N.W., Epstein, C.J., Schulz, J.B., 1995. 3-Nitropropionic acid neurotoxicity is attenuated in cop-per/zinc superoxide dismutase transgenic mice. J. Neurochem. 65 (2), 919–922. Chandel, N.S., Schumacker, P.T., 2000. Cellular oxygen sensing by mitochondria: old
questions, new insight. J. Appl. Physiol. 88 (5), 1880–1889.
Conde, S.V., Obeso, A., Gonzalez, C., 2007. Low glucose effects on rat carotid body chemoreceptor cells secretory responses and action potential frequency in the carotid sinus nerve. J. Physiol. 585 (Pt 3), 721–730.
Del Río, P., Montiel, T., Chagoya, V., Massieu, L., 2007. Exacerbation of excitotoxic neu-ronal death induced during mitochondrial inhibition in vivo: relation to energy imbalance or ATP depletion? Neuroscience 146 (4), 1561–1570.
Fidone, S., Gonzalez, C., 1982. Catecholamine synthesis in rabbit carotid body in vitro. J. Physiol. 333, 69–79.
Fidone, S., Gonzalez, C., Yoshizaki, K., 1982. Effects of low oxygen on the release of dopamine from the rabbit carotid body in vitro. J. Physiol. 333, 93–110. Forman, H.J., Fukuto, J.M., Torres, M., 2004. Redox signaling: thiol chemistry defines
which reactive oxygen and nitrogen species can act as second messengers. Am. J. Physiol. Cell Physiol. 287 (2), C246–C256.
Franceschini, D., Giusti, P., Skaper, S.D., 2006. MEK inhibition exacerbates ischemic calcium imbalance and neuronal cell death in rat cortical cultures. Eur. J. Phar-macol. 553 (1–3), 18–27.
García, O., Massieu, L., 2003. Glutamate uptake inhibitor L-trans-pyrrolidine 2,4-dicarboxylate becomes neurotoxic in the presence of subthreshold concentrations of mitochondrial toxin 3-nitropropionate: involvement of mito-chondrial reducing activity and ATP production. J. Neurosci. Res. 74 (6), 956–966. Gauda, E.B., 2002. Gene expression in peripheral arterial chemoreceptors. Microsc.
Res. Tech. 59 (3), 153–167.
Gonzalez, C., Almaraz, L., Obeso, A., Rigual, R., 1994. Carotid Body Chemoreceptors: From Natural Stimuli to Sensory Discharges. Physiol. Rev. 74, 829–898. Gonzalez, C., 1998. Sensitivity to physiological hypoxia. In: Weir, E.K., Lopez-Barneo,
J. (Eds.), Oxygen Regulation of Ion Channels and Gene Expression. Futura Pub-lishing Co Inc, Armonk NY, pp. 321–336.
Gonzalez, C., Sanz-Alfayate, G., Agapito, M.T., Gomez-Ni ˜no, A., Rocher, A., Obeso, A., 2002. Significance of ROS in oxygen sensing in cell systems with sensitivity to physiological hypoxia. Respir. Physiol. Neurobiol. 132 (1), 17–41.
Gonzalez, C., Sanz-Alyayate, G., Agapito, M.T., Obeso, A., 2004a. Effects of reducing agents on glutathione metabolism and the function of carotid body chemore-ceptor cells. Biol. Chem. 385 (3–4), 265–274.
Gonzalez, C., Sanz-Alfayate, G., Obeso, A., Agapito, M.T., 2004b. Role of glutathione redox state in oxygen sensing by carotid body chemoreceptor cells. Methods Enzymol. 381, 40–71.
Griffith, O.W., 1980. Determination of glutathione and glutathione disulfide using glutathione reductase and 2-vinylpiridine. Anal. Biochem. 106, 207–212. He, L., Dinger, B., Sanders, K., Hoidal, J., Obeso, A., Fidone, S., Gonzalez, C., 2005.
Effect of p47phox gene-deletion on reactive oxygen species (ROS) production and oxygen sensing in mouse carotid body chemoreceptor cells. Am. J. Physiol. Lung Cell Mol. Physiol. 289, L916–924.
Herrera-Mundo, M.N., Silva-Adaya, D., Maldonado, P.D., Galván-Arzate, S., Andrés-Martínez, L., Pérez-De La Cruz, V., Pedraza-Chaverrí, J., Santamaría, A., 2006. S-Allylcysteine prevents the rat from 3-nitropropionic acid-induced hyperactivity, early markers of oxidative stress and mitochondrial dysfunction. Neurosci. Res. 56 (1), 39–44.
Hu, S., Zhao, H., Yin, X.J., Ma, J.K., 2007. Role of mitochondria in silica-induced apoptosis of alveolar macrophages: inhibition of apoptosis by rhodamine 6G and N-acetyl-l-cysteine. J. Toxicol. Environ. Health 70 (17), 1403– 1415.
Kim, D.K., Natarajan, N., Prabhakar, N.R., Kumar, G.K., 2004. Facilitation of dopamine and acetylcholine release by intermittent hypoxia in PC12 cells: involvement of calcium and reactive oxygen species. J. Appl. Physiol. 96 (3), 1206–1215. López-Barneo, J., López-López, J.R., Ure ˜na, J., González, C., 1988. Chemotransduction
in the carotid body: K+current modulated byPO2in type I chemoreceptor cells. Science 241 (4865), 580–582.
Marshall, B.E., Marshall, C., Frasch, F., Hanson, C.W., 1994. Role of hypoxic pulmonary vasoconstriction in pulmonary gas exchange and blood flow distribution. Phys-iologic concepts. Intensive Care Med. 20 (4), 291–297.
Montoro, R.J., Ure ˜na, J., Fernández-Chacón, R., Alvarez de Toledo, G., López-Barneo, J., 1996. Oxygen sensing by ion channels and chemotransduction in single glomus cells. J. Gen. Physiol. 107 (1), 133–143.
Moudgil, R., Michelakis, E.D., Archer, S.L., 2005. Hypoxic pulmonary vasoconstriction. J. Appl. Physiol. 98 (1), 390–403.
Mulligan, E., Lahiri, S., 1982. Separation of carotid body chemoreceptor responses to O2and CO2by oligomycin and by antimycin A. Am. J. Physiol. 242 (3), C200– C206.
Nam, E., Lee, S.M., Koh, S.E., Joo, W.S., Maeng, S., Im, H.I., Kim, Y.S., 2005. Mela-tonin protects against neuronal damage induced by 3-nitropropionic acid in rat striatum. Brain Res. 1046 (1–2), 90–96.
Obeso, A., Almaraz, L., Gonzalez, C., 1986. Effects of 2-deoxy-d-glucose on in vitro cat carotid body. Brain Res. 371 (25), 36.
Obeso, A., Almaraz, L., Gonzalez, C., 1989. Effects of cyanide and uncouplers on chemoreceptor activity and ATP content of the cat carotid body. Brain Res. 481 (250), 257.
Obeso, A., Gomez-Ni ˜no, A., Gonzalez, C., 1999. Inhibition of NADPH oxidase does not interfere with lowPO2transduction in chemoreceptor cells. Am. J. Physiol. 276, C593–C601.
Ortega-Sáenz, P., Pardal, R., García-Fernandez, M., López-Barneo, J., 2003. Rotenone selectively occludes sensitivity to hypoxia in rat carotid body glomus cells. J. Physiol. 548 (Pt 3), 789–800.
Pandey, M., Varghese, M., Sindhu, K.M., Sreetama, S., Navneet, A.K., Mohanaku-mar, K.P., Usha, R., 2007. Mitochondrial NAD(+)-linked State 3 respiration and complex-I activity are compromised in the cerebral cortex of 3-nitropropionic acid-induced rat model of Huntington’s disease. J. Neurochem. 104 (2), 420–434.
Peng, Y.J., Overholt, J.L., Kline, D., Kumar, G.K., Prabhakar, N.R., 2003. Induc-tion of sensory long-term facilitaInduc-tion in the carotid body by intermittent hypoxia: implications for recurrent apneas. Proc. Natl. Acad. Sci. U.S.A. 100 (17), 10073–10078.
Porwol, T., Ehleben, W., Brand, V., Acker, H., 2001. Tissue oxygen sensor function of NADPH oxidase isoforms, an unusual cytochromeaa3and reactive oxygen species. Respir. Physiol. 128 (3), 331–348.
Post, J.M., Hume, J.R., Archer, S.L., Weir, E.K., 1992. Direct role for potassium channel inhibition in hypoxic pulmonary vasoconstriction. Am. J. Physiol. 262 (4 Pt 1), C882–C890.
Richalet, J.P., 1997. Oxygen sensors in the organism: examples of regulation under altitude hypoxia in mammals. Comp. Biochem. Physiol. A Physiol. 118 (1), 9– 14.
Sanz-Alfayate, G., Obeso, A., Agapito, M.T., González, C., 2001. Reduced to oxidized glutathione ratios and oxygen sensing in calf and rabbit carotid body chemore-ceptor cells. J. Physiol. 537 (Pt 1), 209–220.
Satpute, R.M., Hariharakrishnan, J., Bhattacharya, R., 2008. Alpha-ketoglutarate and N-acetyl cysteine protect PC12 cells from cyanide-induced cytotoxicity and altered energy metabolism. Neurotoxicology 29 (1), 170–178.
Schafer, F.Q., Buettner, G.R., 2001. Redox environment of the cell as viewed through the redox state of the glutathione disulfide/glutathione couple. Free Radic. Biol. Med. 30 (11), 1191–1212.
Stöckl, P., Hütter, E., Zwerschke, W., Jansen-Dürr, P., 2006. Sustained inhibition of oxidative phosphorylation impairs cell proliferation and induces premature senescence in human fibroblasts. Exp. Gerontol. 41 (7), 674–682.
Suzuki, H., Kumagai, T., Goto, A., Sugiura, T., 1998. Increase in intracellular hydrogen peroxide and upregulation of a nuclear respiratory gene evoked by impairment of mitochondrial electron transfer in human cells. Biochem. Biophys. Res. Com-mun. 249 (2), 542–545.
Turrens, J.F., 2003. Mitochondrial formation of reactive oxygen species. J. Physiol. 552 (Pt 2), 335–344.
Varas, R., Wyatt, C.N., Buckler, K.J., 2007. Modulation of TASK-like background potas-sium channels in rat arterial chemoreceptor cells by intracellular ATP and other nucleotides. J. Physiol. 583 (2), 521–536.
Vicario, I., Rigual, R., Obeso, A., Gonzalez, C., 2000. Characterization of the synthesis and release of catecholamine in the rat carotid body in vitro. Am. J. Physiol. 278, C490–C499.
Villagrasa, V., Cortijo, J., Martí-Cabrera, M., Ortiz, J.L., Berto, L., Esteras, A., Bruseghini, L., Morcillo, E.J., 1997. Inhibitory effects of N-acetylcysteine on superoxide anion generation in human polymorphonuclear leukocytes. J. Pharm. Pharmacol. 49 (5), 525–529.
Votyakova, T.V., Reynolds, I.J., 2001. Delta Psi (m)-dependent and -independent pro-duction of reactive oxygen species by rat brain mitochondria. J. Neurochem. 79 (2), 266–277.
Wang, H., Yuan, G., Prabhakar, N.R., Boswell, M., Katz, D.M., 2006. Secretion of brain-derived neurotrophic factor from PC12 cells in response to oxidative stress requires autocrine dopamine signaling. J. Neurochem. 96 (3), 694–705.
Watabe, M., Nakaki, T., 2007. ATP depletion does not account for apoptosis induced by inhibition of mitochondrial electron transport chain in human dopaminergic cells. Neuropharmacology 52 (2), 536–541.
Waypa, G.B., Chandel, N.S., Schumacker, P.T., 2001. Model for hypoxic pulmonary vasoconstriction involving mitochondrial oxygen sensing. Circ. Res. 88 (12), 1259–1266.
Waypa, G.B., Schumacker, P.T., 2005. Hypoxic pulmonary vasoconstriction: redox events in oxygen sensing. J. Appl. Physiol. 98 (1), 404–414.
Waypa, G.B., Schumacker, P.T., 2006. Role for mitochondrial reactive oxygen species in hypoxic pulmonary vasoconstriction. Novartis Found. Symp. 272, 176–192, discussion 192-5, 214–7.
Wyatt, C.N., Buckler, K.J., 2004. The effect of mitochondrial inhibitors on membrane currents in isolated neonatal rat carotid body type I cells. J. Physiol. 556 (Pt 1), 175–191.
Wyatt, C.N., Mustard, K.J., Pearson, S.A., Dallas, M.L., Atkinson, L., Kumar, P., Peers, C., Hardie, D.G., Evans, A.M., 2007. AMP-activated protein kinase mediates carotid body excitation by hypoxia. J. Biol. Chem. 282, 8092–8098.
Zhang, L., Li, L., Liu, H., Prabhakaran, K., Zhang, X., Borowitz, J.L., Isom, G.E., 2007. HIF-1alpha activation by a redox-sensitive pathway mediates cyanide-induced BNIP3 upregulation and mitochondrial-dependent cell death. Free Radic. Biol. Med. 43 (1), 117–127.