Fugitive green-house gas emissions during biological wastewater treatment: investigating sources and mitigation strategies in laboratory and full-scale systems
150
0
0
Texto completo
(2) Doctoral Thesis. Fugitive green-house gas emissions during biological wastewater treatment: Investigating sources and mitigation strategies in laboratory and full-scale systems. Adrián Rodriguez Caballero 2015. Supervisor: Dr. Maite Pijuan Vilalta Tutor: Dr. Ignasi Rodriguez-Roda Layret. Thesis submitted in fulfilment of the requirements for the degree of Doctor from the University of Girona (PhD Programme: Water Science and Technology).
(3)
(4) MAITE PIJUAN VILALTA, investigadora de l’Institut Català de Recerca de l’Aigua (ICRA) i IGNASI RODRÍGUEZ-RODA LAYRET, professor del Departament d’Enginyeria Química, Agrària i Tecnologia Agroalimentària de la Universitat de Girona i investigador de l’ICRA. Certifiquen Que el llicenciat en Ciències Ambientals Adrián Rodriguez Caballero ha realitzat, sota la direcció de Maite Pijuan Vilalta, el treball que amb el títol “Fugitive green-house gas emissions during biological wastewater treatment: Investigating sources and mitigation strategies in laboratory and full-scale systems”, es presenta en aquesta memòria la qual constitueix la seva Tesi per optar al Grau de Doctor per la Universitat de Girona.. I perquè en prengueu coneixement i tingui els efectes que corresponguin, presentem davant la Facultat de Ciències de la Universitat de Girona l’esmentada Tesi, signant aquesta certificació a. Girona, 30 de octubre de 2014. Supervisora: Dra. Maite Pijuan Vilalta. Tutor: Dr. Ignasi Rodríguez-Roda Layret.
(5)
(6) A mis padres, por todo el apoyo, el cariño, y porque las cosas importantes de la vida no las aprendí en los libros..
(7)
(8)
(9)
(10) Agradecimientos.
(11)
(12) Agradecimientos. Muchos años después de defender la tesis doctoral, habría de recordar que el día en que llegué a Girona, el Mundo era tan reciente que muchas cosas carecían de nombre, y para nombrarlas había que señalarlas con el dedo. Y poco a poco, Maite Pijuan hacía realidad las ideas como cuando los artistas comienzan a darle golpes de pincel a un cuadro enorme. Y aquel garaje diáfano con olor a plástico nuevo se transformó en el laboratorio L06. Y lo llenamos de ilusión y de experimentos. Y así pudimos comenzar a ponerle nombre a las cosas. Decía Walter Bonatti que hay muchas montañas en la vida de los hombres, y desde luego aquella montaña que fue escribir una tesis doctoral, la pude escalar gracias a la ayuda inmensa y al esfuerzo de Maite. Después vimos llegar a mucha gente con más ilusión y más energía, como Anna, Olga, Eliza, Celia... Gente excepcional que convirtió el ICRA en un buen centro de investigación con mucho futuro. Y así, casi sin darnos cuenta, el Mundo ya no era tan reciente y mi tesis fue tomando forma. Habría de recordar éstas y otras muchas cosas más en aquel refugio inhóspito, en medio de las montañas más altas, mientras Martha me escuchaba. Recordaría que toda aquella historia de la tesis doctoral empezó a escribirse mucho tiempo antes de llegar a Girona, junto al profesor Carl Påhlson, que me abrió las puertas de su laboratorio de microbiología de par en par, para enseñarme que ciencia y arte no eran tan diferentes como pudiera parecer. Todo empezó a la orilla del lago Mälaren, junto a buenos colegas y amigos de la pequeña universidad de Mälardalen (Elena, Iana, Johan, Erik, Emma, Monica...). En aquella época, el frío de los inviernos era muy intenso, y sólo podía combatirse con el calor de la gran familia Kazimierczak-Leis y todos aquellos amigos de Västerås y de Stockholm, que siempre supieron darme los abrazos más sinceros. Muchos años después de defender la tesis, volvería a recordar la mañana de febrero en que me subí a un avión en Suecia y aparecí en Girona. Me recibieron el calor de mi vieja amiga Carol y la enorme sonrisa de Neus, que llenaba todo el despacho. No pude tener una mejor bienvenida que la que me dieron Quim, Meri y Anna en aquella casa enorme rodeada de bosque. Y en el ICRA estaban Serni, Pau, Gigi, Uri, Gemma, Mariona, Vicenç y muchos otros compañeros que hicieron que desde el primer día me sintiera como en casa. Y un día entró por la puerta un ingeniero loco, Ignasi, que quiso ser un gran amigo, y con el que compartí muchas horas de trabajo y, lo más importante, muchísimas risas. Llegué a Girona con ganas de volver. De poder vivir con Martha los inviernos al sol y el lado mediterráneo de la vida. Mucho tiempo después de la mañana en que defendí la tesis, volví a recordar que en Girona y Catalunya tuve siempre la sensación de estar en mi tierra, porque yo nunca entendí las patrias y siempre tuve sitio para muchas banderas. I em sentía molt català, igual que antes fui castellano en Salamanca, sueco en Estocolmo y africano en Ciudad del Cabo. Y eso siempre sin dejar de ser cántabro en todas partes, porque había encontrado la fórmula mágica para quitarme de encima todas las etiquetas. Volví a recordar que la vida era una aventura constante desde las calas más recónditas de la Costa Brava hasta los picos más altos del Pirineo. No podría olvidar los días de escalada con tantos amigos en las paredes de caliza de Sadernes o en el bosque mágico de Savassona; el hielo en la cara norte del Gra de Fajol, con la tramuntana vigilándonos la espalda y congelándome las manos; las esquiadas desde el Bacivers, el Bastiments y tantos otros gigantes cubiertos de nieve recién traída por una intensa llevantada; tantas y tantas horas corriendo por los bosques de Les Gavarres, preparándonos para otras batallas en las montañas más altas. Recordaría todos esos paisajes compartidos con amigos como Maria, Pep y Anna, Ivan y Brigida, Rovira, Edu, Adri y otros “micos”, Joel, Canimas, Riuró, Met y muchos otros corredores de montaña. Años después de la defensa de la tesis, volvería a revivir algunos momentos muy antiguos, luchando en la guerra perdida de los recuerdos resbaladizos que se nos escapan, para poder contarle a Martha que nunca había visto a nadie agarrarse a la vida con tanta fuerza como lo hacía mi padre la mañana de septiembre en que ascendimos, muy despacito, el Col de Grand Ferret, junto a Juanjo y el resto de los bomberos. Y de cómo aquello fue la lección más importante que aprendí: Que el secreto de los héroes más valientes es nunca dar por perdida la sonrisa. Y también recordaría el amor inconmensurable de mi madre, que supo siempre demostrarme que estaría a mi lado iii.
(13) Agradecimientos. incondicionalmente, y eso fue muchas veces, el único flotador que encontré cuando arreciaban las peores tormentas; fue sin duda gracias al esfuerzo de mis padres, que pude recorrer el camino sinuoso que me llevó a defender una tesis doctoral. Jamás podría olvidar el olor a serrín y mar Cantábrico de mi abuelo “Totoño”, o aquella tarde en que la ciudad lloraba lágrimas de salitre al verle remar por última vez en una trainera llena de flores. O las tardes a la sombra de los árboles frutales en la Ávila natal de mi abuela Amparo, que también era mi madre, y de todo lo que aprendí con ella y con Marysol, Adri y aquella bisabuela que recordaba el África de su juventud, pero que decidió olvidarse de su vejez. Y la energía infinita de la abuela Maricarmen mirando las olas golpear el paseo de La Maruca y nuestros incontables miércoles de arroz blanco, o el sabor secreto a coco y nata fresca de la tarta que nos preparaba en cada cumpleaños. O los veranos en que segábamos la hierba a dalle cerca de la cabaña del “tío Teo”, aquel olor a verde empapado de lluvia y a pelo de caballo, recogiendo las ciento una endrinas que se necesitaban para hacer el mejor pacharán. Volvería a recordar que un mes antes de cumplir diez años, me llevaron a conocer a mi hermano Álex, el bicho de rizos negros que trajo las sonrisas a la familia y al que nunca supe agradecer lo suficiente haberme apartado de la soledad. Aparecerían en mi cabeza recuerdos que se mantienen muy nítidos, muy vivos, como las noches en que Maribel me ayudaba a transcribir una pequeña novela histórica que meses más tarde me llevaría a suspender matemáticas y a recorrer los lugares más insospechados de Latinoamérica y el Mundo, a correr con los Rarámuris en las montañas mexicanas, y a compartir caminos con buenos amigos y amigas de la Ruta Quetzal, los mejores compañeros de viaje. Y las tardes pescando en La Punta de La Mesa con el tato Carlos, viendo las olas romperse en mil pedazos contra las rocas, intentando que picaran las Lubinas, aunque al final siempre sacábamos Chaparrudos y Porredanos. Muchos años después, también me acordaría de las vueltas a casa desde tan lejos, desde Salamanca, Suecia o Sudáfrica. De volver a sentir, cada vez, el cariño de una gran familia, de todos mis tíos, tías, primos y primas que ya no podía contar con los dedos de las manos, pero sí con los latidos del corazón. Y recordaría los innumerables días pasados jugando en aquel patio rojo con mis amigos. Javi fue el primero y más importante que tuve, más de veinticinco años antes de defender la tesis, así que era normal que la palabra amigo trajera siempre su imagen a mi cabeza. Volvería a recordar todos aquellos días de sol y de nordeste compartidos en cualquier playa frente al Cantábrico con Irene. Y reviviría la ilusión de las primeras aventuras en los Picos, aquel primer Torreblanca, aquel primer Urriellu, siempre siguiendo los pasos de un maestro que más tarde sería también un amigo al otro lado de la cuerda: Jose me había enseñado que las montañas se escalan primero con el corazón, y después con las manos y con los pies. Me transmitió la pasión por las noches estrelladas por encima de los mares de nubes, y juntos aprendimos a disfrutar de los nervios a la sombra de las caras norte y del orbayu de las tardes de agosto. Y recordaría cómo un día descubrimos lo simple que es la felicidad de los hombres cuando una gélida madrugada los rayos del sol nos sorprendieron respirando el fino aire de una cima blanca y lejana. Muchos años después de defender la tesis, habría de recordar todas estas cosas junto a Martha, tirados en aquel rincón de un refugio. Exhaustos. Con la cara quemada por el sol y el viento, las piernas cansadas, las manos curtidas, con olor a roca y hielo. Felices. Y volvería a recordar que, muchos años antes, aquel viaje al país de las auroras boreales le dio un vuelco a mi corazón, porque tuve la suerte de encontrar a aquella chica de sonrisa eterna y valentía infinita con la que compartir las aventuras y la vida, y que quiso acompañarme mientras escribía las cien páginas de soledad de mi tesis doctoral.. iv.
(14) List of publications The research work presented in this thesis (chapters 4 to 7) has been redrafted from a group of scientific publications listed below: Rodriguez-Caballero, A., Pijuan, M. 2013. N2O and NO emissions from a partial nitrification sequencing batch reactor: Exploring dynamics, sources and minimization mechanisms. Water Research 47(9), 3131-3140. Author’s Contribution: All the experimental study and data analyses under the supervision of and with contributions from Dr. Pijuan. Writing the paper, with contributions from Dr Pijuan. Rodriguez-Caballero, A., Ribera, A., Balcázar, J.L., Pijuan, M. 2013. Nitritation versus full nitrification of ammonium-rich wastewater: Comparison in terms of nitrous and nitric oxides emissions. Bioresource Technology 139, 195-202. Author’s Contribution: All the experimental study and data analyses with contributions from the other authors. Dr.Balcázar performed the phylogenetic analysis of sequence data. Writing the paper, with contributions from Dr. Pijuan. Rodriguez-Caballero, A., Aymerich, I., Poch, M., Pijuan, M. 2014. Evaluation of process conditions triggering emissions of green-house gases from a biological wastewater treatment system. Science of the Total Environment 493, 384-391. Author’s Contribution: The monitoring campaign and data analyses with contributions from the other authors. Writing the paper, with contributions from the other authors.. Rodriguez-Caballero, A., Aymerich, I., Marques, R., Poch, M., Pijuan, M. 2015. Minimizing N2O emissions and carbon footprint on a full-scale activated sludge sequencing batch reactor. Water Research 71, 1-10. Author’s Contribution: The monitoring campaign and data analyses with contributions from the other authors. Writing the paper, with contributions from the other authors.. Additional relevant publications not included in this thesis: Pijuan, M., Tora, J., Rodriguez-Caballero, A., Cesar, E., Carrera, J., Perez, J. 2014. Effect of process parameters and operational mode on nitrous oxide emissions from a nitritation reactor treating reject wastewater. Water Research 49, 23-33. Castro, C., Rodriguez-Caballero, A., Volcke, E., Pijuan, M. 2014. Effect of nitrite on the N2O and NO production on the nitrification of low strength ammonium wastewater. Submitted to Bioresource Technology. v.
(15)
(16) List of acronyms AOB. ammonia oxidizing bacteria. BOD. biological oxygen demand. C. carbon. CH4. methane. CO2. carbon dioxide. COD. chemical oxygen demand. DO. dissolved oxygen. FISH. fluorescence in situ hybridization. GHG. green-house gas. GWP. global warming potential. HRT. hydraulic retention time. MLSS. mixed liquor suspended solids. MLVSS. mixed liquor volatile suspended solids. N. nitrogen. N2O. nitrous oxide. NH2OH. hydroxylamine. NH3. ammonia. NH4+. ammonium. NO. nitric oxide. NO2-. nitrite. NO3-. nitrate. NOB. nitrite oxidizing bacteria. PLC. programmable logic controller. SBR. sequencing batch reactor. SRT. sludge retention time. TKN. total Kjeldahl nitrogen. TN. total nitrogen. TP. total phosphorous. WWTP. wastewater treatment plant vii.
(17)
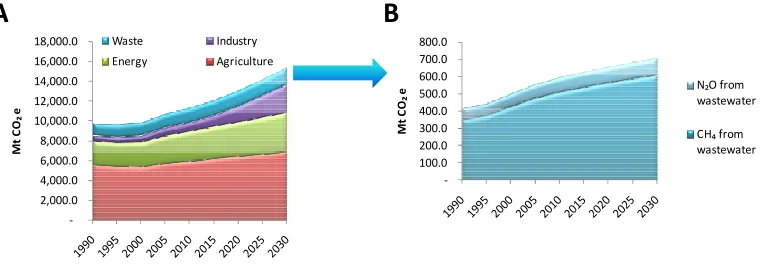
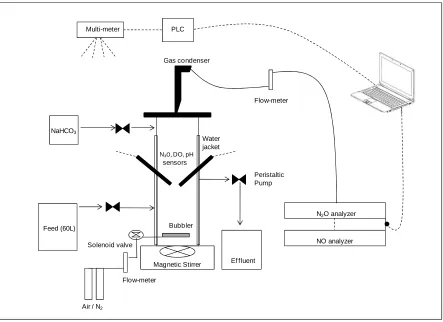
(18) Index of figures Figure 1.1 Contribution of anthropogenic GHGs to global radiative forcing (W/m2) (Data source: USEPA (2012)) 17 Figure 1.2 Global direct green-house gas emissions by source, in 2010 (data source: IPCC (2014)). 18 Figure 1.3 (A) Total global non-CO2 emissions by sector and (B) CH4 and N2O emissions from wastewater (within the waste sector) from 1990 to 2005, and from 2005 to 2030 as estimated by calculations based on real country data, emission factors (IPCC, 2006) and projections. Emissions are expressed in CO2 equivalents (CO2 e), which is a unit that describes the GWP of any GHG, utilizing the functional equivalence of the GWP of CO2. (Data source: USEPA, 2012). 18 Figure 1.4 Graphical representation of N2O production and consumption pathways during biological nitrogen removal, and the microbial communities and enzymes involved (modified from Desloover et al., 2012) 20 Figure 1.5 Potential sources of fugitive GHG emissions in a conventional WWTP.. 23. Figure 1.6 Graphical representation of CH4 production, including compounds and groups of microorganisms involved. 24 Figure 2.1 Graphical representation of the main contents of this thesis and the “keyword” interrelationships between chapters 4 and 5 (lab-scale studies) and 6 and 7 (full-scale studies). 29 Figure 3.1 Scheme of the experimental set-up designed for the studies presented in chapters 4 and 5. 33 Figure 4.1 Cycle configurations used in this study. 42 Figure 4.2 Experimental profiles of NH4+-N (●), NO2--N (○), pH (black line) and DO (grey line) in A1, B1, C1 and D1. N2O (black line), NO (grey line) emission profiles in A2, B2, C2 and D2 measured in the SBR under the four different cycle configurations tested in this study. 44 Figure 4.3 (A) Total NO emissions (black bars), NO emissions during the first 5 min of each cycle (light grey bars) and NO emissions during anoxic conditions (dark grey bars) during each cycle. (B) Total N2O emissions (black bars), N2O emissions during the first 5 min of each cycle (light grey bars) and N2O emissions during anoxic conditions (dark grey bars) during each cycle. Error bars correspond to the standard error of the means. 45 Figure 4.4 Accumulated NxO-N emission factors (N2O-N in grey and NO-N with black pattern) measured in each cycle configuration. Error bars correspond to the standard error of the means. 46 Figure 4.5 Experimental profile of liquid-phase N2O (black line) measured in the SBR under the four different cycle configurations (A, B, C and D) tested in this study. 47 Figure 4.6 Total N2O emissions during 5 min after settling, under the conditions of the different tests. Error bars correspond to the standard error of the means. 48 Figure 5.1 Relative abundances of each bacterial family (most dominant accounted only) found in SBR1 (black bars), SBR2 (light-grey bars) and SBR1 after biomass mixing (SBR1 MIX, dark-grey bars). ix.
(19) Index of figures. Relative abundance is defined as the number of sequences related to a particular taxon divided by the total number of sequences per sample (%). 56 Figure 5.2 Experimental profiles of NH4+-N (●), NO2--N (○), NO3--N(▲), pH (black line) and DO (grey line) (A1, B1, C1 and D1) and N2O (black line) and NO (grey line) emission profiles (A2, B2, C2 and D2) measured during nitritation in SBR1 (A1 and A2), nitratation in SBR2 (B1 and B2), transition to full nitrification in SBR1 MIX (C1 and C2) and full nitrification in SBR1 MIX (D1 and D2). 57 Figure 5.3 Total N2O (A) and NO (B) emissions during the first 120 min (black bars), the first 20 min (light grey bars) of each cycle and emissions during the rest of the cycle (dark grey bars) during nitritation (SBR1), transition and full nitrification (SBR1 MIX). Error bars correspond to the standard error of the means of triplicate tests. 59 Figure 5.4 N2O (A) and NO (B) emissions during the first 120 min of each cycle (black bars), first 20 min (light grey bars) and the rest of the cycle (dark grey bars) when different ammonium loadings were applied to SBR1 MIX (full nitrification period). Error bars correspond to the standard error of the means of triplicate tests. 61 Figure 6.1 Scheme of Granollers WWTP, including points at which monitoring of gas emissions was performed, and locations where grab samples were taken and where online sensors connected to the supervisory control and data acquisition system (SCADA) of the plant were placed. 65 Figure 6.2 Dynamics of (A) CH4 emissions (grey line) and influent wastewater flow going into the bioreactor (black line), and (B) aeration flow (grey line) and DO (black line) during a 54h-period measured in sampling site 3. 69 Figure 6.3 Dynamics of (A) N2O (grey line), NH4+ (∆), NO2- (•) and NO3- (■) and (B) aeration flow (grey line) and DO (black line) during a period of different DO levels and aeration drops (marked with arrows) measured in sampling site 3. 70 Figure 6.4 Dynamics of (A) N2O (grey line), NH4+ (∆), NO2- (•) and NO3-(■) and (B) aeration flow (grey line) and DO (black line) during a period of nitrification instability measured in sampling site 3. 71 Figure 6.5 Spatial distribution of average dissolved CH4 (Black bars) and N2O (grey bars) in different sites along the WWTP of Granollers. Error bars correspond to the standard error of the mean values 72 from triplicate samples and 6-12h monitoring for CH4 and N2O respectively. Figure 7.1 Scheme of the WWTP of La Roca del Vallès, including monitoring and sampling points. 79 Figure 7.2 Schemes of the different cycle configurations used in La Roca del Vallès WWTP.. 80. Figure 7.4 Average N2O emitted per N load (grey bars) or N consumed (black bars) during the monitoring campaign, under each cycle configuration at the SBR. Error bars correspond to the standard error of the means. 85 Figure 7.7 Total average NH4+-N load (black bars) and average NH4+-N consumed (grey bars) under each cycle configuration during the monitoring campaign. Error bars correspond to the standard error of the means. 88 Figure S.I.1 Representative profiles of N2O emission rate (grey line), NH4+-N (○), NO2--N (▲) and NO3-N (■) (A) and DO (black line) (B), measured in the SBR at La Roca del Vallès WWTP during the occurrence of a cycle configuration type A. The arrows mark the moment at which the cycle starts. 92 x.
(20) Index of figures. Figure S.I.2 Representative profiles of N2O emission (grey line) and aeration flow rates (black line), measured in the SBR at La Roca del Vallès WWTP measured in the SBR at La Roca del Vallès WWTP under the three different cycle configurations identified during this study. 92. xi.
(21)
(22) Index of tables Table 4.1 Specific ammonium oxidized and N2O-NO emission factors calculated for each cycle type. 46 Table 5.1 Specific converted-*N and N2O-NO emission factors calculated for SBR1 and SBR1 MIX in each period. 58 Table 5.2 Influent and effluent characteristics during SBR1 and SBR1 MIX operation*.. 60. Table 6.1 Operational parameters, influent and effluent characteristics of the WWTP during the experimental campaign. 67 Table 6.2 CH4 and N2O gas emissions calculated for each sampling site of the bioreactor lane under study. Standard error values calculated when possible (at least three days monitoring). 68 Table 6.3 Process perturbations under study during the measuring campaign.. 69. Table 7.1 Operational parameters, influent and effluent characteristics of the WWTP during the experimental campaign. 82 Table S.I.1 Average CH4 emissions, CH4-related C-footprint, total C-footprint and CH4 share on the total C-footprint during the first week of the monitoring campaign at SBR-4 in La Roca del Vallès WWTP. 91. xiii.
(23)
(24) Table of contents Agradecimientos. i. List of publications. v. List of acronyms. vii. Index of figures. ix. Index of tables. xiii. Summary. 1. Resum. 5. Resumen. 9. SECTION I - LITERATURE REVIEW, AIMS AND RESEARCH APPROACH. 13. Chapter 1 - General introduction. 15. Chapter 2 - Objectives and structure of the thesis. 27. Chapter 3 - Methodology. 31. SECTION II - RESULTS Chapter 4 - N2O and NO emissions from a partial nitrification sequencing batch reactor: Exploring dynamics, sources and minimization mechanisms. 37. 39. Chapter 5 - Nitritation versus full nitrification of ammonium-rich wastewater: Comparison in terms of nitrous and nitric oxides emissions 51 Chapter 6 - Evaluation of process conditions triggering emissions of green-house gases from a biological wastewater treatment system 63 Chapter 7 - Minimizing N2O emissions and carbon footprint on a full-scale activated sludge sequencing batch reactor 77 SECTION III - FINAL REMARKS Chapter 8 - General discussion. 93 95. Chapter 9 - Conclusions. 101. Chapter 10 - Future perspective. 105. References. 111.
(25)
(26) This thesis was financially supported by the Spanish Government Ministerio de Economía y Competitividad (project CTM 2011-27163) and the European Comission FP7-PEOPLE-2011-CIG 303946 project..
(27)
(28) We have to realize that all of us – all the seven billions – are one family that live on the same planet. Gustaf Olsson.
(29)
(30) Summary.
(31)
(32) Summary. The exponential increase of the atmospheric concentration of green-house gases due to human activities is responsible for the acceleration of global warming and climate change. Recently, scientific studies have pointed at wastewater treatment systems as relevant sources of fugitive green-house gases (GHGs) such as nitrous oxide (N2O) and methane (CH4). Nitric oxide (NO) can also be emitted during wastewater treatment, and it is a potent ozone-depleting compound and a precursor of N2O. Due to the high global warming potential of N2O and CH4, emission of these gases (even at low levels) may be relevant and increase severely the overall carbon footprint of a wastewater treatment system. The exact factors triggering N2O and NO production in biological wastewater treatment systems are still under debate. However, it is known that N2O and NO can be produced during the biological oxidation of ammonia (NH3) to nitrite (NO2-) by ammonia-oxidizing bacteria (AOB) and during the reduction of nitrate (NO3-) or NO2- to nitrogen gas (N2) by denitrifying bacteria. Differently, CH4 is produced as a consequence of the degradation of organic matter under anaerobic conditions, and is given along several metabolic pathways in methanogenic archaea. Fugitive GHG emissions during wastewater treatment need to be understood and accurately accounted for in the global emissions budget, and mitigation strategies in wastewater treatment facilities should be designed and implemented. This thesis collects and presents a group of research studies performed with the general goal of identifying potential minimization strategies for N2O and CH4 emissions from different wastewater treatment systems. The work carried out during the elaboration of this thesis can be divided into two main sections, namely lab- and full-scale studies. On one hand, laboratory experiments were carried out on sequencing batch reactors (SBRs) with enriched nitrifying bacterial populations. These experiments allowed the identification of some of the most important factors triggering production of N2O and NO during partial and full nitrification of ammonium (NH4+)-rich wastewater, simulating processes that are commonly applied in the treatment of reject wastewater in real scenarios. On the other hand, two monitoring campaigns targeting N2O and CH4 were performed in municipal wastewater treatment plants (WWTPs). These campaigns allowed the identification of process conditions that lead to N2O and CH4 peak emission events. In the first lab-scale study, both the concentration of NH4+ and NO2- in the bulk liquor of the partial nitrification SBR were shown to be key parameters related with N2O and NO production and emissions. It was concluded that most of the N2O originated during settling was due to biological reactions, and was emitted during the first minutes of each cycle, upon aeration. The complete oxidation of NH4+ (or most likely hydroxylamine) as a result of sufficient aeration time was suggested as a potential minimization strategy for N2O emissions in partial nitrification systems. In the second set of experiments, partial and full nitrification of NH4+-rich wastewater were compared for N2O and NO emissions. Partial nitrification led to higher N2O and NO emissions than full nitrification, likely due to the combined effect of lower NO2- and NH4+ concentrations in the bioreactor. Therefore, the application of partial nitrification in real-scale facilities need to be evaluated, taken into account the increase of gas emissions and its implications in the carbon footprint of the system. The full-scale monitoring campaigns were carried out at the municipal WWTPs of Granollers and La Roca del Vallès, near Barcelona (Spain). The biological wastewater treatment at Granollers WWTP is performed in two parallel plug-flow activated sludge reactors. The activated sludge basins of this plant are coupled to a sludge treatment facility for biogas production and electricity generation. CH4 emissions mainly occurred due to air stripping in the first part of the bioreactor, and were mostly related with the influent and reject wastewater flows entering the bioreactor from the anaerobic sludge digester. On the other hand, N2O emissions were given along all the aerated parts of the bioreactor and were strongly dependant on the occurrence of process disturbances such as periods of no aeration or nitrification instability. 3.
(33) Summary. The biological wastewater treatment at La Roca del Vallès WWTP is performed in two SBRs. In contrast to Granollers WWTP, CH4 emissions at La Roca del Vallès WWTP were insignificant, due to the absence of an anaerobic sludge digestion facility releasing reject wastewater. However, N2O emissions were large, accounting for up to 60% of the total carbon footprint of the plant. At the SBR in La Roca del Vallès WWTP, cycles with long aerated phases showed the largest N2O emissions, with the consequent increase in carbon footprint. An operational strategy was proven to severely mitigate N2O emissions from La Roca del Vallès WWTP. It consisted of intermittent aeration (short oxic and anoxic phases of 20-30 min) being applied in the sequencing cycle configuration. This strategy led to the overall minimization of the carbon footprint of the WWTP, without compromising the process performance.. 4.
(34) Resum.
(35)
(36) Resum. L’acceleració en l’escalfament global i el canvi climàtic són conseqüència de l’increment exponencial de la concentració de gasos d’efecte hivernacle en l’atmosfera degut, en part, a l’activitat humana. Estudis científics publicats recentment apunten a alguns sistemes de tractament d’aigües residuals com a fonts rellevants de gasos d’efecte hivernacle com l’òxid nitrós (N2O) i el metà (CH4). A més, l’òxic nítric (NO), un potent destructor de la capa d’ozó a més de ser un precursor del N2O, també pot ser emès durant el tractament d’aigües residuals. Degut a l’alt potencial d’escalfament atmosfèric del N2O i el CH4, l’emissió d’aquests gasos (inclús a baixes concentracions) pot ser rellevant, incrementant de forma significativa la petjada ecològica dels sistemes de tractament d’aigües residuals. Els factors responsables de la producció del N2O i NO en sistemes de tractament biològic d’aigües residuals estan subjectes a debat. No obstant, es coneix que tant el N2O com el NO poden produir-se durant l’oxidació biològica de l’amoniac (NH3) a nitrit (NO2-), duta a terme pels bacteris oxidants de l’amoni, i durant la reducció del nitrat (NO3-) o NO2- a nitrogen gas (N2), duta a terme per bacteris desnitrificants. Per altra banda, el CH4 es produeix com a conseqüència de la degradació de la matèria orgànica en condicions anaeròbies per part de microorganismes metanògens. Les emissions de gasos d’efecte hivernacle durant el tractament de l’aigua residual han de ser avaluades en profunditat i haurien d’incloure’s en els càlculs globals d’emissions. A més, hi ha una necessitat creixent d’identificar i implementar estratègies de mitigació d’aquestes emissions en les estacions depuradores d’aigües residuals (EDARs). Aquesta tesi doctoral compren una sèrie d’estudis científics realitzats amb l’objectiu general d’identificar estratègies de minimització de les emissions de N2O i CH4 en diferents sistemes de tractament d’aigües residuals. El treball descrit en aquesta tesi està dividit en dues seccions: i) estudis a escala laboratori i ii) estudis a escala real. Per una banda, es van realitzar una sèrie d’experiments en diversos reactors discontinus seqüencials a escala laboratori, enriquits amb bacteris nitrificants. Mitjançant aquests experiments es van poder identificar alguns dels factors més importants implicats en la producció del N2O i el NO durant la nitrificació parcial d’aigua residual amb una altra concentració d’amoni, simulant un procés aplicat durant el tractament d’aigües de rebuig. Per altra banda, es van portar a terme dues campanyes de monitorització del N2O i el CH4 en dues EDARs urbanes. Aquestes monitoritzacions van facilitar la identificació de condicions d’operació que originen importants pics d’emissió d’aquests dos gasos. En el primer estudi de laboratori es va demostrar que tant la concentració d’amoni com la de nitrit en un reactor de nitrificació parcial són paràmetres estretament lligats a la producció de N2O i NO. Es va concloure que la major part del N2O detectat, es produïa durant l’etapa de sedimentació a través de reaccions biològiques i era emès durant els primers minuts d’aeració al principi de cada cicle. L’oxidació completa de l’amoni (o més probablement de la hidroxilamina (NH2OH)) com a resultat d’aplicar un temps d’aeració més llarg es pot proposar com una estratègia de minimització de les emissions de N2O en sistemes de nitrificació parcial. En un segon grup d’experiments es van comparar les emissions de N2O i NO durant la nitrificació parcial i completa d’una aigua residual amb un alt contingut d’amoni. En aquest segon estudi, l’aplicació de la nitrificació parcial va donar lloc a unes emissions majors de N2O i NO comparant amb les emissions detectades durant la nitrificació completa, possiblement degut a l’efecte combinat de les concentracions d’amoni i nitrit molt majors en la nitrificació parcial. Per tant, l’aplicació d’aquest procés en sistemes reals hauria de ser avaluada tenint en compte les emissions de N2O i NO associades i el seu impacte a la petjada de carboni de la planta. Les campanyes de monitorització de gasos d’efecte hivernacle a escala real es van portar a terme a les EDARs de Granollers i La Roca del Vallès. El tractament biològic de l’EDAR de Granollers es porta a terme en dos reactors tipus flux pistó. A part de l’aigua residual que arriba a l’EDAR aquests reactors també tracten el corrent d’aigües de rebuig que s’origina durant el centrifugat de fangs 7.
(37) Resum. provinents del digestor anaerobi present a la planta. Els pics d’emissió de CH4 detectats en aquesta EDAR eren conseqüència de la transferència a la fase gas del CH4 dissolt present en aquest corrent d’aigües de rebuig que es produïa quan aquesta aigua arribava a la primera zona airejada del reactor flux pistó. Per altra banda, les emissions de N2O es produïren al llarg de totes les zones aeròbies del reactor. Aquestes emissions estaven estretament relacionades amb episodis que provocaven desajustos en el procés, com per exemple fases sense aeració períodes d’inestabilitat en la nitrificació. En l’EDAR de la Roca del Vallès, el tractament biològic de l’aigua residual es realitzava en dos reactors discontinus seqüencials (SBRs). Al contrari que l’EDAR de Granollers, les emissions de CH4 en aquest cas varen ser insignificants, degut a l’absència d’aigües de rebuig provinents del digestor anaerobi. No obstant, les emissions de N2O van ser elevades contribuint en un 60% a la petjada de carboni de l’EDAR. Es va observar que els cicles del reactor amb fases d’aeració llargues resultaven amb emissions de N2O més altes. Per minimitzar aquestes emissions, es va aplicar una estratègia d’operació que consistia modificar els cicles del reactor aplicant seqüències d’aeració intermitent (fases aeròbies i anòxiques de 20-30 minuts). Aquesta modificació va resultar en una minimització important de les emissions de N2O, mantenint el correcte funcionament del reactor.. 8.
(38) Resumen.
(39)
(40) Resumen. La aceleración del calentamiento global y el cambio climático son consecuencia del incremento exponencial de la concentración de gases de efecto invernadero en la atmósfera, debido en parte a actividades humanas. Estudios científicos recientes apuntan a algunos sistemas de tratamiento de agua residual como fuentes relevantes de gases de efecto invernadero tales como el óxido nitroso (N2O) y el metano (CH4). El óxido nítrico (NO) también puede ser emitido durante el tratamiento de agua residual, y es un potente agente causante de la disminución de la capa de ozono, además de ser un compuesto precursor del N2O. Debido al alto potencial de calentamiento atmosférico del N2O y el CH4, la emisión de estos gases (incluso a niveles bajos) puede ser relevante e incrementar de forma importante la huella ecológica de un sistema de tratamiento de agua residual. Los factores causantes de la producción de N2O y NO en sistemas de tratamiento biológicos de agua residual están aún sujetos a debate. Sin embargo, se sabe que tanto el N2O como el NO pueden ser producidos durante la reacción de oxidación biológica del amoniaco (NH3) a nitrito (NO2-), que es realizada por las bacterias oxidantes del amoniaco (AOB, en sus siglas en inglés), y durante la reducción del nitrato (NO3-) ó NO2- a nitrógeno atmosférico (N2), llevada a cabo por bacterias desnitrificantes. De forma distinta, el CH4 se produce como consecuencia de la degradación de la materia orgánica en condiciones anaeróbicas, y se da a lo largo de distintas rutas metabólicas en organismos metanogénicos del dominio Archaea. Las emisiones de gases de efecto invernadero durante los tratamientos de agua residual deben ser evaluadas en profundidad e incluidas en los cálculos globales de emisiones. Además, se han de diseñar e implementar estrategias de mitigación de estas emisiones en las estaciones depuradoras de agua residual. Esta tesis doctoral reúne una serie de estudios científicos realizados con el objetivo general de identificar posibles estrategias de minimización de las emisiones de N2O y CH4 en distintos sistemas de tratamiento de agua residual. El trabajo descrito en esta tesis ha sido dividido en dos secciones: estudios a escala de laboratorio y estudios a escala real. Por un lado, una serie de experimentos fueron realizados en reactores discontinuos secuenciales (SBRs, en sus siglas en inglés) a escala laboratorio, con poblaciones enriquecidas de bacterias nitrificantes. A través de estos experimentos se pudieron identificar algunos de los factores más importantes implicados en la producción de N2O y NO durante la nitrificación parcial de agua residual con alto contenido amónico, simulando un proceso comúnmente aplicado en el tratamiento de aguas de rechazo en plantas reales. Por otro lado, dos campañas de monitorización de N2O y CH4 fueron llevadas a cabo en estaciones municipales de depuración de agua residual (EDAR). Estas monitorizaciones facilitaron la identificación de algunas condiciones que desencadenan importantes picos de emisión de N2O y CH4 durante los distintos procesos implicados en los tratamientos biológicos del agua residual. En el primer estudio de laboratorio se demostró que, tanto la concentración de ión amonio (NH4+) como la de NO2- en el licor de mezcla de un reactor, son parámetros de alta importancia relacionados con la producción y emisión de N2O y NO durante la nitrificación parcial de agua residual. Se concluyó que la mayoría del N2O se originaba durante la etapa de sedimentación a través de reacciones biológicas, y se emitía a lo largo de los primeros minutos de aireación en cada ciclo. La oxidación completa del NH4+ (o más probablemente de la hidroxilamina (NH2OH)) como resultado de la aplicación de un tiempo de aireación suficientemente extenso puede ser sugerida como una estrategia potencial de minimización de las emisiones de N2O en sistemas de nitrificación parcial. En un segundo grupo de experimentos se compararon las emisiones de N2O y NO provocadas durante la nitrificación parcial y completa de agua residual con alto contenido en NH4+. En este segundo estudio, la aplicación de nitrificación parcial desencadenó emisiones de N2O y NO más altas que la nitrificación completa, posiblemente debido al efecto combinado de unas concentraciones más bajas de NO2- y NH4+ en el reactor biológico. Por lo tanto, la aplicación de nitrificación parcial en sistemas reales debería ser debidamente evaluada, teniendo en cuenta el incremento de la emisión de gases de efecto invernadero y su impacto en la huella ecológica de los propios sistemas.. 11.
(41) Resumen. Las campañas de monitorización de emisiones de gases de efecto invernadero se llevaron a cabo en las EDARs de Granollers y La Roca del Vallès, cerca de Barcelona (España). El tratamiento biológico de agua residual en la EDAR de Granollers se lleva a cabo en dos reactores paralelos de lodos activados, con estructura de flujo-pistón. Los reactores de lodos activados en esta planta están conectados con un digestor anaerobio donde los lodos son tratados para su aprovechamiento como fuente de biogás de cara a la generación de electricidad. Las emisiones de CH4 se desencadenaron generalmente como consecuencia del arrastre provocado por la aireación en la primera sección del reactor, y fueron relacionadas con los flujos de agua de rechazo que se liberaban en el propio reactor, procedentes del digestor anaerobio. Por otro lado, las emisiones de N2O se produjeron a lo largo de todas las zonas del reactor biológico sujetas a aireación. Estas emisiones estaban fuertemente relacionadas con eventos que provocaban desajustes en el proceso, como fases sin aireación o periodos de inestabilidad de la nitrificación. En la EDAR de La Roca del Vallès, el tratamiento biológico del agua residual se realiza en dos reactores discontinuos secuenciales. Al contrario que en la EDAR de Granollers, las emisiones de CH4 en este caso fueron insignificantes, debido a la ausencia de aguas de rechazo procedentes de un digestor anaerobio. Sin embargo, las emisiones de N2O fueron elevadas, y se calculó que contribuían en un 60% a la huella ecológica de la planta. En el reactor biológico de La Roca del Vallès, los ciclos con fases de aireación largas se correspondían con los periodos de mayor emisión de N2O, con un consecuente incremento de la huella de carbono. Durante la monitorización de la EDAR de La Roca del Vallès, una estrategia que minimizaba de forma evidente las emisiones de N2O pudo ser comprobada. Esta estrategia consistió en aplicar secuencias de aireación intermitente (fases óxicas y anóxicas de 20-30 min) durante los ciclos, dando lugar a una minimización general de las emisiones de la EDAR, sin alterar el correcto funcionamiento del tratamiento biológico.. 12.
(42) SECTION I LITERATURE REVIEW, AIMS AND RESEARCH APPROACH.
(43)
(44) Chapter 1 General introduction.
(45)
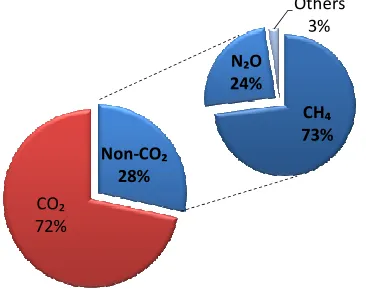
(46) Chapter 1 - General introduction. 1.1 Importance of non-CO2 fugitive green-house gas emissions during wastewater treatment Increased green-house gas (GHG) emissions from anthropogenic sources are modifying earth’s climate by accelerating global warming, with a variety of consequences such as ice melting in the poles and glaciers, raising sea level, extreme regional weather conditions and a wide range of healthrelated problems affecting the human population among others. Carbon dioxide (CO2) (mostly emitted as a consequence of fossil fuels utilization) is the main contributor to climate change. However, emissions of other GHGs such as methane (CH4), nitrous oxide (N2O) and ozone depleting substances (i.e. hydrofluorocarbons (HFCs), clorofluorocarbons (CFCs) or nitric oxide (NO)) are also known to severely affect earth’s climate. Figure 1.1 shows the contribution of the most important GHGs to the global radiative forcing, which is a measure of the influence of these gases on the energy balance in the earth-atmosphere system. Others 3% N₂O 24% CH₄ 73% Non-CO₂ 28% CO₂ 72%. Figure 1.1 Contribution of anthropogenic GHGs to global radiative forcing (W/m2) (Data source: USEPA (2012)) According to USEPA (2012), anthropogenic CH4 and N2O emissions account for ~28% of the global radiative forcing, while CO2 contributes in over 71%. The atmospheric concentration of CH4 and N2O has increased to levels unprecedented in the past. From the pre-industrial era, global concentrations of CH4 and N2O have increased by 150 and 20%, respectively. In addition, CH4 and N2O have a global warming potential (GWP) which is 28 and 265 times larger than the one attributed to CO2 on a 100year scope (IPCC, 2013), putting into perspective the relevance of these gases. This means, for example, that the warming effect of 1 ton of N2O equals the one exerted by 265 tons of CO2. Therefore, emission mitigation strategies targeting non-CO2 GHGs could be more effective in counteracting climate change than the ones targeting CO2 emissions (Montzka et al., 2011). It is therefore essential to unravel the sources of non-CO2 GHGs and to implement emission mitigation measures. According to data collected by the IPCC (2014), waste and wastewater contributes to almost 3% of direct GHG emissions, as shown in figure 1.2, with the energy supply, agriculture and forestry, and the industry sectors leading the global emissions ranking.. 17.
(47) Chapter 1 – General introduction. 2.9%. Waste and wastewater Electricity and heat production. 10%. Transport. 25% 24%. Residential and commertial buildings Industry. 14% 18.1%. Agriculture, Forestry and other Land use Other energy. 6.4%. Figure 1.2 Global direct green-house gas emissions by source, in 2010 (data source: IPCC (2014)). The waste sector is therefore a relevant source of GHGs in general and the third largest contributor of non-CO2 GHG emissions after the energy and the agriculture sectors, according to data provided by the USEPA (2012) (Fig. 1.3).. A. B 18,000.0. Waste. Industry. 16,000.0. Energy. Agriculture. Mt CO₂ e. 12,000.0 10,000.0 8,000.0 6,000.0 4,000.0. Mt CO₂ e. 14,000.0. 800.0 700.0 600.0 500.0 400.0 300.0 200.0 100.0 -. N₂O from wastewater CH₄ from wastewater. 2,000.0 -. Figure 1.3 (A) Total global non-CO2 emissions by sector and (B) CH4 and N2O emissions from wastewater (within the waste sector) from 1990 to 2005, and from 2005 to 2030 as estimated by calculations based on real country data, emission factors (IPCC, 2006) and projections. Emissions are expressed in CO2 equivalents (CO2 e), which is a unit that describes the GWP of any GHG, utilizing the functional equivalence of the GWP of CO2. (Data source: USEPA, 2012). Large quantities of CO2 are also emitted from the waste sector, but carbon that is present in waste is generally considered to be biogenic (withdrawn from the atmosphere and utilized by food crops). Thus, emissions of CO2 from waste represent no net flux to the system (IPCC, 2013). The two largest sources of non-CO2 GHGs within the waste sector are land-filling of solid waste and wastewater, with around 93% emissions contribution. Within the waste sector, up to 35% of the nonCO2 GHGs emissions can be attributed to wastewater treatment and handling, and global emissions of these gases are expected to increase due to the raising need of wastewater treatment by a continuously growing global population. In 2010, CH4 and N2O emitted from wastewater treatment systems contributed by 4 and 2% to the global account of each gas, respectively, according to data published by the USEPA (2012). By the year 2030, global CH4 and N2O emissions from wastewater are expected to be approximately 600 and 100 Mt CO2 e, respectively (USEPA, 2012) (Fig. 1.3), if minimization strategies are not implemented worldwide. Emission calculations in the report by the USEPA (2012) are based on the standard emission factor applied by the IPCC (2006), previously reported by Czepiel et al. (1995) (3.2 g N2O/person/year or 0.035 % of the N load) due to the lack of 18.
(48) Chapter 1 - General introduction. real full-scale data. This emission factor is then multiplied by real country data on protein consumption, population and wastewater generation when available. Calculating N2O emissions with a fixed and standardized factor presents obvious limitations that need to be taken into account, as full-scale emissions could be higher or lower, depending on the different process conditions and characteristics. Besides the obvious environmental concern related with the fugitive emissions of non-CO2 GHGs from wastewater treatment systems, there are also economical issues that nowadays are gaining relevance. Environmental taxes aiming at discouraging companies from emitting GHGs are applied worldwide, and non-CO2 GHGs from wastewater treatment systems are starting to be included in these taxes, in some cases. Some of the countries pioneering the environmental taxing of CH4 and N2O from wastewater treatment utilize standard emission factors estimated by the IPCC in the 90s, which are now obsolete or non-accurate enough. Real emission data needs to be collected on a casespecific basis for environmental policies and taxes to be applied on a more accurate manner. This would also support wastewater treatment plants (WWTPs) managers in the design and implementation of mitigation strategies by identifying the exact source of fugitive GHG gas in each system. According to a report recently published by the USEPA (2013), there is a large potential for cost-effective mitigation measures targeting non-CO2 GHGs emissions from wastewater treatment systems, although the uncertainty related with the different abatement methods and cost-benefit analyses is still a limitation for the sector. The implementation of wastewater treatment is essential for the protection of the environment and the sustainability of the human society, but it should be carried out taking into consideration GHG emissions and its global consequences.. 1.2 N2O sources and production pathways during wastewater treatment N2O can be produced through nitrification and/or denitrification (Fig. 1.4), which are two biochemical processes commonly applied with the purpose of removing nitrogen (N) compounds from wastewater. Denitrification is the biochemical reduction of ionic nitrogen oxides such as NO3and NO2- to nitric oxide (NO) and N2O with dinitrogen (N2) as end product. N2O is therefore an intermediate molecule in the denitrification reaction. In wastewater treatment, denitrification is attributed to a very diverse group of heterotrophic bacteria that couple the oxidation of organic or inorganic matter with the reduction of N compounds under anoxic conditions. During denitrification, several factors have been shown to influence N2O production. DO concentrations as low as 0.1 to 0.3 mg/L have been proven to promote N2O production due to the inhibition of denitrifying enzymes such as the N2O reductase (Schulthess et al., 1994; Otte et al., 1996; Tallec et al., 2008). Some authors also reported an increase in N2O production under low COD/N ratios (lack of organic matter) during denitrification (Schalk-Otte et al. 2000; Chung and Chung, 2000). Under such conditions, the denitrifying enzymes compete for electrons resulting in denitrification imbalances. The effect of different carbon sources has been the focus of other set of studies with various results (Hanaki et al. 1992; Christensson et al. 1994; Hallin and Pell, 1998) but it still remains unclear the degree of dependency between N2O production and the type of substrate being utilized by each denitrifying population. High NO2- and free nitrous acid (HNO2) concentrations were reported to lead to N2O accumulation due to the inhibition of the N2O reductase enzyme in denitrifying cultures (Itokawa et al., 2001; Zhou et al., 2008). However, Schulthess et al. (1995) suggested that it is NO the compound that inhibits N2O reduction rather than NO2- or HNO2, putting into perspective the relevance of NO as an important precursor of N2O emissions in wastewater treatment systems.. 19.
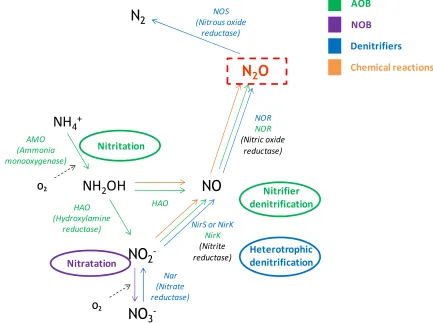
(49) Chapter 1 – General introduction. AOB. NOS (Nitrous oxide reductase). N2. NOB Denitrifiers. N2O NH4+ AMO (Ammonia monooxygenase) O2. NOR NOR (Nitric oxide reductase). Nitritation. NH2OH HAO (Hydroxylamine reductase). Nitratation. Chemical reactions. NO HAO. NO2-. NirS or NirK NirK (Nitrite reductase). Nitrifier denitrification. Heterotrophic denitrification. Nar (Nitrate reductase) O2. NO3-. Figure 1.4 Graphical representation of N2O production and consumption pathways during biological nitrogen removal, and the microbial communities and enzymes involved (modified from Desloover et al., 2012) Observations made in lab-scale experiments and full-scale studies have consistently shown a high degree of discrepancy, especially when targeting bacterial populations as diverse as the denitrifying ones. In general however, it seems that N2O production by denitrifiers is limited at the real-scale level, as reported by Ahn et al. (2010a), and nitrification is nowadays considered responsible for the majority of N2O emissions in municipal WWTPs. Nitrification consists of two coupled reactions: first, ammonium (NH4+) is oxidized to hydroxylamine (NH2OH) and NO2- through the process of nitritation by ammonia oxidizing bacteria (AOB). Then, NO2- is oxidized to nitrate (NO3-) by nitrite oxidizing bacteria (NOB) through a reaction known as nitritation, although it is widely accepted that NOB don´t contribute to N2O production (Fig. 1.4). To date, several pathways have been suggested to be responsible for the production of N2O during nitrification. One of the possibilities involve NH2OH, an intermediate product of the oxidation of NH3 to NO2- (Arp and Stein, 2003; Schmidt et al., 2004a) as a potential source of N2O. After NH3 oxidation by the ammonia monooxygenase (AMO) enzyme, NH2OH is formed. Then, the hydroxylamine oxidoreductase (HAO) enzyme converts NH2OH to the nitrosyl radical (NOH) which is further transformed into NO2- (Igarashi et al., 1997). It has been suggested that NO can be generated during the enzymatic conversion of NOH to NO2-, while the unstable breakdown of NOH can lead to N2O production (Poughon et al., 2001), although this hypothesis needs to be confirmed. Furthermore, besides the chemical oxidation of NOH, NO produced during NH2OH oxidation can be biologically reduced to N2O (Stein, 2011). These two sources of N2O production need further research to be completely understood, but their relative importance in full-scale systems has been suggested to be minor (Wunderlin et al., 2012). It has been proposed however, that nitrification systems with high 20.
(50) Chapter 1 - General introduction. NH4+ loading or elevated N conversion rates could support N2O production through NH2OH oxidation (Law et al., 2012b;) either from the chemical breakdown of NOH or from the reduction of NO being formed. Alternatively, several authors have suggested denitrification by AOB (nitrifier denitrification) as the predominant source of N2O in nitrifying systems (Goreau et al., 1980; Kampschreur et al., 2008a and 2008b; Kim et al., 2010; Wunderlin et al., 2012). Through this pathway, N2O is produced by the activity of nitrifier-encoded nitrite reductase (NirK) and nitric oxide reductase (Nor) enzymes, responsible for the reduction of NO2- to NO and N2O (Bock et al. 1995; Wrage et al. 2001; Kampschreur et al., 2008b; Kim et al., 2010), as represented in Figure 1.4. The genes encoding for the N2O-reductase haven’t been found in the genome of any of the species of AOB described to date, so N2O is thought to be the end product of nitrifier denitrification. The key parameter regulating N2O production through nitrifier denitrification is the oxygenation level (Tallec et al., 2006). In particular, anoxic or sub-oxic conditions (low DO concentrations) have been suggested to trigger the denitrification pathway in AOB (Goreau et al., 1980; Zheng et al., 1994; Chuang et al., 2007). Additionally, transient changes in the DO concentration have also been proven to increase N2O production (Kester et al., 1997; Kampschreur et al., 2008b; Peng et al., 2014). In contrast, other authors postulated that it was the recovery from anoxic conditions rather than the imposition of anoxia the trigger for N2O production (Ahn et al., 2010a; Yu et al., 2010). Many aspects of the specific N2O production mechanisms under transient anoxic conditions and different DO levels are still to be unraveled. The effect of different factors on N2O production during nitrification has traditionally been subjected to a certain degree of controversy, because many of these parameters interact with each other. When studying one isolated factor, attention needs to be paid as other parameters may also change, probably affecting N2O production. Other factors such as NH4+and NO2- concentrations have also been identified to play a key role in N2O production through nitrifier denitrification. Yu et al. (2010) showed that, upon recovery from anoxia, N2O production increased and was correlated with NH4+ being accumulated during the anoxic period in a nitrifying culture. In the same study, it was suggested that the shift from low to high activity levels promoted N2O production mechanisms. The effect of elevated NO2- concentrations on N2O production has been on focus in several studies. Many authors have shown that N2O production rates in nitrifiers are indeed correlated with NO2- accumulation (Sümer et al., 1995; Tallec et al., 2006; Kampschreur et al., 2008a and 2009; Foley et al., 2010; Desloover et al., 2011) both at the lab and full-scale levels. Novel methodology applied by Wunderlin et al. (2013) showed N2O being mainly produced through NO2- reduction in mixed bacterial populations. In a different work however, Law et al. (2013) reported reduced N2O production rates with increasing NO2- concentrations in an enriched AOB culture. Exceedingly high NO2- could be a source of inhibition in the nitrifier denitrification pathway for N2O production in AOB. From this perspective, the potential adaptation of different bacterial communities to high NO2- concentrations needs further attention from the scientific community. The high NO2- concentrations found in processes that apply or enhance partial nitrification or nitritation for the treatment of NH4+-rich wastewater, and its relation with N2O production and emissions have been object of research in this thesis, as described below.. 1.3 N2O and NO emissions from nitritation systems Wastewater treatment facilities performing anaerobic sludge digestion for biogas production are in need to implement strategies for the treatment of reject wastewater (effluent from the anaerobic digesters). The more stringent regulatory demands in terms of nutrient discharge from wastewater treatment facilities, as well as the need to reduce operational costs and energy consumption have resulted in nitritation or partial nitrification (oxidation of NH4+ to NO2-) of reject wastewater being a common side-stream process. Reject wastewater is usually characterized by high NH4+ 21.
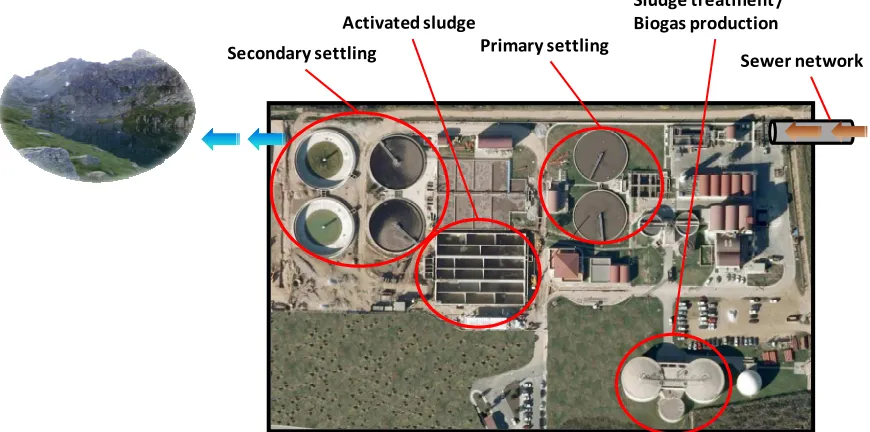
(51) Chapter 1 – General introduction. concentrations (~1g NH4+-N/L) as well as low COD content. When coupled with conventional denitrification or anammox, nitritation is considered as an attractive (low-cost) option for the treatment of NH4+-rich wastewater, but has been shown to release higher amounts of N2O than full nitrification systems (Ahn et al., 2011), probably as a side effect of the accumulation of NO2-. Law et al. (2011) detected an emission factor of 1% N2O in a lab-scale sequencing batch reactor (SBR) treating synthetic reject wastewater. In their SBR the N2O accumulated during the idle phases contributed to 94% of the total N2O emitted during the first 15 minutes of the aerated phase. Kampschreur et al. (2008a) measured 3.4% of the ammonium converted emitted as N2O in a full-scale continuous partial nitrification reactor treating reject wastewater. Similarly, Ahn et al. (2011) reported that 1.9% of the nitrogen load was emitted as N2O (with an NH4+ conversion of around 80%), these emissions being measured under transition from full to partial nitrification mode. When partial nitrification was stabilized in their system, the N2O emissions decreased to 0.57% of the nitrogen load. In another study with a partial nitritation system, Desloover et al. (2011) found that N2O emissions were 5.1-6.6% of the nitrogen load, with 45-47% of the incoming nitrogen oxidized to NO2and 13-15% oxidized to nitrate (NO3-). In general, the implementation of nitritation with NO2- accumulation might increase not only N2O but also NO emissions, the last one being a potent ozone-depleting substance and a precursor of N2O, as mentioned before. In contrast with N2O, NO has received little attention and its emission has been only measured in few studies with different results being reported from laboratory (Law et al., 2011; Ahn et al. 2011) and full-scale installations (Kampschreur et al., 2008a; Desloover et al., 2011). For example, Kampschreur et al. (2008a) found that 0.2% of the nitrogen load was emitted as NO (full-scale), while Ahn et al. (2011) described a partial nitrification lab-scale bioreactor in which the emissions of NO decreased to 0.07% of the nitrogen load after a stabilization period. In another study from a full-scale deammonification plant, 0.1% of the N output was reported to be emitted as NO (Weissenbacher et al. 2010). NO is not only a threat to the environment but also plays an important role in ammonia (NH3) oxidation, with some regulatory effects being reported (Schmidt et al., 2004b). Thus, further analyses of NO emissions from wastewater treatment should be carried out. In an extensive experiment, Ahn et al. (2011) compared N2O and NO emissions from a lab-scale bioreactor operated sequentially in full-nitrification and partial-nitrification modes and found an increase in these emissions when operating in partial nitrification conditions. However, in their study, the transition from full to partial nitrification was achieved by reducing the DO concentration and the sludge residence time (SRT) which alone could have already caused an effect on N2O production. They also reported a change on the predominant AOB population when operating under full and partial nitrification modes respectively, which could also have an effect on the overall emissions detected. The problems and uncertainties related with the application of partial nitrification for the treatment of NH4+-rich wastewater was taken as a research niche during the elaboration of this thesis. Two studies were performed with the aim of unraveling the sources and dynamics of N2O and NO production and emissions when treating high NH4+ concentration wastewater in lab-scale bioreactors, performing both nitritation and full nitrification (chapters 4 and 5). Both studies targeted the combined dynamics of both NO and N2O released from partial nitrification processes, and the interactions between them, as this issue has not been extensively approached by the scientific community to date.. 1.4 N2O and CH4 emissions from full-scale WWTPs In wastewater treatment systems, not only N2O but also CH4 have been identified as the main non-CO2 GHGs being emitted. Figure 1.5 shows the major potential sources of CH4 and N2O in a conventional municipal WWTP, namely the sewer networks and sludge treatment facilities for CH4 and the biological treatment basins (activated sludge) and settlers in the case of N2O. 22.
(52) Chapter 1 - General introduction. Sludge treatment / Biogas production. Activated sludge Secondary settling. Primary settling. Sewer network. Figure 1.5 Potential sources of fugitive GHG emissions in a conventional WWTP. In the last years, data on N2O emissions from full-scale WWTPs has been collected in different countries. However, the reported results are highly variable, and consensus is yet to be achieved on the exact causes of N2O emissions. In general, the methodology utilized for quantifying the emissions can be in itself a source of data variability. Firstly, the configuration of the bioreactors needs to be taken into consideration when choosing the monitoring methodology. Very recently, Ye et al. (2014) proposed a novel method to quantify N2O emissions in bioreactors with surface aerators. It was proven that the commonly utilized gas hood method would lead to highly inaccurate results when applied to this type of reactors. Another source of inaccuracy is the sampling strategy, with studies based on grab samples leading to an over- or underestimation of the emissions depending on the time and location of the measurements (Kampschreur et al., 2009). The typical dynamic patterns and large fluctuations described by N2O emissions along the different stages of the bioreactors and over time show the importance of on-line monitoring for accurate N2O monitoring (Kampschreur et al., 2008a). Long-term (over one year) on-line sampling has been shown to be the only strategy that allows not only identifying seasonal tendencies, but also an accurate calculation of the average N2O emissions from a particular WWTP (Daelman et al. 2013a). However, the majority of full-scale monitoring campaigns being performed to date have been carried out on a short-term basis (up to 12 months), including the research work presented in this thesis (Chapters 6 and 7). Short-term online monitoring campaigns are efficient in unraveling diurnal patterns. For research purposes, diurnal patterns may be very helpful to identify the mechanisms behind the N2O emission, since many operational parameters of a WWTP also show diurnal variability, as pointed out by Daelman et al. (2013a). In order to correlate these parameters with emissions, high frequency data of both the emission and the parameters are needed, and that is sufficiently achieved through short-term on-line monitoring. The latest published results in terms of N2O emissions have been obtained through intensive continuous measurements, facilitating the evaluation of temporal patterns and dynamics, as well as favoring the comparison between studies. Ahn et al. (2010a) presented N2O emissions data from 12 different WWTPs located in different areas of North America, with results ranging from 0.01 to 1.8% of the influent total Kjeldahl nitrogen (TKN). The variability of the reported emissions was indeed high, although all the campaigns were performed under the same monitoring protocol. In the same 23.
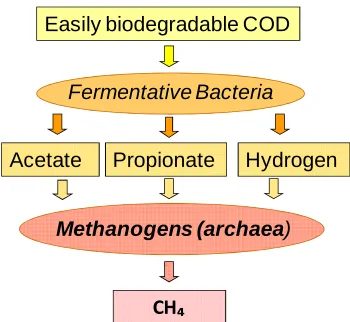
(53) Chapter 1 – General introduction. study however, a trend was found, with processes that favored transient or permanent build up of NH4+ and/or NO2- positively correlating with higher emission levels. Moreover, N2O emissions were generally found to be strongly correlated with the influent TKN loading (Ahn et al. (2010b). More recently, Aboobakar et al. (2013) reported a clear diurnal pattern associated with the inflow of wastewater and with the NH4+ loading. In their study, 0.036% of the total nitrogen (TN) load was found to be released as N2O from two full-scale activated sludge plug-flow reactors, contributing with a 13% increase to the carbon footprint of the WWTP. Aboobakar et al. (2013) found a negative, direct correlation between DO and N2O emissions, highlighting the importance of considering these emissions when designing energy optimization strategies aiming at lowering the aeration levels. Long-term (16-month) research performed by Daelman et al. (2013b) in a fully-covered municipal WWTP delivered values as high as 2.3% of the incoming N being released as N2O, representing three quarters of the carbon footprint of the WWTP under study. A seasonal trend was found in this case, relating water temperature and N2O emissions, but the reason behind this trend remained unclear. In general, the latest reports have contributed to put into perspective the high relevance of N2O emissions and their impact on the carbon footprint exerted by wastewater treatment facilities, as well as the necessity to investigate the potential for implementing minimization measures. Besides N2O emissions, during collection and treatment of wastewater anaerobic conditions may occur, resulting in CH4 production. As shown in figure 1.6, organic matter (represented as chemical oxygen demand, COD) can be converted into different compounds such as acetate, propionate or hydrogen. These substances are then utilized by methanogenic archaea with production of CH4. In wastewater treatment systems, anaerobic processes such as sludge digestion for biogas production and electricity generation can be considered as an important source of CH4. Sewer systems have also been proven to be a source of CH4 from which it can be transferred and released (Guisasola et al., 2008; Sudarjanto et al., 2014). Agitation and aeration during wastewater treatment facilitates CH4 stripping to the atmosphere.. Easily biodegradable COD Fermentative Bacteria Acetate. Propionate. Hydrogen. Methanogens (archaea). CH₄. Figure 1.6 Graphical representation of CH4 production, including compounds and groups of microorganisms involved. Before the publication of this thesis there was only one published study reporting on-line CH4 emissions from a domestic WWTP. Daelman et al. (2012) reported that 1.13% of the influent chemical oxygen demand (COD) of the WWTP of Kralingseveer (Netherlands) was emitted as CH4. About three quarters of these emissions were originated during primary and secondary sludge digestion. In that specific case, the CH4-related footprint of the sludge digester was larger than the CO2 emissions that were avoided by using biogas for energy generation (Daelman et al., 2012), putting into context the impact that uncontrolled CH4 emissions can have on the overall carbon footprint of wastewater treatment processes. Previous research by other authors (Czepiel et al., 24.
Figure
+7


Documento similar
In the previous chapters, APR was proposed as a potential route for valorisation and treatment of brewery wastewater, and although good results in terms of removal of organic
Decrease in water hardness would result in a significant social and environmental benefits. Therefore, many waterworks have been searching for solution that could be applied and
In this work, concentration and recovery of high-added value phenolic compounds from two-phase olive-oil washing wastewater (OOWW) and parallel effluent treatment by a
Finally, a comparison between biobleached treated sulfite pulp Chapter 6 and bleached commercial treated dissolving pulp Chapter 7 in terms of Fock solubility
To Patinkin, this point makes a crucial difference between both authors. For in his opinion, one of the most decisive innovations of the General Theory was precisely to provide
‘translates a generalised money illusion’, a characteristic that can be found in each of these models... A second, Keynesian model, differs from the previous one in that, on the
Lab session 2: Use of software tools for the simulation and design of wastewater treatment facilities.. Lab session 3: Use of software tools for the simulation and design of
The present work aimed to evaluate the effect of two dif- ferent no-till crop rotations: (1) a sorghum-wheat rotation, in which the possible benefits of a cover crop with BNI
