Effect of Portal Vein Ligation Plus Venous
Congestion on Liver Regeneration in Rats
Daisuke Kawaguchi,* Yukihiko Hiroshima,* Takafumi Kumamoto,* Ryutaro Mori,* Ryusei Matsuyama,* Yasushi Ichikawa,* Yoshiaki Inayama,** Itaru Endo** Department of Gastroenterological Surgery, Yokohama City University Graduate School of Medicine, Yokohama, Japan ** Department of Pathology, Yokohama City University Medical Center, Yokohama, Japan
January-February, Vol. 18 No. 1, 2019: 89-100 The Official Journal of the Mexican Association of Hepatology,
the Latin-American Association for Study of the Liver and the Canadian Association for the Study of the Liver
Manuscript received: Manuscript received:Manuscript received:
Manuscript received:Manuscript received: October 31, 2017. Manuscript accepted:Manuscript accepted:Manuscript accepted:Manuscript accepted:Manuscript accepted: January 15, 2018.
DOI:10.5604/01.3001.0012.7866
A B S T R A C T A B S T R A C T A B S T R A C T A B S T R A C T A B S T R A C T
Introduction and aim. Introduction and aim.Introduction and aim. Introduction and aim.
Introduction and aim. We developed a rat model of portal vein ligation (PVL) with venous congestion (PVL+C) to investigate beneficial effect PVL plus congestion for regeneration of intact liver segments. Materials and methods.Materials and methods.Materials and methods.Materials and methods.Materials and methods. In the PVL group, portal vein branches were ligated except the caudate lobe (CL). In the PVL + C group, the left lateral hepatic vein was ligated in addition to PVL. Chronological changes in the following variables were compared among the groups: CL weight to body weight ratio (CL/BW), embolized liver weight to body weight ratio (EL/BW), histological findings of the embolized/non-embolized liver, and expression of several mediators that affect liver regeneration in the non-embolized liver. Results.Results.Results.Results.Results. Weight regeneration of CL continued up to post-operative day (POD)7 in PVL + C, but terminated at POD2 in PVL. CL/BW at POD7 was significantly higher in PVL + C than in PVL (2.41 ± 0.33% vs. 1.22 ± 0.18%, P < 0.01). In contrast, EL/BW continued to decrease up to POD7 in PVL + C but reached nadir at POD2 in PVL. Furthermore, EL/BW at POD7 was significantly smaller in PVL + C than in PVL (0.35 ± 0.03% vs. 0.67 ±
0.08%, P < 0.01). Histologically-proven injury in the embolized liver was more severe in PVL + C than in PVL. Expression of Ki-67, IL-6, TNF-α, and HGF were greater and/or more prolonged in PVL + C than in PVL. Conclusions.Conclusions.Conclusions.Conclusions.Conclusions. Our rat model of PVL + C was considered useful for investigating the beneficial effect of congestion in addition to PVC. PVL + C caused increased devastation of the embolized liver, and higher and more prolonged expression of factors promoting liver regeneration in the non-embolized liver than in PVL.
Key words. Key words.Key words. Key words.
Key words. Hepatectomy. Malignant liver tumors. Hepatic vein embolization. Associating liver partition and portal ligation for staged hepatectomy.
INTRODUCTION
Despite the introduction of highly effective non-surgi-cal treatments for malignant tumors, only a hepatectomy can currently provide the chance of a cure for patients
with hepatobiliary malignancy.1-4 Portal vein embolization
or ligation (PVE/L) has been widely used for securing the safety of a subsequent major hepatectomy as well as ex-panding hepatectomy indications for patients with livers severely affected by hepatobiliary malignancy due to its ability to regenerate non-embolized liver, i.e. future liver remnant (FLR). However, 14-37% of patients receiving PVE/L have abandoned surgery due to insufficient regen-eration of the FLR as well as oncological deterioration
during the interval between PVE/L and hepatectomy.5-7
To compensate the above-stated concerns regarding PVE/L, i.e. insufficient FLR regeneration and modest generation velocity requiring 3-4 weeks for sufficient re-generation, hepatic venous embolization combined with PVE/L and associating liver partition and portal ligation for staged hepatectomy (ALPPS) were introduced and
have been applied worldwide.8,9 In these two novel
ap-proaches, congestion in addition to PVE/L has been con-sidered to have a central role in enabling a beneficial effect for regeneration of the non-embolized liver in terms of resultant FLR hypertrophy and/or earlier expansion of FLR.10,11 A clinical study by Hwan, et al. reported that
con-gestion due to hepatic venous embolization performed subsequently to PVE/L caused greater FLR expansion than
expan-sion and/or greater resultant of FLR brought on by ALPPS compared to PVE/L alone can be explained partly by par-tial congestion of the planned resected liver segments caused by venous disruption due to liver partition.10
Several animal models of PVE/L have been introduced to investigate the detailed mechanisms of the beneficial ef-fect of PVE/L for regeneration of the non-embolized liv-er.13,14 However, to the best of our knowledge, an animal
model of PVE/L with venous congestion to investigate the beneficial effect of congestion in addition to PVE/L has not yet been reported. In the present study, we developed a rat model of PVL with venous congestion (PVL + C) to determine the beneficial effect of congestion in addition to PVE/L in regeneration of the non-embolized liver in comparison PVL alone.
MATERIALS AND METHODS
Animals
Eight-week-old male Wistar rats (Kureo, Tokyo, Japan) were housed in a room with a 12-h light/dark cycle and given full access to tap water and laboratory food. During all experimental procedures, animals were treated in ac-cordance with the guidelines outlined in the Guide for the Care and Use of Laboratory Animals that was prepared by
the US National Academy of Sciences and published by the National Institutes of Health (Bethesda, MD). The experimental protocol was approved by our institutional animal care committee (protocol number: F-A-14-008).
Experimental operative procedures
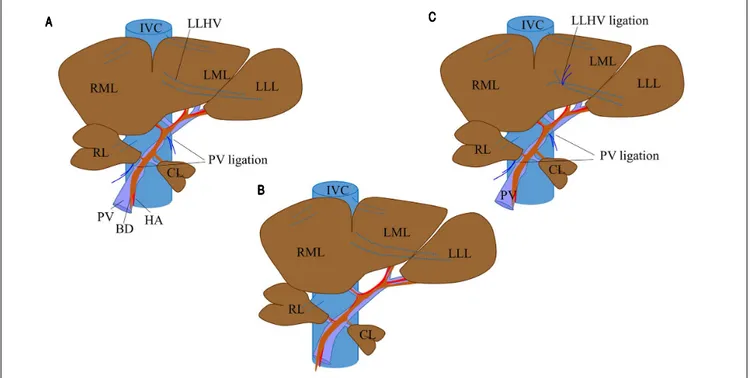
The rat liver consists of four lobes (Figure 1C): the right lobe (RL); the middle lobe, which includes the right middle lobe (RML) and the left middle lobe (LML); the left lateral lobe (LLL); and the caudate lobe (CL). Each lobe is supplied by its own portal pedicle and is drained by its own hepatic veins.
Rats were assigned at random to one of three experi-mental groups: PVL, PVL + C, and sham operation (SHAM). All surgical procedures were performed under anesthesia with isoflurane (concentration, 1.5%) and oxy-gen (flow rate, 0.5 L/min). In the PVL group (Figure 1A), selective PVL was performed to affect the RL, RML, LML, and LLL; after careful dissection sparing the hepatic arter-ies and bile ducts, portal veins corresponding to the lobes were ligated with 6-0 silk sutures. The CL was preserved and allowed to regenerate. In the PVL + C group (Figure 1B), PVL was performed as described above. Venous con-gestion then was induced by ligation of the left lateral
he-Figure 1. Figure 1. Figure 1. Figure 1.
Figure 1. Surgical procedure for PVL and in PVL with venous congestion (PVL + C) rat models. For PVL (A)(A)(A)(A)(A), PVL is performed for the right and left middle lobes, left lateral lobe, and right lobe. For PVL + C (B)(B)(B)(B)(B), the same PVL procedure is performed followed by induction of venous congestion by ligating the left lateral hepatic vein. The preoperative rat liver anatomy is shown in panel CCCCC (sham operation). PVL: portal vein ligation. CL: caudate lobe. RML: right middle lobe. LML: left middle lobe. LLL: left lateral lobe. PV: portal vein. IVC: inferior vena cava. HA: hepatic artery. LLHV: left lateral hepatic vein.
AAAAA
BBBBB
patic vein. Special attention was paid to secure the integri-ty of the portal branches feeding the CL via the PVL and not to cause stenosis of the inferior vena cava and/or other hepatic veins via the lateral hepatic vein ligation. In the SHAM group (Figure 1C), the hepatic artery, PV, and bile duct were dissected without ligation, after which the ab-domen was closed using double running sutures.
Arterial circulation and biliary duct branches were maintained in all rats. In both procedures including PVL, preservation of arterial flow reduced likelihood of the liv-er parenchyma becoming totally ischemic with subse-quent abscess formation. No deaths or serious complications occurred during the surgical procedures or subsequent 7-d observation period.
Experimental design and tissue allocation
Animals were weighed regularly. The 150 study rats were randomized into three groups of 50 each and sacri-ficed using a mixture of 4% isoflurane and saturated carbon dioxide atmosphere at different time intervals: immedi-ately after surgery and 24 h, 48 h, 3 d, and 7 d later (10 rats per group at each time point) (Figure 2). At the time of killing blood samples were collected from the abdominal aorta, and the entire liver was removed and divided into the RML, LML, LLL, RL, and CL, each of which was weighed. Samples of the lobes then were processed for histologic examination. In particular, approximately 200 mg of liver tissue from the CL was fixed in 10% formalin solution or snap-frozen in liquid nitrogen, with the frozen samples stored at -80 °C until use.
To investigate the difference between PVL and PVL + C, the following variables were compared among the SHAM, PVL, and PVL groups.
Histologic and
immunohistochemical examination
After immersion fixation in 10% formalin, liver tissues were embedded in paraffin and sectioned by routine methods. Some sections were stained with hematoxylin-eosin (HE). Additionally, the rate of liver regeneration was determined from the frequency of Ki-67-positive cells as follows. Liver sections from the CL taken at 24 h, 48 h, 3 d, and 7 d after surgery were deparaffinized and rehydrat-ed with xylene and a gradrehydrat-ed ethanol series. Antigen re-trieval was performed by placement of sections in 10-mM sodium citrate buffer (pH 6.0) for treatment in a micro-wave oven at 121 °C for 30 min. Endogenous peroxidase activity was quenched by immersion in 0.3% hydrogen peroxide in methanol for 30 min. Nonspecific binding sites then were blocked using a 10% rabbit serum solution for 15 min at 37 °C. Next, sections were incubated at room temperature for 1 h with a mouse monoclonal anti-rat Ki-67 antibody (DAKO Japan, Tokyo) diluted 1:25 in phos-phate-buffered saline. Sections were then incubated with peroxidase-labeled anti-mouse antibody (Dakocytomation EnVision1 System) according to the manufacturer’s in-structions, followed by incubation with 3,3’-diaminoben-zidine and counterstaining with Mayer’s hematoxylin. After Ki-67-positive hepatocytes were counted in 10 ran-domly chosen high-power fields from three sections per group, means were calculated for analysis.
Hepatocytic apoptosis was assessed in sections from the LLL using the terminal deoxynucleotidyl transferase dUTP nick-end labeling (TUNEL) method, using an in situ cell death detection kit (Roche Diagnostics, Tokyo, Japan) according to the manufacturer’s instructions. After TUNEL-positive hepatocytes were counted in 10 ran-domly chosen high-power fields from three sections per group, means were calculated for analysis.
Figure 2. Figure 2.Figure 2.
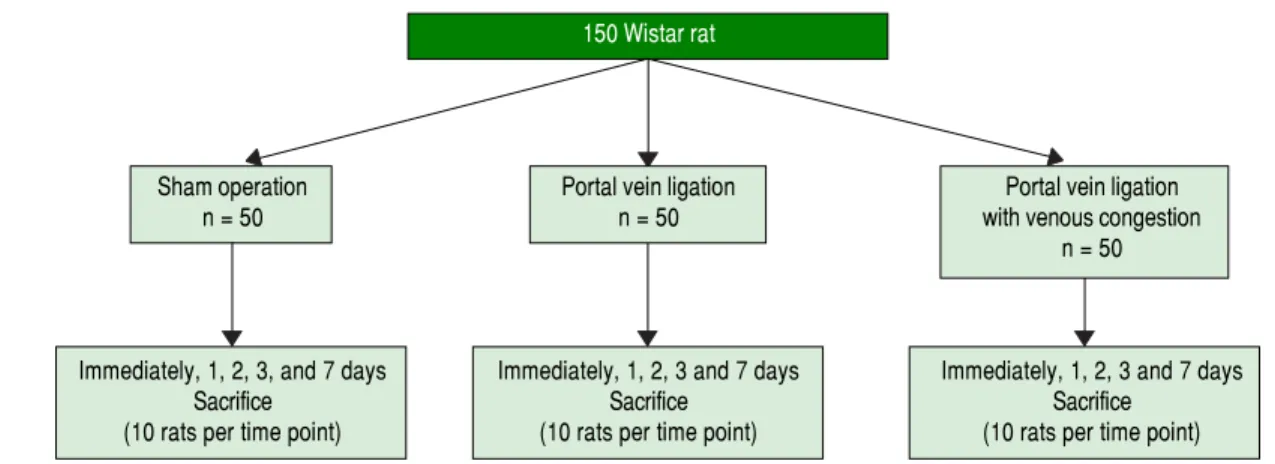
Figure 2.Figure 2. Experimental design. The 150 study rats were randomized into three groups of 50, and sacrificed at different intervals of time: immediately after surgery, and 24 h, 48 h, 3 d, and 7 d later (10 rats per group at each time point).
150 Wistar rat
Sham operation Portal vein ligation Portal vein ligation
n = 50 n = 50 with venous congestion
n = 50
Immediately, 1, 2, 3, and 7 days Immediately, 1, 2, 3 and 7 days Immediately, 1, 2, 3 and 7 days
Sacrifice Sacrifice Sacrifice
PVL + C PVL SHAM
All histologic analyses were performed without knowl-edge of the experimental group.
Blood laboratory tests
Serum concentrations of alanine aminotransferase (ALT), aspartate aminotransferase (AST), and total bi-lirubin (T.Bil) were measured using standard laboratory methods.
Real-time reverse-transcription polymerase chain reaction (RT-PCR)
Cytokines that reportedly affected liver regeneration were assessed at the messenger RNA (mRNA) level de-termined by RT-PCR, which was performed in snap-frozen CL specimens obtained at 24 h, 48 h, 3 d, and 7 d after surgery. Expression of the following cytokines in
the CL was investigated: tumor necrosis factor-α
(TNF-α), interleukin-6 (IL-6), cyclin C, cyclin D1,
hepatocyte growth factor (HGF), and interleukin-1αβ
(IL1-β). After total RNA was isolated from each sample
using an RNAspin mini RNA isolation kit (GE Health-care, Buckinghamshire, UK), complementary DNAs (cDNAs) were synthesized from 2 mg of each total RNA sample using high-capacity RNA-to-DNA kits (Applied Biosystems, Foster City, CA). Each cDNA sample was diluted 4-fold before PCR amplification. TaqMan gene expression assays (Applied Biosystems) guided the design of primers. RT-PCR was performed using a 7900HT Fast RT-PCR System (Applied Biosys-tems) and TaqMan Fast Advanced Master Mix (Applied Biosystems) according to the manufacturer’s instruc-tions. Amplification consisted of an initial 10-min dena-turation phase at 95 °C, followed by 40 cycles of denaturation at 95 °C for 10 s, annealing at 60 °C for 40 s, and extension at 72 °C for 10 s. Degree of expression of each target gene was normalized relative to expression of the mRNA encoding glyceraldehyde-3-phosphate dehydrogenase (GAPDH) determined in the same sam-ple to permit informative between-samsam-ple compari-sons. Assays were performed in triplicate.
Statistical analysis
Continuous data are expressed as the mean (± standard deviation) or median (range), and were analyzed using the
Mann-Whitney U test. The χ2 test or Fisher’s exact test
was used to analyze categorical variables. A two-sided P value < 0.05 was considered to indicate significance in all analyses.
Figure 3. Figure 3.Figure 3.
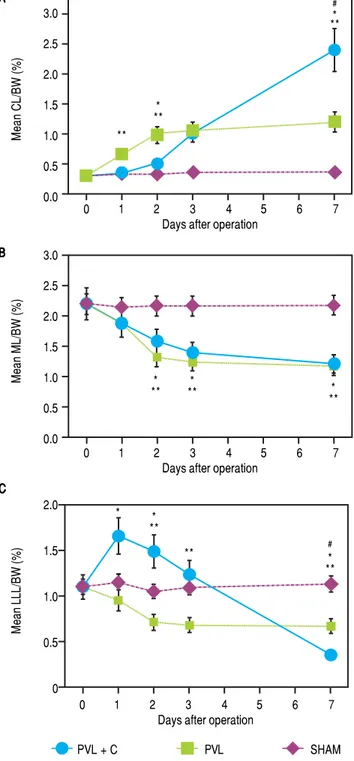
Figure 3.Figure 3. Hepatic lobe weights as percentages of BW for CL (A)(A)(A)(A)(A), ML (B)
(B)(B)
(B)(B), and LLL (C)(C)(C)(C)(C) after SHAM, PVL, and PVL + C procedures. CL weights relative to body weights are significantly greater after PVL and PVL + C at postoperative days 3 and 7 than those for the SHAM group. This relative CL weight is significantly greater for the PVL + C than the PVL group at post-operative day 7. Values are expressed as mean ± standard deviation. #, P < 0.01 for the PVL + C group vs. the PVL group. *: P < 0.01 for the PVL + C group vs. the SHAM group. **: P < 0.01 for the PVL group vs. the SHAM group. PVL: portal vein ligation. CL: caudate lobe. LML: middle lobe. LLL: left lateral lobe. SHAM: sham operation. BW: body weight. PVL + C: portal vein ligation with venous congestion.
AAAAA
BBBBB
C CC CC
3.0 2.5 2.0 1.5 1.0 0.5 0.0
0 1 2 3 4 5 6 7
Days after operation
Mean CL/BW (%)
3.0 2.5 2.0 1.5 1.0 0.5 0.0
0 1 2 3 4 5 6 7
Days after operation
Mean ML/BW (%)
2.0
1.5
1.0
0.5
0
0 1 2 3 4 5 6 7
Days after operation
Mean
LLL/BW
(%)
** * **
#
* **
*
** *** ***
* **
** *
#
RESULTS
Chronological changes in
weight regeneration of each liver lobe after surgery
Chronological changes in liver weight regeneration af-ter surgery are shown in figure 3. The ratio of CL weight to body weight (CL/BW) continued to increase up to postoperative day (POD)7 in the PVL + C group; howev-er, the growth of CL/BW terminated at POD2 in the PVL group and remained unchanged in the SHAM group. CL/ BW at POD7 was 0.31 ± 0.02% in the SHAM group, 1.22 ± 0.18% in the PVL group, and 2.41 ± 0.33% in the PVL + C group, respectively (SHAM vs. PVL, P < 0.01; PVL vs. PVL + C, P < 0.01; SHAM vs. PVL + C, P < 0.01). With regard to LLL, i.e., the embolized (congested) liver, LLL weight to body weight ratio (LLL/BW) continued to de-crease up to POD7 in the PVL + C group but reached na-dir at POD2 in the PVL group and remained unchanged in the SHAM group. LLL/BW at POD7 was 1.13 ± 0.15% in the SHAM group, 0.67 ± 0.08% in the PVL group, and 0.35 ± 0.03% in the PVL + C group (SHAM vs. PVL, P < 0.01; PVL vs. PVL + C, P < 0.01; SHAM vs. PVL + C, P < 0.01). In contrast, the weight regeneration of ML, which was embolized alone in the PVL or PVL+C group, showed no significant difference between the PVL and PVL + C groups (Figure 3). Similarly, chronological changes in weight regeneration of the RL, which was em-bolized alone in the PVL or PVL + C groups, did not show any significant difference between the PVL and PVL + C groups (data not shown).
Laboratory tests on serum
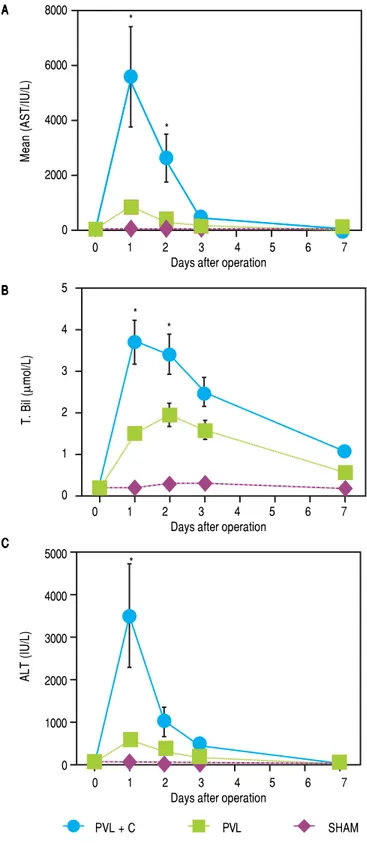
Chronological changes in serum ALT, AST, and T.Bil levels in each group are shown in figure 4. A remarkable elevation of these variables was observed at POD1 in the PVL + C group. A > 5-fold elevation in ALT and AST or > 2-fold elevation in T.Bil were observed in the PVL + C group in comparison with the PVL group at POD1 (P < 0.01). However, the PVL + C group values rapidly recov-ered and did not show any significant differences com-pared to the other groups at POD3 and thereafter.
Histologic and
immunohistochemical assessment
Representative photomicrographs at POD1 and POD7 (HE) are shown in figure 5. The most marked microscop-ic abnormalities at POD1 were seen in the LLL of the PVL+C group, including hepatocyte atrophy, sinusoidal congestion, and cytoplasmic vacuolation (Figure 5A), with fibrosis ensuing by POD7 (Figure 5B). Although these
Figure 4. Figure 4.Figure 4. Figure 4.
Figure 4. Serial changes in postoperative liver function test results. AST, ALT, and T.Bil are significantly higher in the PVL + C than in the PVL group at 24 h postoperatively. Results are expressed as the median (range) of 10 rats per group at each time point. *: P < 0.01 for the PVL + C group vs. the PVL group. AST, aspartate aminotransferase. ALT: alanine aminotrans-ferase. T.Bil: total bilirubin. PVL: portal vein ligation. PVL + C: portal vein li-gation with venous congestion.
AAAAA
BBBBB
C CC CC
8000
6000
4000
2000
0
0 1 2 3 4 5 6 7
Days after operation
Mean
(AST/IU/L)
5
4
3
2
1
0
0 1 2 3 4 5 6 7
Days after operation
T. Bil (
μ
mol/L)
5000
4000
3000
2000
1000
0
0 1 2 3 4 5 6 7
Days after operation
ALT (IU/L)
PVL + C PVL SHAM
*
*
* *
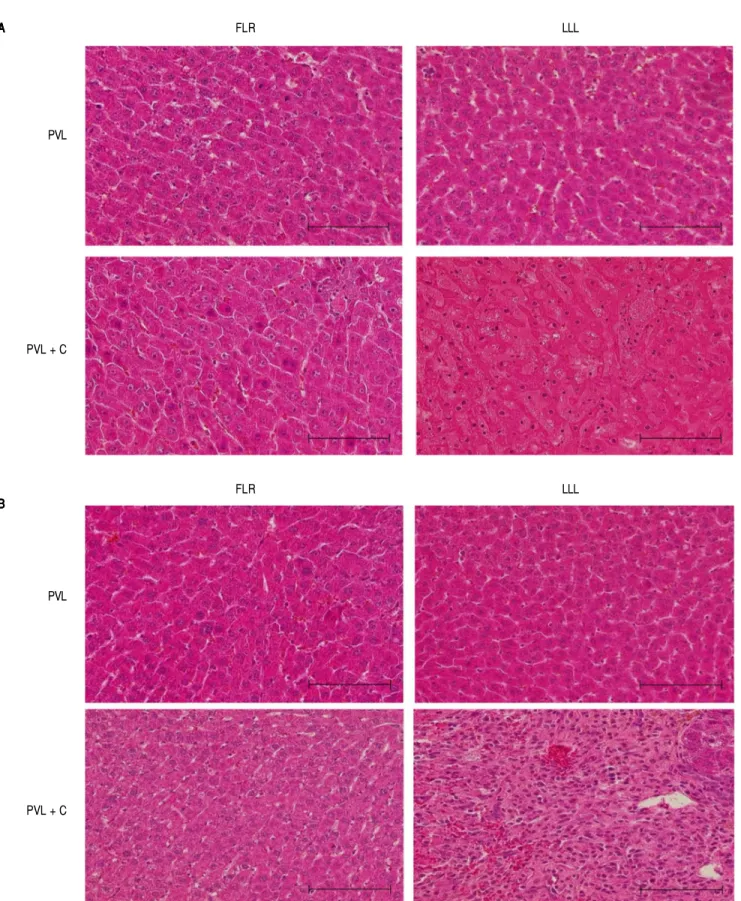
Figure 5. Figure 5. Figure 5. Figure 5.
Figure 5. Representative microscopic images of FLR and LLL for the PVL and PVL + C groups at 24 h and 7 d postoperatively. A.A.A.A.A. In the PVL + C group, atrophy, sinusoidal congestion, and cytoplasmic vacuolation are observed in the LLL at 24 h. BBBBB In the same group, severe fibrosis is observed in the LLL at 7 d. Scale bar = 100 m. (A) and (B): hematoxylin and eosin stain, original magnification x200. FLR: future liver remnant. LLL: left lateral lobe. PVL: portal vein li-gation. PVL + C: portal vein ligation with venous congestion.
AAAAA
BBBBB
L L L R
L F
PVL
PVL + C
L L L R
L F
PVL
PVL + C PVL SHAM
Figure 6 (A-B). Figure 6 (A-B).Figure 6 (A-B). Figure 6 (A-B).
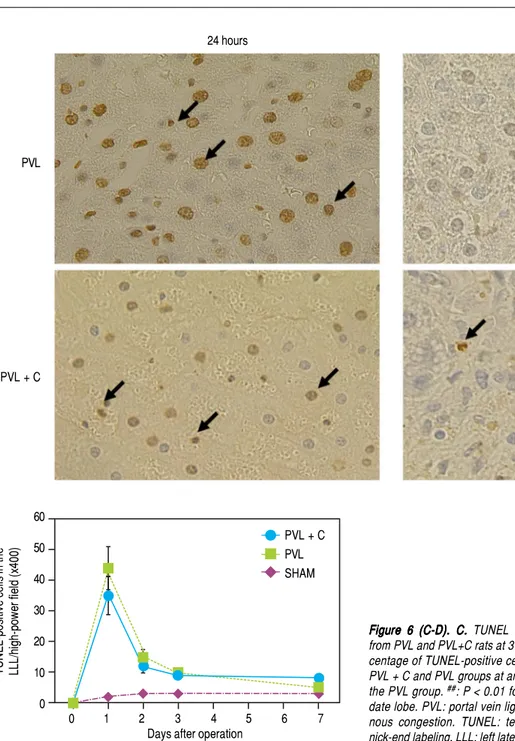
Figure 6 (A-B). Ki-67-positive cells in the CL (A,B)(A,B)(A,B)(A,B) and TUNEL-positive(A,B) cells in the LLL (C,D)(C,D)(C,D)(C,D)(C,D) over time following surgery. A.A.A.A.A. Ki67 staining in CL tissue samples taken from PVL and PVL + C rats at 24 h and 3 d. Arrows indicate positive cells. B.B.B.B.B. The percentage of Ki-67-positive CL cells at post-operative days 3 and 7 is significantly higher in the PVL + C group than in the PVL group. #:P < 0.01 for the PVL + C vs. the PVL group. ##: P < 0.01
for the PVL vs. the PVL + C group. CL: caudate lobe. PVL: portal vein liga-tion. PVL + C: portal vein ligation with venous congesliga-tion. TUNEL: terminal deoxynucleotidyl transferase dUTP nick-end labeling. LLL: left lateral lobe. SHAM: sham operation.
AAAAA
BBBBB
Ki
67-positive
cells
in
th
e
CL/high-power
field
(x400
)
findings were observed after PVL alone, the grade of each was severer in the PVL + C group than in the PVL group. Furthermore, fibrosis was not observed at any time points in the PVL group.
A comparison of Ki-67 expression in the CL between the PVL and PVL + C groups showed that the maximum Ki-67-positive hepatocyte counts during the 7 days after surgery were significantly greater in the PVL + C than in
the PVL (PVL+C vs. PVL, P < 0.01; Figure 6A and 6B).
Furthermore, Ki-67 positive hepatocyte counts peaked at
POD1 and thereafter decreased rapidly to the same level as that in the SHAM group in the PVL group, whereas Ki-67-positive hepatocyte counts increased up to POD3 and thereafter decreased gradually in the PVL + C group. Consequently, Ki-positive hepatocyte counts at POD7 were significantly greater in the PVL+C group than in the
PVL group (40 ± 7 vs. 14 ± 3, P < 0.01). These findings
suggest that regenerative stimulation of the CL caused by PVL+C is greater in magnitude and more prolonged in duration than that caused by PVL alone.
24 hours Day 3
PVL
PVL + C
140
120
100
80
60
40
20
0
0 1 2 3 4 5 6 7
Days after operation ##
PVL + C PVL SHAM
Figure 6 (C-D). Figure 6 (C-D).Figure 6 (C-D).
Figure 6 (C-D).Figure 6 (C-D). C.C.C.C.C. TUNEL staining in the LLL tissue samples taken from PVL and PVL+C rats at 3 d. Arrows indicate positive cells. D.D.D.D. The per-D. centage of TUNEL-positive cells is not significantly different between the PVL + C and PVL groups at any time point. #: P < 0.01 for the PVL + C vs.
the PVL group. ##: P < 0.01 for the PVL vs. the PVL + C group. CL:
cau-date lobe. PVL: portal vein ligation. PVL + C: portal vein ligation with ve-nous congestion. TUNEL: terminal deoxynucleotidyl transferase dUTP nick-end labeling. LLL: left lateral lobe. SHAM: sham operation.
C CC CC
D DD DD
TUNEL-positive
cells
in
th
e
LLL/high-power
field
(x400
)
Maximum counts of TUNEL-positive hepatocytes in the LLL were observed at POD1 in both the PVL and PVL + C groups. Furthermore, these counts did not differ be-tween the two groups at any time point (Figure 6C and 6D).
Up-regulation of the
mRNA expression of pro-inflammatory cytokines
Molecular analysis of the FLR (represented by the CL)
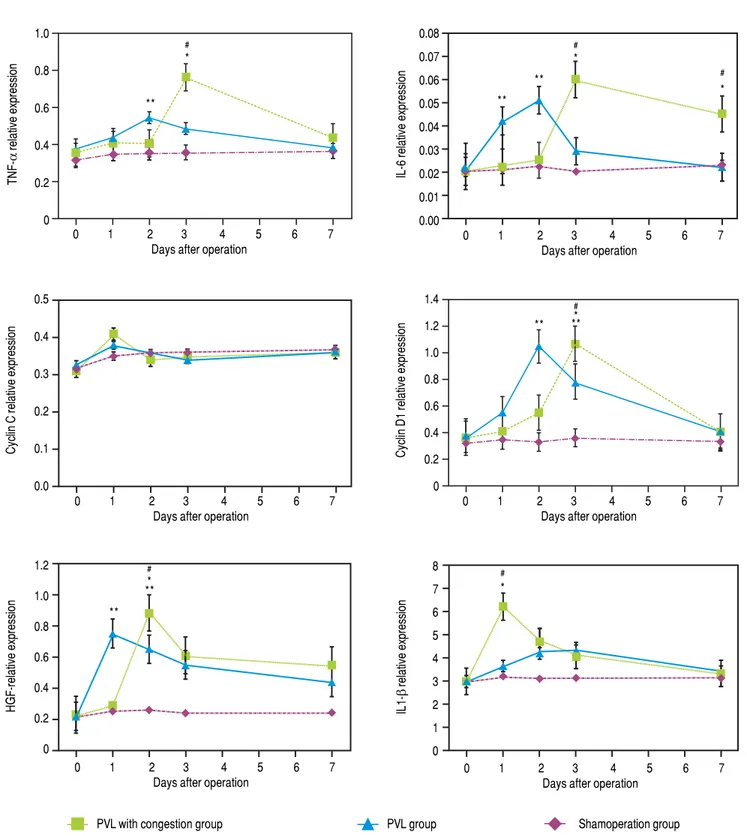
demonstrated larger increases in the TNF-α, IL-6, and
cy-clin D1 mRNA expression in the PVL than in the PVL +
C group at 48 h after surgery, while expression of mRNA
encoding IL1-β was higher in the PVL + C group (P <
0.01, Figure 7A to C). Expression for IL1-β at 24 h, HGF at
48 h, and TNF-α, IL-6, and cyclin D1 on POD3 were
higher in the PVL + C than in the PVL group (P < 0.01). On postoperative day 7, IL-6 expression was higher in the PVL + C than in the PVL group (P < 0.05). Cyclin C ex-pression was increased at 24 h after surgery, but showed no significant difference between the two groups at that time point.
To summarize these findings, a greater and more
pro-longed expression of TNF-α and IL-6 were observed in
60
50
40
30
20
10
0
0 1 2 3 4 5 6 7
Days after operation
24 hours Day 7
PVL
0 1 2 3 4 5 6 7 Days after operation
PVL with congestion group PVL group Shamoperation group
#
*
**
#
*
**
#
* **
**
#
* **
#
* **
#
* **
Figure 7. Figure 7.Figure 7. Figure 7.
Figure 7. Expression of mRNAs for cytokines in CL tissue after the procedures. Expression was determined using quantitative real-time RT-PCR and standard-ized to GAPDH mRNA expression. A.A.A.A.A. Relative expression of TNF-α and IL-6 mRNAs is significantly higher in the PVL than the PVL + C group at 48 h after sur-gery, while on postoperative day 3 these are significantly higher in the PVL + C than the PVL group. B.B.B.B.B. Relative expression of cyclin D1 mRNA is significantly higher in the PVL than PVL + C group at 48 h after surgery, while on postoperative day 3 this is significantly higher in the PVL+C than the PVL group. C.C.C.C. RelativeC. expression of IL1-β mRNA at 24 h and of HGF at 48 h is significantly higher in the PVL + C than the PVL group. #: P < 0.01 for the PVL + C vs. the PVL group. *: P < 0.01 for the PVL + C vs. the SHAM group. **: P < 0.01 for the PVL vs. the SHAM group. mRNA: messenger RNA. CL: caudate lobe. PVL: portal vein ligation. PVL + C: portal vein ligation with venous congestion. SHAM: sham operation. RT-PCR: real-time reverse-transcription polymerase chain reaction. GAPDH: glyceraldehyde-3-phosphate dehydrogenase. TNF-α, tumor necrosis factor-α. IL-6, interleukin-6. HGF: hepatocellular growth factor. IL1-β, interleukin-1β.
TNF-α
relative expression
1.0
0.8
0.6
0.4
0.2
0
IL-6 relative expression
0.08 0.07 0.06 0.05 0.04 0.03 0.02 0.01 0.00
0 1 2 3 4 5 6 7
Days after operation
Cyclin
C
relative
expression
0.5
0.4
0.3
0.2
0.1
0.0
0 1 2 3 4 5 6 7
Days after operation
Cyclin D1 relative expression
1.4 1.2 1.0 0.8 0.6 0.4 0.2 0
0 1 2 3 4 5 6 7
Days after operation
HGF-relative expression
1.2 1.0 0.8 0.6 0.4 0.2 0
0 1 2 3 4 5 6 7
Days after operation
IL1-β
relative expression
8 7 6 5 4 3 2 1 0
0 1 2 3 4 5 6 7
Days after operation AAAAA
BBBBB
the PVL + C group than in the PVL group. Furthermore, a greater magnitude of maximum expression of HGF and
IL1-β was observed in the PVL + C group than in the
PVL group. However, a difference in the maximum ex-pression of cyclin C or cyclin D1 was not observed among the groups, although the expression of cyclin D1 in the PVL + C group was delayed. A significant difference in cyclin D1 expression between the PVL and PVL + C groups was observed at POD2 or POD3, but not on the other days.
DISCUSSION
To the best of our knowledge, there have been no re-ports of an animal model to investigate the beneficial ef-fect of congestion in addition to PVE/L; therefore, we developed a rat model of PVL + C. Our model showed that a greater FLR expansion and more severe atrophy of the embolized/congested lobe were achieved by PVL + C compared with PVL alone. Hence, we considered that the findings obtained from our rat model could be reflected in the clinical setting.
In the present study, we corroborated that PVL + C caused severe devastation of the planned resected liver than PVL alone, and further demonstrated that the expres-sion of several mediators promoting liver regeneration in FLR were greater and/or more prolonged in the PVL + C group than in the PVL group.
Increased devastation of the LLL in the PVL+C group compared to the PVL group was confirmed not only quan-titatively but also qualitatively. A reduction in the LLL weight as well as histologically-proven impairment in-cluding sinusoidal congestion, cytoplasmic vacuolization, and fibrosis were more severe and sustained in the PVL + C than in the PVL. Furthermore, significantly higher val-ues of the results from the serum liver function test were considered to reflect the severer qualitative devastation of the LLL caused by congestion in addition to PVL. The functional demand of the devastated part of the liver was reported to shift to another portion.15 This functional shift
was considered to serve as regenerative stimulation to the intact liver. Therefore, the more severe the devastation of the embolized liver, the larger the FLR. PVL reportedly
promotes hepatocyte apoptosis in the embolized liver.15
However, hepatocyte apoptosis in the LLL assessed by TUNEL staining did not show any difference between the PVL and PVL + C groups in the present study. Thus, the increased devastation caused by congestion in addition to PVE/L was brought on by factors other than apoptosis. On the other hand, several clinical studies have demonstrated that hepatic vein embolization combined with PVE/L and the ALPPS procedure increased the mortality and/or
mor-bidity rates compared with PVE/L alone. In our model, venous congestion was applied to only one of the four em-bolized liver lobes. Nevertheless, a > 5-fold elevation in the serum transaminase level was observed in the PVL + C group compared with the PVL group. In clinical set-tings, hepatic vein embolization combined with PVE/L and the ALPPS procedure affects all embolized liver lobes. Therefore, a more pronounced hepatic parenchymal injury might be considered to occur in the clinical setting than in our model, leading to more frequent mortality and/ or morbidity than with PVE/L alone.
With regards to the chemical mediators affecting liver regeneration, we examined the mRNA expression of
TNF-α, IL-6, HGF, cyclin C, cyclin D1, and IL1-β in the
FLR to explore the molecular mechanisms of regenera-tion in the CL. These cytokines have been reported to be important for hepatocyte proliferation and are thus con-sidered suitable for investigating the possible mechanisms of the beneficial effect of congestion in addition to PVE/L,
as well as assessing the reliability of our model.16
The mRNA expression of TNF-α, IL-6, and HGF were
up-regulated significantly in the PVL + C group com-pared to the PVL group, but not in the SHAM group.
The cytokines, including TNF-α, IL-6, and HGF, act as
mitogenic stimuli on hepatocytes during regeneration.16,17
TNF-α and IL-6 are particularly important in initiating
liver regeneration. Produced by activated Kupffer cells, these pro-inflammatory cytokines promote transition of
hepatocytes from the G0 to the G1 phase.18-20 Our findings
indicate that venous congestion in addition to PVE/L caused increased expression and/or a more prolonged up-regulation of these pro-inflammatory cytokines than PVE/L alone. Interestingly, PVL+C resulted in a delayed upregulation of cyclin D1 mRNA compared to PVL alone, even though the maximum magnitude of cyclin D1 expression did not differ among the PVL and PVL + C groups. This important cell-cycle regulatory protein can stimulate cell passage through the G1 checkpoint into the
S phase.21 As previously reported, liver regeneration is a
changing process consisting of multiple intracellular events that show complex interactions involving cy-tokines and growth factors.16,22 Our findings are consistent
with such a process and suggests that venous congestion induces changes in cytokines and regulatory proteins that contribute to the increase in FLR volume after PVL+C. Previous studies have reported that high-mobility group protein 1 (HMGB-1) can stimulate inflammatory cy-tokines in response to internally detected biologic
threats.23 As such, many details of the mechanisms by
complex relationships between venous congestion and inflammation.
The present study has several limitations. Firstly, our model does not include a liver partition procedure, al-though it was designed with the aim to investigate the ad-ditional effect of hepatic vein embolization as well as ALPPS to PVE/L alone. The liver partition procedure it-self is considered to produce a stimulatory effect for liver regeneration.24 Unfortunately, the effect of liver partition
procedure itself cannot be assessed by our model. Sec-ond, the volume of intact liver in our model may be too large compared to that in a clinical setting. Our rat model of PVL + C was designed to simulate a 90% hepatectomy in rats. As we previously reported, rats can survive a 90% hepatectomy, in which all hepatic lobes except for entire
CL are removed.25 In the clinical setting, hepatic vein
embolization combined with the PVE/L or ALPPS pro-cedure is usually applied for patients who are considered unlikely to survive surgery because of a very small FLR and/or insufficient FLR expansion. Therefore, we should have generated a fatal hepatectomy model, such as a 95% hepatectomy model, in which all hepatic lobes except for the posterior CL are removed as rats cannot survive this
surgery, as previously reported.25 However, a PVL model
to simulate a 95% hepatectomy in rats requires separate ligation of the anterior CL portal branch in addition to the RL, RML, LML, and LLL branches. Separate isola-tion of the anterior CL portal branch is quite difficult because divergence of the anterior and posterior CL por-tal branches is almost always entirely buried in the hepat-ic parenchyma in rats. Therefore, we did not simulate a 95% hepatectomy. Third, we did not assess cytokine pro-files within 24 h after surgery. Several previous reports have shown that expression of mediators affecting liver regeneration is initiated immediately after surgery,
with-in several hours.26,27 However, the present study results
suggest that congestion in addition to PVL causes greater and more prolonged expression of these mediators than PVL alone, which we consider provides evidence for a difference between PVL + C and PVL alone. Even if these limitations, we believe that the present study pro-vides important new information concerning the signifi-cance of congestion in addition to PVL for stimulating FLR regeneration.
In conclusion, the PVL + C rat model was considered useful to investigate the beneficial effect of congestion in addition to PVC. PVL + C resulted in more severe devas-tation of the embolized liver, as well as increased and more prolonged expression of factors promoting liver re-generation in the non-embolized liver compared with PVL alone, leading to earlier and more robust FLR regen-eration.
ABBREVIATIONS
• ALT: alanine aminotransferase.
• AST: aspartate aminotransferase.
• BW: body weight.
• CL: caudate lobe.
• FLR: future liver remnant.
• HE: hematoxylin-eosin.
• HGF: hepatocyte growth factor.
• HMGB-1: high-mobility group protein 1.
• IL-1βββββ: interleukin 1β.
• GAPDH: glyceraldehyde-3-phosphate dehydrogenase.
• IL-6: interleukin 6.
• LLL: left lateral lobe.
• LML: left middle lobe.
• mRNA: messenger RNA.
• PVE: portal vein embolization.
• PVL: portal vein ligation.
• PVL + C: PVL with venous congestion.
• PVO: portal vein occlusion.
• RL: right lobe.
• RML: right middle lobe.
• RT-PCR: real-time reverse-transcription polymerase
chain reaction.
• SHAM: sham operation.
• T.Bil: total bilirubin.
• TNF-ααααα: tumor necrosis factor-α.
• TUNEL: terminal deoxynucleotidyl transferase
dUTP nick-end labeling.
CONFLICTS OF INTEREST
The authors declares that there is no conflict of interest regarding the publication of this article.
COMPLIANCE WITH ETHICAL REQUIREMENTS
All institutional and national guidelines for the care and use of laboratory animals were followed.
REFERENCES
1. Nagorney DM, van Heerden JA, Ilstrup DM, Adson MA. Pri-mary hepatic malignancy: surgical management and determi-nants of survival. Surgery 1989; 106: 740-8.
2. Hughes KS, Rosenstein RB, Songhorabodi S, Adson MA, Il-strup DM, Fortner JG, Maclean BJ, et al. Resection of the liver for colorectal carcinoma metastases. A multi-institu-tional study of long-term survivors. Dis Colon Rectum
1988; 31: 1-4.
3. Yasuji S, Masatoshi M. Current surgical treatment for bile duct cancer. World J Gastroenterol 2007; 13: 1505-15. 4. Ueda A, Yoshidome H, Kaqawa S, Greget M, Weber JC,
with portal vein embolization to achieve curative resection for initially unresectable multiple and bilobar colorectal liver metastases.Ann Surg 2004; 240: 1037-49.
5. Azouley D, Castaing D, Smail A, Adam R, Cailliez V, Laurent A, Lemoine A, et al. Resection of nonresectable liver metas-tases from colorectal cancer after percutaneous portal vein embolization.Ann Surg 2000; 231: 480-6.
6. Makuuchi M, Thai BL, Takayasu K, Takayama T, Kosuge T, Gunvén P, Yamazaki S, et al. Preoperative portal emboliza-tion to increase safety of major hepatectomy for hilar bile duct carcinoma: a preliminary report. Surg 1990; 107: 521-7. 7. Di Stefano DR, de Baere T, Denys A, Hakime A, Gorin G, Gil-let M, Saric J, et al. Preoperative percutaneous portal vein embolization: evaluation of adverse events in 188 patients.
Radiology 2005; 234: 625-30.
8. de Santibañes E, Clavien PA. Playing Play-Doh to prevent postoperative liver failure: the “ALPPS” approach. Ann Surg
2012; 255: 415-7.
9. Alvarez FA, Ardiles V, Sanchez Claria R, Pekolj J, de Santi-bañes E. Associating liver partition and portal vein ligation for staged hepatectomy (ALPPS): tips and tricks. J
Gas-trointest Surg 2013; 17: 814-21.
10. Ratti F, Cipriani F, Gagliano A, Catena M, Paganelli M, Ald-righetti L. Defining indications to alpps procedure: technical aspects and open issues. Updates Surg 2014; 66: 41-9. 11. Mikhail S, Cosgrove D, Zeidan A. Hepatocellular carcinoma:
systemic therapies and future perspectives. Expert Rev
An-ticancer Ther 2014; 14: 1205-18.
12 Hwang S, Lee SG, Ko GY, Kim BS, Sung KB, Kim MH, Lee SK, et al. Sequential preoperative ipsilateral hepatic vein em-bolization after portal vein emem-bolization to induce further liv-er regenliv-eration in patients with hepatobiliary malignancy.
Ann Surg 2009; 249: 608-16.
13. Nagano Y, Nagahori K, Kamiyama M, Fujii Y, Kubota T, Endo I, Togo S, et al. Improved functional reserve of hypertrophied contralateral liver after portal vein ligation in rats. J Hepatol
2002; 37: 72-7.
14. Mizuno S, Mimura Y, Suzuki H, Yoshida S. Portal vein branch occlusion induces cell proliferation of cholestatic rat liver. J
Surg Res 1996; 60: 249-57.
15. Morioka D, Tanaka K, Sekido H, Matsuo K, Sugita M, Ueda M, Endo I, et al. Disruption of the middle hepatic vein is not cru-cial for liver regeneration of the remnant liver after right hemihepatectomy for hepatic tumors. Ann Surg Oncol 2006; 13: 1560-8.
16. Michalopoulos GK. Liver regeneration. J Cell Physiol 2007; 213: 286-300.
17. Diehl AM, Yin M, Fleckenstein J, Yang SQ, Lin HZ, Brenner DA, Westwick J, et al. Tumor necrosis factor-alpha induces c-jun during the regenerative response to liver injury. Am J
Physiol 1994; 267: G552-61.
18. Fujiyoshi M, Ozaki M. Molecular mechanisms of liver regener-ation and protection for treatment of liver dysfunction and diseases.J Hepatobiliary Pancreat Sci 2012; 18: 13-22. 19. Pahlavan PS, Feldmann RE Jr, Zavos C, Kountouras J.
Pro-metheus’ challenge: molecular, cellular and systemic aspects of liver regeneration. J Surg Res 2006; 134: 238-51. 20. Taub R. Liver regeneration: from myth to mechanism. Nat
Rev Mol Cell Biol 2004; 5: 836-47.
21. Hsu MK, Qiao L, Ho V, Zhang BH, Zhang H, Teoh N, Dent P, et al. Ethanol reduces p38 kinase activation and cyclin D1 protein expression after partial hepatectomy in rats. J Hepa-tol 2006; 44: 375-82.
22. Fausto N. Liver regeneration. J Hepatol 2000; 32: 19-31. 23. Klune JR, Dhupar R, Cardinal J, Billiar TR, Tsung A. HMGB1:
endogenous danger signaling. Mol Med 2008; 14: 476-84. 24. Sakamoto Y, Inagaki F, Omichi K, Ohkura N, Hasegawa K,
Kokudo N. Associating liver partial partition and transileoce-cal portal vein embolization for staged hepatectomy. Ann Surg 2016; 264: e21-22.
25. Morioka D, Watanabe K, Makino H, Saito S, Ueda M, Kubota T, Sekido H, et al. Safety limit of the extent of hepatectomy for rats with moderately fatty liver: Experimental study con-cerning living liver donor safety. J Gastroenterol Hepatol
2006; 21: 367-73.
26. Yokoyama S, Yokoyama Y, Kawai T, Kobayashi S, Nagino M, Oda K, Nimura Y, et al. Biphasic activation of liver regen-eration-associated signals in an early stage after portal vein branch ligation. Biochem Biophys Res Commun 2006; 349: 732-9.
27. Kobayashi S, Nagino M, Yokoyama Y, Nimura Y, Sokabe M. Evaluation of hepatic interleukin-6 secretion following portal vein ligation using a minimal surgical stress model. J Surgical
Research 2006; 135: 27-33.
Correspondence and reprint request: Itaru Endo, M.D.
Department of Gastroenterological Surgery, Yokohama City University Graduate School of Medicine, 3-9 Fukuura,
Kanazawa-ku, Yokohama, 236-0004, Japan Tel.: +81-457-87-2650. Fax: +81-457-82-9161