Regulation, Concentration and Competition in Financial
Intermediation
*Ernesto Schargrodsky y Federico Sturzenegger Business School,Universidad Torcuato Di Tella
This version: 2 December 1998
Abstract
The strengthening of prudential regulation has, in general, led to increased concentration of the financial sector. While better prudential regulation may deliver a benefit in terms of higher solvency, it is usually understood that more concentration, in general, implies higher spreads. Thus, there is a view that these prudential measures imply a tradeoff between solvency and competition. In this paper we want to argue that such a tradeoff does not necessarily exist. We present a model in which product differentiation decreases with concentration potentially inducing more intense competition, and therefore lower spreads. We provide evidence from a cross section of countries in favor of this alternative view.
1. Introduction
The strengthening of prudential regulation has, in general, led to increased competition of the financial sector. Because more stringent prudential regulation increases the costs of operating in the industry (in turn making some institutions unprofitable), it has induced consolidation in the industry. While better prudential regulation may deliver a benefit in terms of more solvency, it is usually understood that more concentration, in general, implies larger spreads, because with fewer financial institutions the industry becomes less competitive. Thus, there is a view that these prudential measures imply a tradeoff between solvency and competition. We call this the “traditional view” and it has been discussed in much of the banking literature.1 Instead, in this paper we present a model in which product differentiation decreases with concentration, inducing more intense competition rather than less, and potentially, leading to lower spreads.
*
We want to thank Hugo Hopenhayn and Walter Sosa Escudero and participants at UTDT Business School Seminar and the CIF closed Brown-Bag Seminar for useful discussions. We also thank Luciana Esquerro and Juan Ignacio Uro for efficient research assistance and Ernesto Gaba and Thomson BankWatch for providing the banking data used in this paper. The authors thank the Centro de Investigación en Finanzas (CIF) of Universidad Torcuato Di Tella for funding this research.
1
Our challenge to the traditional view is motivated by the recent evolution of the financial sector in Argentina. Figures 1 through 4 give a brief description of some of the most important facts. Starting in 1993 the financial sector has experienced a substantial tightening of prudential regulation.2 Capital requirements were increased, reserve requirements were extended to all bank liabilities (previously CD’s were exempt), contributions to a newly created deposit insurance scheme were instituted, and fees were collected to pay for access to an international line of credit, in case of a run on the domestic financial sector. These measures, together with the financial crisis that followed the Tequila crisis, induced a drastic reduction in the number of banks. While this process was particularly strong during 1995, it continues to date. Yet, in spite of the increase in concentration, financial intermediation margins have also fallen.
An immediate interpretation is that financial intermediation margins may have fallen because the crisis eliminated high-risk institutions, which yielded higher than average returns. However, Figure 1 shows this not to be the case. Figure 1 measures the return to financial intermediation for Argentina’s 20 largest banks. This (monthly) rate of return is calculated as interest plus service income as a fraction of bank assets. The graph shows clearly how margins have decreased over the last five years, dropping from about 11% to about 6% per year. The reduction in margins for the top players in the market motivates a story based on how the regulatory changes may have affected competition among them.
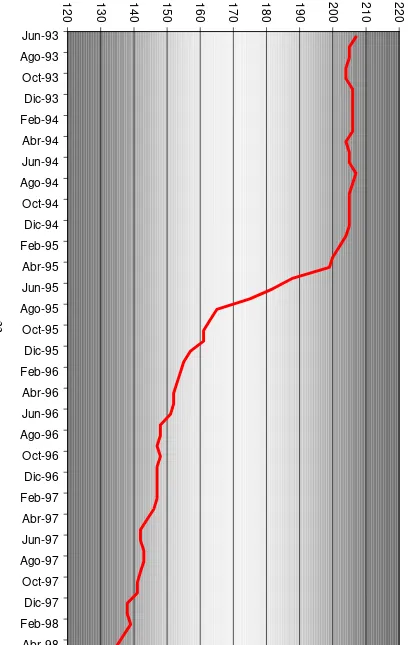
Figure 2, shows how, during the same period, concentration has increased. As can be seen in the graph, the number of institutions fell from 207 in 1993 to 135 in 1998.3 Figure 3 shows how concentration increased as a result. The Herfindahl index for loans (shown) as well as for deposits increased substantially during the period. While there was still a large number of institutions in 1998, the system had consolidated significantly since 1995.
Finally, in Figure 4 we have show how capital requirements have changed during this period. Capital requirements play an important role in our model below. Argentina incorporated Basle Committee on Banking Regulations and Supervisory Practices, with a risk weighted asset/equity ratio as the principal measure of capital adequacy. These requirements, which were the standard 8% by 1993, were increased half a point each six months and finally increased to 11.5% by early 1995, shortly after the Tequila crisis. As of September 1, 1996 additional requirements addressing market risk, including the volatility of securities, foreign currency, equity and derivatives were
2
See Bankwatch (1998) and Sturzenegger (1998). 3
established. Later on, the Central Bank has continued to tighten these requirements.4 In all, these regulatory changes have increased the minimum required capital requirement as shown in Figure 4.
Anecdotal evidence also points in the direction of a financial sector with more concentration and lower margins. In fact, Horacio Chighizola, President of Banco de la Ciudad de Buenos Aires, in assessing the outlook for the financial sector has stated5 Consequently, in the new scenario there will be fewer banks and more competition. Nobody anticipates a traumatic situation but a process of mergers and acquisitions with the incorporation of foreign capitals and the participation of new players strengthening a trend with already begun to manifest itself. (Emphasis added).
All this poses a puzzle for the traditional view. ¿How can it be that a more concentrated financial sector (with fewer banks) can have lower spreads (be more competitive)?
Our model addresses this question. In the model, banks choose the degree of differentiation of their financial services. The higher the degree of differentiation, the higher the price that banks can charge to its customers. Yet, the higher the degree of differentiation, the smaller the client base for whom the bank’s services are appropriate. Consider now a tightening of capital requirements. Because this makes the banking industry less profitable there will be exit from the industry, i.e. concentration increases. We show that in the new equilibrium, the degree of differentiation chosen will be lower, making banks more similar from the viewpoint of the user of financial services. Thus, two forces will be operating upon spreads. The higher degree of concentration will provide firms with larger market power and induce them to charge bigger spreads, however, the lower degree of differentiation forces banks to compete more intensively in prices. We show that, as a result, spreads may either increase or decrease.
In the new equilibrium, local and specialized banks are replaced by fewer banks, more geographically spread and broader in scope. While fewer, they are more similar, and therefore en up competing more directly, and offering lower prices. Concentration, in this setup, may be associated to more competition.
In our model, banks´ solvency is threatened by random shocks. Depending on the magnitude of these shocks, borrowers will be able or not to repay their debts. We will show that the model delivers two results depending on the relative size of these shocks. If they are sufficiently large, and bankruptcy is possible, an increase in capital requirements may induce more competition in the way we have just described.
4
See for example, Com “A”2541 of May 1997. In late 1998 the Central Bank discontinued allowing the use of provisions as a means of integrating the capital requirement (which is commonly accepted by BIS rules and procedures). This will effectively increase the capital requirement an additional percentage point.
5
However, if shocks are small and bankruptcy never occurs, we will show that capital requirements are irrelevant for the competitiveness of the financial sector.
Our empirical work draws on this implication by trying to test whether financial intermediation margins respond differently to changes in the capital requirements in developed economies (presumably with smaller shocks) than in emerging market economies (presumably with larger shocks). We build a three-year panel for 44 countries, and test whether capital requirements have a significant effect on intermediation margins. Consistent with the model, and with the intuition discussed before, we show that for emerging economies capital requirements reduced financial intermediation spreads, and that this effect is statistically significant. For developed economies, we find no effects.
Not only increases in capital requirements are associated to increased concentration of the financial sector. Other examples include the elimination of branching restrictions in the US, or the opening up of the financial sector to foreign investment. In the literature there was a general consensus that increased concentration could lead to less competition in the industry (a point discussed in Mishkin, 1996). In fact, there is ample empirical evidence for industrialized countries, suggesting that spreads increase with the degree of concentration. Gilbert (1984) provides a comprehensive description of these empirical studies.
This traditional view has, however, come under increasing pressure. If concentration is endogenous, then running spreads on concentration will be mispecified. The effects of concentration on spreads will be different if concentration increases due to a decrease in barriers to entry or due to increased market power. Shaffer (1994) considers the new IO empirical literature to take a new look at the relation between market concentration and competition. Using markup tests, she finds that it is difficult to reject the hypothesis of competitive behavior in the banking industry. In fact, Shaffer (1993) finds that the banking sector is competitive in the most concentrated market among 15 developed economies considered.6
For developing economies, the positive relation between concentration and market power, and therefore spreads, has also been questioned. Zahler and Budnevich (1998) present evidence for several Latin American countries, which suggests a negative relationship between these two variables.
Several hypotheses can be suggested to explain this negative relation between banking concentration and spreads. One hypothesis is that increased competition may arise from a reduction in regulatory restrictions that inhibited bank competition. Thus, concentration increases as the result of more intense competition rather than less. Branching restrictions in the US would be a typical example. An alternative story relies, on the contrary, on the potential effects of imposing new regulatory restrictions such as capital requirements. Capital requirements, for example, may reduce the
6
number of financial institutions because they eliminate high-risk institutions. The evidence of Argentina shown below, in which spreads fall even for the largest banks, tends to suggest that this should not be the whole story. Brock and Rojas Suarez (1998) suggest that the result may arise from a change in the risk behavior of banks, induced by the fact that increasing capital requirements reduces the option value of government deposit insurance making the profit function of the banks less convex, and therefore inducing a more cautious approach to risk taking. We believe, again, that this approach should be limited for large and well-established financial institutions. Again, the evidence from Argentina suggests this cannot be the whole story. Thus, in this paper we search for a model that may explain this stylized fact, without relying on changes in risk taking behavior. Thus, we present a model in which product differentiation decreases with concentration inducing more intense competition and potentially, lower spreads.
The paper is organized as follows. Section 2 describes the model. Section 3 discusses the international evidence on the relation between spreads and banking regulation. Section 4 provides some conclusions and some thoughts for future research.
2. The Model
Consider a Salop circular city with a perimeter equal to one, and a unitary density of entrepreneurs located uniformly around the circle. Entrepreneurs have available the possibility of undertaking a common fixed sized project. In order to undertake their projects, entrepreneurs need to borrow resources from financial intermediaries which we will call banks.7 Banks are also located around the circle. Each bank is allowed to locate in only one location. There is free entry into the banking industry but banks are forced by a regulatory body to maintain a capital requirement. Due to limited liability, increasing this capital requirement will increase the cost of operating a financial institution.
The timing of the model is as follows. Given the level of capital requirements, banks decide to enter or not in the industry, and once they have chosen to participate they decide what rate to charge for their loans and the degree by which they will specialize as providers of financial intermediation services. Once banks choose these two characteristics, entrepreneurs choose their bank of preference and loans are provided. After loans have been assigned, banks are also subject to shocks, which may turn some of the assets non-performing. If shocks are severe enough, banks may be forced to
7
draw from the capital requirement to return their deposits. If these funds are not enough they will be forced into bankruptcy.
These shocks capture possible regional or activity specific shocks. If a bank concentrates in a particular line of business, lower prices or lower productivity will make many of his clients insolvent. If a bank concentrates in a particular region, any regional macro shock will also imply a lower rate of repayment.8
The model is built in the framework of the Salop circular city, which implies that entrepreneurs are differentiated on the basis of geographical location. This fits naturally with the intuition of bank branching and regional location of financial institutions. However, we consider our model to be equally applicable to financial institutions that specialize in different sector of activities. In this case location in the circular city will correspond to particular activities and these would be changing smoothly as one moves around the circle.
2.1 Entrepreneurs
Entrepreneurs are located uniformly around the circle. Each entrepreneur has the option of undertaking or not a project of fixed size (without loss of generality we normalize its size to be one). Each entrepreneur needs a financial intermediary in order to obtain the funds to undertake his/her project.9
Consider an entrepreneur l that decides to borrow from bank i which is located at a distance xil from his/her location. Bank i charges a rate of ai for its loans and has a
degree specialization of θi. The return from undertaking the project with this bank will be equal to:
i il i i i
il i
l x a V x a
U (θ , , )= (θ )−θ −
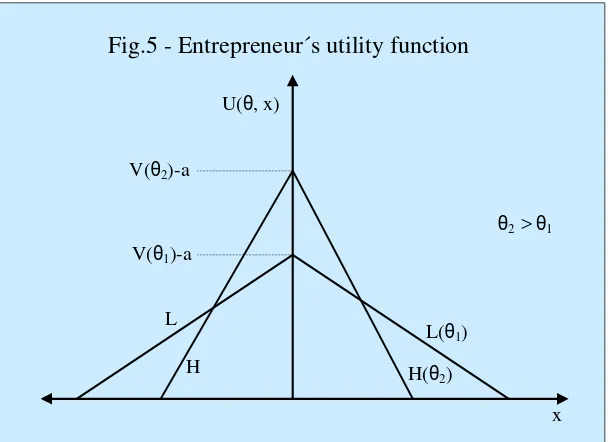
The higher θi, the better will the bank satisfy the needs of the consumers located close to its own location. However, this improved appeal to closer clients implies, that the bank will be a poorer intermediary for entrepreneurs located farther away. Therefore, the utility of entrepreneurs will fall with distance from a bank at a higher rate the larger the degree of specialization chosen by the bank. We also assume that the value of differentiation (the sum of the first two terms) decreases linearly in the distance from the bank. We assume that V(θi) satisfies V´(θi)>0 and V´´(θi)<0, i.e. that there are decreasing returns to specialization.
8
For simplicity we will assume that the shock affects the bank rather than the individual projects, representing a positive interdependence for the individual shocks suffered by entrepreneurs of the same bank.
9
Figure 5 shows the utility of entrepreneurs, describing how it depends on the degree of specialization chosen by the bank. For θ2>θ1, the curve H(θ2) shows the entrepreneur utility obtained when the bank chooses a high degree of specialization, providing high utility for entrepreneurs located close to the bank and very little utility for those located farther away. Conversely, the curve L(θ1) depicts the utility obtained from a bank which chooses a lower level of differentiation. It does not provide such a good service to those located close to its location but at the same time this service does not decrease as quickly with distance from the bank.
Our setup on differentiation captures two possible intuitions. One is that the bank specializes in a certain region, or line of activity, investing resources and building expertise, so that transaction costs, valuation of collateral, determination of product specification, etc. are more efficiently done when the bank operates within this region or with entrepreneurs in this line of business. The higher the degree of specificity in the bank’s activities, the lower the transaction costs for the group of entrepreneurs belonging to the target group of the bank (and therefore the higher their utility) but the lower will it be for those not included in that group. Alternatively, the bank may choose to define a more homogeneous product, which caters to no group in particular, but potentially has a larger market.
An alternative story is that each entrepreneur has a portfolio of investment projects. One is very profitable but very specific to his/her location; the other is a common, less profitable opportunity. Some banks may choose to specialize in financing particular types of projects. This will provide a higher rate of return for entrepreneurs that can finance their specific high return project, but is relatively useless to other entrepreneurs. Conversely, the bank may choose to provide financing for the simpler and more common project. The rate of return is lower, but this financing serves potentially a larger market.
The entrepreneur l chooses the bank that maximizes its utility
{ }
(
,
,
)
max
arg
l i li ii
U
x
a
i
∗=
θ
2.2 Banks
There is free entry into the banking industry. If a bank decides to enter the market, each bank has access to a pool of deposits at an interest cost of p.10 The bank lends at rate ai. Banks, however, not only choose ai, but also have to choose the degree of
specialization θiof their banking services. Jointly, these two variables will shape the demand faced by the bank.
10
Banks are subject to shocks, which turn some of their assets non-performing. These shocks are described by a uniform distribution ~ U
[ ]
0, Si
s . If the bank does not generate enough revenues from its assets to pay for deposits it has to use up its own capital to repay them. If these are not enough, the bank is declared bankrupt and the deposit insurance scheme takes responsibility for the residual fraction of depositors yet unpaid.
The government sets a minimum amount of capital that banks have to commit in order to participate in the banking industry. We do not model here why the government wants to impose these capital requirements, but given limited liability banks will find convenient to transfer as much of the losses in unfavorable states of nature to the deposit insurer by choosing low levels of capitalization. If there are social bankruptcy costs, the government may have an incentive to reduce this incentive by imposing a minimum level of capital.
We denote this requirement by K, and we assume that its opportunity cost is precisely the passive rate p. Because no other restriction is imposed on the use of this capital requirement, banks will obviously choose to lend this capital requirement. Banks earning will then equal
Where di indicates the demand (total amount of loans) faced by the bank. The bank’s
profits equal the return on its loans (1+ai)di, minus the opportunity cost of its funds
(that is, the passive rate p, applied both to deposits (di-K) and to the banks own capital
K). Finally, the shock faced by the bank also has to be subtracted. This reduces to the markup on lending minus the shock, as in the last equality above.
These will be the bank’s profits as long as it has the resources to pay depositors. This will be the case as long as revenues are larger than its debt, i.e. as long as:
This condition reduces to
If this condition is not satisfied the bank is declared bankrupt and the bank loses its capital requirement plus the opportunity cost of having invested those resources in the banking activity, i.e. K(1+p).
[
−]
+ − + − =−
+ ai)di(ai,a−i, i, −i) di(ai,a−i, i, −i) K (1 p) K (1 p) si
1
( θ θ θ θ
[
( , , , )]
(1 )) , , , ( ) 1
( +ai di ai a−i θi θ−i −s< d ai a−i θi θ−i −K + p
s p K a
a d p
ai − ) i( i, −i, i, −i)+ (1+ )>
( θ θ
i i
i i i i
i a a a p s
d − −
The profit of bank i function can be written then as: < + + − > + + − + − − − = − − − − − − s K p a a d p a s K p a a d p a if p K s a a d p a i i i i i i i i i i i i i i i i i i ) 1 ( ) , , , ( ) ( ) 1 ( ) , , , ( ) ( ) 1 ( ) , , , ( ) ( θ θ θ θ θ θ
π , (1)
The profit function is depicted in figure 6, which shows how profits decrease as the size of the shock increases. The convexity of the profit function is the result of the assumption of limited liability. Thus, in our setup, banks would prefer to finance all their lending with deposits. It is the regulation that prevents them from doing so. We will see below that the regulation imposes a cost, which keeps the number of financial institutions bound.
Within this setup we have to consider two possible scenarios. As specified in (1) and dropping the subscripts, a bank will go bankrupt if the shock faced is larger than d(a-p)+(1+p)K. Thus bankruptcy can arise if d(a−p)+(1+p)K <S, i.e. when capital requirements are small relative to the potential shocks faced by the financial sector. In this case the profit function of a financial institution can be written as:
ds
S
p
K
ds
S
s
p
a
d
S K p p a d K p p a d∫
∫
− + + + + −
−
+
+
−
−
=
) 1 ( ) ( ) 1 ( ) ( 0)
1
(
1
)
)
(
(
π
(2)However, it may be the case that shocks in the economy are so small relative to the capital requirement that no bank ever goes bankrupt. In this case the profit function reduces to the upper half of equation (1), i.e. profits will be equal to:
2
)
(
1
)
)
(
(
0S
p
a
d
ds
S
s
p
a
d
S−
−
=
−
−
=
∫
π
(2´)Whether banks solve their optimization problem using (2) or (2´) depends on whether condition d(a−p)+(1+p)K <S is satisfied. As stated, however, this depends on endogenous variables such as d and a. The appendix shows, however, that a necessary and sufficient condition for banks to use (2´) is that
2 ) 1
( p S
K + ≥ . On the contrary when
2 ) 1
( p S
K + ≤ , (2) should be used.
2.3 The large-shock economy
In order to maximize profits banks will have to determine how, if they decide to enter the market, their choice of ai and θi affects their demand. Consider an entrepreneur located between banks i and j. If the distance to bank i is xˆ and the total number of banks is n, the distance to bank j will equal 1/n-xˆ , because the distance between the two banks in a symmetric equilibrium will equal 1/n. Figure 7, depicts the situation. The entrepreneur will be indifferent between using bank i and bank j if both give him the same utility level:
j j
j i
i
i x a
n V
a x
V −
− − = −
− ˆ ( ) 1 ˆ
)
(θ θ θ θ .
Thus, bank i will provide loans to all entrepreneurs located from its location through xˆ :
j i j j i j i n a a V V x θ θ θ θ θ + + + − − = ) ( ) ( ˆ .
Using symmetry, total demand for bank i is twice that amount:
+ + + − − = = j i j j i j i n a a V V x d θ θ θ θ θ ) ( ) ( 2 ˆ
2 . (3)
Banks substitute (3) in (2) and maximize respect to θi and ai. The appendix shows that the first order conditions in a symmetric equilibrium can be reduced to:
n p a * θ + = ∗ (4) and n V 2 1 )
´(θ∗ = (5)
These results say that the interest rate charged by the bank will equal the bank’s borrowing rate, plus a mark-up which is increasing in the degree of concentration. Notice, however, that the markup is increasing in the degree of specialization θi. In turn, equation (5), indicates that the choice of differentiation also depends on the degree of concentration. In fact, the fewer the number of firms, the lower the degree of differentiation chosen by the bank because V´´(θ)<0. Thus, it is not clear how the spreads will move as the number of firms changes.
In order to close the model we substitute from (4) and (5) into (2). Equilibrium profits are equal to:
Using the free entry condition which forces banks profits to be equal to zero we find that for the only real positive root the equilibrium number of banks is equal to:
θ ) 1 ( 2
) 1 (
2 1
p K S
K p S n
+ −
+ + =
∗ (6)
Jointly with (4) and (5), equation (6) completes a system of three equation with three unknowns: a, n and θ.
Recall that in order to obtain (4), (5) and (6) we used a profit function under the assumption that S >d∗(a∗ −p)+K, i.e. that bankruptcy was possible. In the symmetric Nash equilibrium this condition reduces to:
The appendix shows that this condition will hold as long as
2 ) 1
( p S
K + < . Thus, the above case is relevant if the capital requirements are small relative to the shocks in the economy, i.e. in the large-shock economy.
2.4 Small-shock economy
Banks may believe that shocks are not sufficiently large and therefore may think it is appropriate to use equation (2´) rather than (2). In this case upon solving for the optimization
S K n
< +
2 *
*
θ
S n
p Kn
p S Kn p
n K
4
* 2 4
2 4
2 *
2
) 1 ( 2
) 1 ( 2 ) 1
( + − + + + + ∗2
= θ θ
problem we obtain that in the symmetric Nash equilibrium, a* and θ* are also defined by (4) and (5). Substituting in (2´) the equilibrium profits are now:
giving an equilibrium number of banks:
(6´)
Equation (2´) must be used if S <d∗(a∗− p)+K. The appendix shows that substituting for (4), (5) and (6´) into (2´), that this condition will be satisfied as long as
2 ) 1
( p S
K + ≥ . Thus, if capital requirements are sufficiently large we will be placed in the small shock economy.
2.5 The effects of capital requirements
Because our main focus is on the effects of capital requirement regulation we are interested in the comparative static of equations (4), (5) and (6) for the large-shocks economy and (4), (5) and (6´) for the small-shock economy, with respect to K.
Notice that for the small-shock economy, capital requirements cannot have any effect on the equilibrium as the system (4), (5) and (6´) because neither of these equations depends on K. We concentrate on the more interesting case of an economy with large-shocks. Differentiating the system (4), (5) and (6) and evaluating it at the optimum we have:
dK A dn da d n n n n V = − − 0 0 1 0 2 1 1 2 1 0 ) ´´( * * 2 * * * 2 * * θ θ θ θ where
[
]
[
]
+ − + − + + + + − = 2 1 ) 1 ( 2 2 1 ) 1 ( 2 ) 1 ( ) 1 ( 2 1 ) 1 ( 22 K p
S K p K S p p K S p K S n A θ S n * * = 2θ
which can be shown to be negative as long as
2 ) 1
( p S
K + < .
The Jacobian can be reduced to
θ θ θ
2 ) ´( ) ´´( V
V
J = +
which, under our assumption of V´´(θ)θ/V´(θ)<-1/2, is negative. Solving for the individual effects we have that:
0 ) ´´(
< =
J A V
dK
dn θ
0 2 2 <
− =
n J
A dK
dθ
+
− =
) ´(
) ´´( 1
) ´(
2 θ
θ θ θ
V V Jn
AV dK
da
[image:13.612.183.454.424.577.2]Thus, our results are summarized in Table 1.
Table 1
1 2
1 > >−
− ε ε <−1
dK
dn
Negative
Negative
dK
dθ
Negative
Negative
dK
da
Negative
Positive
The effect of an increase of the capital requirement on the spreads of the financial sector is, however, ambiguous. On the one hand, an increase in the capital requirements reduces the number of banks increasing a* in (4). On the other hand, it reduces the level of product specialization rendering a reduction of a* (see also (4)). Which of these effects predominates depends on the elasticity of the marginal value of product specialization. When this elasticity is large in absolute value, then the traditional result holds. Instead, for small values, an increase in capital requirement induces a reduction in spreads.
2.6. Solvency
The motivation for imposing capital requirements arises from the need to improve the solvency of the financial sector. With limited liability, banks prefer to have no capital requirements and to have the government bail them out through the deposit insurance scheme.
In the specification of the model we can assess the effect of K on banks´ solvency. The probability of bankruptcy is given by:
Which, given the uniform distribution assumed for the shocks, reduces to:
For
2 ) 1
( p S
K + < it is easy to show that this probability decreases in K. Thus, as expected, the system becomes more solvent as the capital requirement increases.
3. Empirics
The model predicts that the level of capital requirements have no effect on spreads in economies in which shocks are (relatively) small, but that they do affect spreads when shocks are (relatively) large. For large-shock economies, the sign of this effect is theoretically ambiguous. We analyze these predictions considering the effect of capital
requirements on spreads for a panel of 44 countries11 from 1995 to 1997 (120 country-year observations) by running the following reduced-form fixed-effect regression:
where for country i in period t, bank real spreads (Spreads) are a function of the level of the capital requirements (Kapreq), country-fixed effects (Γ) and the controls. As controls we include several variables that possibly influence bank spreads: GDP per capita (GDPcap) may capture the effect of the level of economic development and wealth, GDP growth (Growth) captures business cycle effects, inflation (Inflat) controls for the effect of inflation on real spreads, liquidity (Liquid) proxies for the effect of liquidity requirements, inefficiency (Ineff) controls for bank costs, and risk (Risk) considers the effect of country risk on spreads. Appendix 2 describes the data definitions and data sources.
Table 2 presents our results. In Column A, when considering a similar effect of capital requirements on spreads both for developed and developing countries, we find no significant effect. However, the model predicts that capital requirements affect spreads only when shocks are relatively large and bankruptcy is possible. For the empirical analysis, we map these different shock sizes (large shock vs. small shock economies) as a difference between developed and under-developed economies. The latter group includes economies which suffer relatively large shocks (have a large S in the model terms) while developed economies suffer shocks which are relatively smaller. In Column B, we allow the capital requirement coefficient to differ for developed and under-developed economies. The results show that capital requirements have no effect on spreads for developed countries, while they have a negative effect for underdeveloped countries. These results are in line with the predictions of our model and with the facts described in the Argentine experience.
Surprisingly, the results in Column B suggest that the degree of country uncertainty has a negative (although non-significant) effect on bank spreads. We suspect that this anomalous result is driven by the late Southeast Asia experience, where due to nominal interest rate regulation, the recent increase in country risks has been accompanied by a reduction in real interest rates. We allow the effect of country risk to differ for the Asian countries in our sample. When allowing the effect of risk to be different for Asian countries, in these countries risk has a negative and significant effect. For the rest of the countries the effect is positive and non-significant. The
11
The countries in our sample are Argentina, Bolivia, Brazil, Colombia, Chile, Ecuador, Mexico, Paraguay, Peru, Uruguay, Korea, Philippines, India, Indonesia, Malaysia, Singapore, Thailand, Hungary, Poland, Russia, Turkey, South Africa, Israel, Germany, Australia, Austria, Belgium, Canada, Denmark, Spain, Finland, France, Greek, Netherlands, Ireland, Iceland, Italy, Luxembourg, Norway, New Zealand, Portugal, United Kingdom, Sweden and Switzerland.
+
+
+
+
Γ
=
i it it itt
i
Kapreq
GDPcap
Growth
Spreads
,β
1 ,β
2 ,β
3 ,t i t i t
i t
i t
i Liquid Ineff Risk
Inflat , 5 , 6 , 7 , ,
4 β β β µ
results in Column C, confirm the finding of a negative and significative coefficient for the capital requirement variable. The results also show a negative effect for GDP growth and inflation and a positive effect for bank inefficiency.
4. Conclusions
There has been relatively little work on the relation between bank regulation and market structure. However, the counterintuitive effects of certain regulations, as the case of Argentina and cross-country evidence shows, suggests that these effects may be important. In this paper we build a model which accounts for these facts: tighter regulation implies more concentration of the financial sector but generates more similarity between institutions, leading to more intense competition in spite of higher concentration.
The model suggests that capital requirements may not necessarily be costly, because they lead simultaneously to a more solvent and a more competitive financial sector. Obviously, one should be cautious when moving from the model to reality. First of all, our model has an ambiguous policy implication: spreads could go up or down with concentration. It is obvious that once firms decrease to the point that only one remains, our result will not hold any longer (remember that they were derived assuming at least two banks). Depending on the functional specification it is possible that as the number of banks decrease, we move into the region where spreads increase with regulation. Thus, our result that there is no tradeoff between solvency and competition may disappear even with a relatively large number of banks.
The specification can be extended in several ways. For example, we need to discuss the links between different regulations. Our model goes through with full credible deposit insurance. Once we lift this assumption depositor’s behavior will have to be taken into account. Similarly we must enrich the model from the borrower side. If there are risky and not so risky borrowers, then capital requirements may affect the risk composition of bank portfolios (a point stressed by Brock and Rojas Suarez, 1998).
References
Ahumada, Hildegard, Tamara Burdisso, Juan Pablo Nicolini and Andrew Powell (1998), “Los Spreads de Tasas de Interés en Argentina”, Mimeo Universidad Torcuato Di Tella. Bankwatch, “Banking System Report”, Argentina, published in BankWatch, Banking System Report. March 1998.
Besanko, D. and A. Thakor (1992) “Banking deregulation: Allocational consequences of relaxing entry barriers”, Journal of Bnaking and Finance, Vol. 16, pp. 909-932.
Brock, Philip and Liliana Rojas Suarez (1998), “Understanding the Behavior of Interest Rates and Bank Spreads in Latin America, Mimeo, IDB.
Chighizola, Horacio (1998) “The Financial System and the Mercosur in Perspective”, address given at World Economic Forum in Buenos Aires, July 1998.
Freixas, Xavier and Jean-Charles Rochet (1998) Microeconomics of Banking, Cambridge: MIT Press.
Gilbert, Alton (1984) “Bank Market Structure and Competition”, Journal of Money, Credit and Banking, Vol. 16, No. 4 (November, Part 2), pp. 617-645.
Mishkin, Frederic (1996) “Bank Consolidation: A Central Banker´s Perspective”, NBER Working Paper No. 5849.
Shaffer, Sherrill (1993) “Market Conduct and Excess Capacity in Banking: A Cross-Country Comparison” Working Paper 93-28, Federal Reserve Bank of Philadelphia.
Shaffer, Sherrill (1994) “Bank Competition in Concentrated Markets” in Business Review, March/April.
Sturzenegger, Federico (1998) “Argentina´s Experience with Capital Flows in the 90´s.” Mimeo Universidad Torcuato Di Tella.
Yellen, Janet (1995) Statement before the Subcommittee on Financial Institutions and Consumer Credit of the Committee on Banking and Financial Services, US House of Representatives, October 17, 1995. Published in Federal Reserve Bulletin, December pp. 1093-1102.
Appendix 1
Assuming symmetry, the first order conditions obtained from maximizing (2) with respect to i
θ and ai give:
(
)(
)
02 = − − − + − = ∂ ∂ S n np n a p Kn a a i i i i i θ θ π (A.1)
(
)(
)(
)
0.2 ) ´( 2 1 2 = + − − + − = ∂ ∂ S n nV p Kn a p a i i i i i θ θ θ π (A.2)
Equation (A.1) has two solutions. However one gives an active rate lower than the passive rate. Thus the correct solution is the one shown in (4). Similarly in (A.2), using the appropriate solution to (A.1) gives the solution shown in (5).
In order to show second order conditions we differentiate the profit function twice with respect to θi and ai, which gives under symmetry and in the optimum:
[
]
04 ) ´´( ) ( 4 )) ´( ( 4 ) ´( ) 2 ( 4 3 2 4 2 2 2 3 2 2 2 < + + + + − + = ∂ ∂ θ θ θ θ θ θ θ θ θ θ π S n V Kn n V n V n Kn Kn 0 ) ( 2 2 2 2 2 < + − = ∂ ∂ θ θ π S n Kn a
The Hessian can be shown to equal:
(
)(
)
+ + − + + + + + − = = ∂ ∂ ∂ − ∂ ∂ ∂ ∂ = 2 2 6 2 2 2 4 3 2 2 2 2 2 2 2 2 . . 2 ) ´´( ). . ( . 4 )) ´( ).( . 3 . ( 2 ) ´( ). . 2 . ( 4 3 . 2 . θ θ θ θ θ θ θ θ θ θ θ π π θ π S n V n K n V n n K V n n K n K n K a a HAppendix 2
Variable Definition Source
Spreads Net Interest Income/Average Earning Assets* Thomson BankStat Kapreq Capital Requirements: Shareholders’ Equity
divided by Total Loans*
Thomson BankStat
GDPcap GDP per capita (in U$S dollars) IMF
Growth Rate of real GDP growth IMF, Goldman Sachs and
Thomson BankWatch Inflat Inflation: annual growth rate of consumer price
index
IMF Liq Liquidity: Liquid Assets divided by Total
Deposits*
Thomson BankStat
Ineff Inefficiency: Non-interest Expenses divided by Operating Income*
Thomson BankStat
Risk Numerical conversion of sovereign credit rate given by credit rating agencies: 1 corresponds to the worst rate found for the countries in the sample (C) and 17 corresponds to the highest rate (AAA)
Thomson BankStat
Non-Developed
Dummy=1 for Argentina, Bolivia, Brazil, Colombia, Chile, Ecuador, Mexico, Paraguay, Peru, Uruguay, Korea, Philippines, India, Indonesia, Malaysia, Singapore, Thailand, Hungary, Poland, Russia, Turkey, South Africa and Israel, =0 otherwise
Asian Dummy=1 for Korea, Philippines, India, Indonesia, Malaysia, Singapore, and Thailand, =0 otherwise
Table 2
Dependent Variable: Spreads
Variables (A) (B) (C)
Capital requirement -0.17095 (-1.401)
0.08788 (1.552)
0.04032 (0.425) Capital requirement *
Underdeveloped
-0.35150*** (-2.663)
-0.30042** (-2.038)
GDPcap 2.38e-08
(0.051)
1.83e-07 (0.422)
3.48e-07 (0.831)
Growth -0.12536*
(-1.673)
-0.14749* (-1.989)
-0.12214* (-1.808)
Inflation -0.03768
(-1.463)
-0.04410* (-1.770)
-0.04834** (-2.018)
Liquidity 0.00782
(0.644)
0.01086 (0.963)
0.00216 (0.192)
Inefficiency 0.01361
(1.587)
0.01053 (1.236)
0.01884** (2.230)
Risk -0.00142
(-0.821)
-0.00160 (-0.900)
0.00761 (1.454)
Risk*Asian dummy -0.01127**
(2.087)
Country-fixed effects YES YES YES
Observations 120 120 120
R2 0.9426 0.9458 0.9508
White robust t-statistics in parentheses. * Significant at the 10% level
Fig. 1 - Financial intermediation margin
0.40% 0.50% 0.60% 0.70% 0.80% 0.90% 1.00%
22
Fig. 2 - Number of Banks
120 130 140 150 160 170 180 190 200 210 220
23
Fig. 3 - Deposit Concentration
48.0% 49.0% 50.0% 51.0% 52.0% 53.0% 54.0% 55.0% 56.0% 57.0% 58.0%
Jun-93 Ago-93 Oct-93
Dic-93 Feb-94 Abr-94 Jun-94 Ago-94 Oct-94
Dic-94 Feb-95 Abr-95 Jun-95 Ago-95 Oct-95
Dic-95 Feb-96 Abr-96 Jun-96 Ago-96 Oct-96
Dic-96 Feb-97 Abr-97 Jun-97 Ago-97 Oct-97
24
Fig.4 - Capital requirements
10.0% 10.5% 11.0% 11.5% 12.0% 12.5%
H
H(
θ
2
)
L
L(
θ
1)
U(
θ
, x)
x
V(
θ
2)-a
θ
2>
θ
1 [image:25.792.95.705.98.540.2]V(
θ
1)-a
Fig. 6 - The Profit Function
S
d.(a-p)
-K(1+p)
1
S S2