Ten years of harmonic and flicker control by IEC normalised measurements in Buenos Aires distribution system
Texto completo
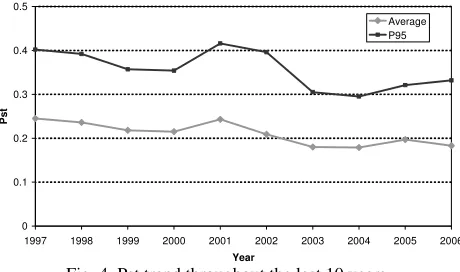
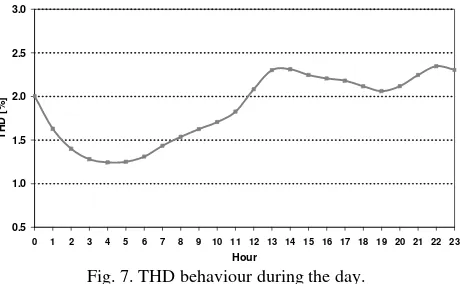
Figure


Documento similar
These magnetization values, found for Pd-NR 4 共C12兲 at 5 K, are similar to those obtained for all of the temperature range for the Pd-SR1 sample, in which there are covalent
In the Unites States, where these studies are done cyclically, results of the last survey conducted in 2003 shows that the average of free time of an American is of five hours,
But not only the internal components of the data-driven ecosystem are beneficed by the GraphQL approach; external components (whose data requirements are out of
We evaluate the performance of the system by comparison with a manually annotated Gold Standard, obtaining results that are comparable, if not better, to machine learning approaches
Studies assessing the effects of BGs in individuals who are likely to develop metabolic syndrome are fre- quent 16-18 , but the evidence of consuming these fibres to
(c) Topological preservation: the main feature of SOMs is that they map data points that are close in the input space (neighbours) to neurons that are close in the SOM
We want to follow the proof of the existence of Delaunay surfaces given in the previous section in order to prove the existence of a smooth family of normal graphs over the
The purpose of these notes is to provide an introduction to those who want to learn more about translating solitons for the mean curvature flow in R 3 , particularly those which
