(Annals of the Brazilian Academy of Sciences) ISSN 0001-3765
www.scielo.br/aabc
Summer feeding ecology of Great Pampa-finches,
Embernagra platensis
at Laguna de Guaminí, Buenos Aires, Argentina
LAURA M. FERMAN and DIEGO MONTALTI
Department of Ornithology, Museo de Ciencias Naturales de La Plata Paseo del Bosque, B1900FWA, La Plata, Argentina
Manuscript received on January 10, 2008; accepted for publication on May 12, 2010
ABSTRACT
The aim of this study was to assemble data on the summer feeding ecology of the Great Pampa-finch,Embernagra platensisat the Laguna de Guaminí, Buenos Aires, Argentina, and to explore the differences related to the dietary patterns for each sex between winter and summer when possible. The stomach contents of 43 birds were analyzed. The animal fraction was composed of Hymenoptera (45.1%), Coleoptera (32.4%), Lepidoptera (6.0%), Araneae (5%) and Orthoptera (3.2%). The application of the index of relative importance (IRI) resulted in 1490.4 for Coleoptera, 428.5 for Hymenoptera and 162.5 for Lepidoptera caterpillars. The vegetal fraction consisted ofTriticum aestivum(26.9%), Cyperaceous (25%), Poaceae (Gramineae) (19.3%) andPanicumsp. (11.2%). The IRI values were 893.8 forTriticum aestivum, 174.5 for Gramineae, 126.5 forPanicumsp. and 112.8 forScirpussp. The food niche width was 0.33 for both sexes; the diversity index resulted in 1.06 for females and 1.33 for males and specific diversity ranged from 1.87 to 2.84. A canonical component analysis (CCA) was performed on environmental and morphometric variables, and a Monte Carlo test confirmed the canonical correlations. A t-test showed that some birds harmonized with a logarithmic model and some with a geometric curve. During the summer,Embernagra platensisingests Hymenoptera and Coleoptera more often than seeds, suggesting that two biological mechanisms could be taking place in this bird.
Key words:Argentina,Embernagra platensis, feeding ecology, Great Pampa-finch.
INTRODUCTION
The Great Pampa-finch,Embernagra platensis, belongs to the Emberizinae finches, distributed from the south-east Brazil (north of Minas Gerais to Espírito Santo), through most of Paraguay (local in the dry Chaco), north-west Bolivia (north to Beni), and Uruguay, to central and south Argentina (Misiones, Formosa, Chaco, Santa Fé, La Pampa and Río Negro (Short 1975, Ridgely and Tudor 1989)).
It inhabits open grasslands, often with scattered shrubs, and can fairly frequently be seen flying along and over roadsides, although some prefer damp places. They form pairs or small groups, are territorial and con-sistently sing while perched on the top of bushes and fence posts (Ridgely and Tudor 1989, Hayes 2003).
Correspondence to: D. Montalti E-mail: dmontalti@arnet.com.ar
the summer, compare its diet between seasons and sexes at the Laguna de Guaminí, Province of Buenos Aires, Argentina.
METHODS
STUDYAREA
This research was carried out in the area of the Laguna de Guaminí (37◦1′60S, 62◦25′0W), near the neighbor-ing city of Guaminí, in the Province of Buenos Aires, which is part of the biogeographical province of Pampa. The dominant climate is temperate semiarid, with ther-mal fluctuations ranging from 15.2◦C to 7◦C. The
vege-tation arrangement corresponds to an herbaceous steppe or sub-steppe. Natural grasslands have been reduced and replaced by annual crops. The winter harvest in-cludes oat, wheat, and rye, while the summer crops are of sunflower, corn, soy and sorghum.
STOMACHSAMPLES
Great Pampa-finches at the Laguna de Guaminí were collected (N=43) with the permission of the Dirección Provincial de Recursos Naturales de la Provincia de Buenos Aires in December 1997. Birds were sexed, measured, weighed and promptly frozen. The stom-ach contents were collected in numbered plastic bags; the samples were processed to avoid stomach decom-position and, then, transferred into glass containers and preserved in 70% ethyl alcohol. The minimum number of prey individuals in each stomach sample was deter-mined using diagnostic fragments, such as head cap-sules, caterpillar mandibles, elytra and wings (Yard and Blake 2002). Insect determination was carried out us-ing the classifications by Merrit and Cummins (1978) and Kusnezov (1978). The systematic determination of plant species was made following Cronquist (1993). The minimum sample was calculated using the collect-ed stomachs (representcollect-ed by each individual) and taxa (prey items).
STATISTICALANALYSIS
In this study, the relationship between prey item vari-ables and the variation explained by morphometric mea-surement variables (environmental variables) was exam-ined. The association among birds (sample variables), items consumed by the species (species variables) and
morphometric measurements (environmental variables) of birds were also analyzed. All data were combined in a matrix. The associations between sets of two vari-ables were investigated performing a canonical correla-tion analysis (CCA) using the Canoco statistical soft-ware.
In order to compare diet patterns through the diver-sity index among groups from different seasons, statis-tical tests were carried out using SYSTAT 7.0. When running the program, we operated with groups of birds collected in each season as “different communities”, and prey species items were named by taxonomical category. We worked with four sets of data named from ‘C1’ to ‘C4’, and with the abundances of prey items. In the analysis, ‘C1’ refers to summer males, ‘C2’ to summer females, ‘C3’ to winter males, and ‘C4’ to winter fe-males (Montalti et al. 2005).
The abundance range hypothetical model method was used to determine whether the real data fit the hypo-thetical model curves of richness-abundance. The model curves tried were logarithmic, geometric and broken stick shaped. The analysis evaluates and compares bio-diversity community rates. We worked with ‘C1’ to ‘C4’ and proposed hypothetical curves for each community using SYSTAT 7.0.
The food niche breadth (FNB) was calculated using Levins’ index (Levins 1968, Krebs 1989), as 1/(Ppi2),
where pi is the proportion of prey i in the diet. A
standardized food niche breadth value (FNBst) was cal-culated, as(F N B −1)/(n −1), where n is the total number of prey categories (Colwell and Futuyma 1971). Lower values of Levins’ index indicate relatively more specialized species, whereas higher values indicate more generalized ones (Krebs 1989).
The importance relative index (IRI) was used to es-tablish prey contribution to diet composition. The H’ in-dex (Shannon and Weaver 1949) was calculated between seasons and sexes, and at-test was also used in order to compare the differences in diversity indices among the communities mentioned above.
RESULTS
the food (g) eaten by the Great Pampa-finch consisted primarily of arthropods (83%) and seeds (17%). Ta-ble I shows the arthropod fraction consumed in terms of importance by number (N) and by frequency of oc-currence (F). The reported insects were Hymenoptera (Formicidae), 45.1%; Coleoptera (Curculionidae, Cara-bidae), 32.4%; Lepidoptera caterpillars, 6%; Araneae, 5%; and Orthoptera, 3.2%. In the Hymenoptera, Formi-cidae fraction, we distinguished leaf-cutter ants, winged reproductive individuals and small red-colored ants.
Insect length ranged from 5.5 mm in Curculion-idae and FormicCurculion-idae to 30 mm in Lepidoptera caterpil-lars. The resultant IRI for the arthropod fraction was 1490.4 (149%) for Coleoptera, 428.5 (42.85%) for Hy-menoptera, and 162.5 (16.25%) was represented by Lepidoptera caterpillars.
Table II shows the plant species ingested by num-ber and frequency of occurrence. Seeds wereTriticum
sp. (26.9%),Scirpussp. (25.1%), Poaceae (Gramineae, 19.3%) and Panicum sp. (11.2%). Seed size ranged from 1 mm inChenopodiumsp. to 7 mm in Triticum aestivum. The IRI for the vegetal fraction resulted in 893.8 (89.38%) forTriticum aestivum, 174.5 (17.45%) for Poaceae (Gramineae), 126.5 (12.65%) forPanicum
sp., and 112.8 (11.28%) forScirpussp.
The trophic spectrum based on the identification of 507 items was integrated by 41 taxa (9 plants and 32 insects) and the standard FNB resulted in 0.33 for the summer period. Gastroliths (5 samples) ranged be-tween 1 and 2 mm.
The mean stomach sample was 0.57g (SD±0.21) and it ranged from 0.16 g to 1.36 g, representing ca.
1.36% of the body mass. The mean body mass was 41.7 g, and the mean number of items was 12 per stom-ach per bird for the summer.
The H’ index was 2.24 for males and 1.94 for fe-males during the summer. The diversity index was 1.08 for males and 1.5 for females during the winter, and there was no difference between these seasons.
Table III shows in the CCA analysis that the second components contemplate about 71% of the information among variables, meaning that the samples (birds) corre-late with environmental variables (morphometrics). The Monte Carlo test supports the CCA analysis with a test of significance of the first canonical axis (eigen-value)
TABLE I
Insect species by number (N) and frequency (F) of occurrence consumed byEmbernagra platensisduring the summer
at the Laguna de Guaminí.
Insect species N N% F F%
LEPIDOPTERA
Caterpillars 17 5.98 8 18.60
COLEOPTERA
Curculionidae 41 14.43 16 32.20
Lucanidae 1 0.35 1 2.32
Tenebrionidae 2 0.70 2 4.65
Buprestidae 6 2.11 3 6.97
Carabidae 32 11.26 20 46.51
*Undeterm. Coleoptera 10 3.52 8 18.60 HEMIPTERA
Belostomatidae 1 0.35 1 2.32
Cicadellidae 1 0.35 1 2.32
*Undeterm. Hemiptera 5 1.76 5 11.62
HETEROPTERA
Pentotomidae 1 0.35 1 2.32
DICTIOPTERA Blattidae
Periplaneta americana 1 0.35 1 2.32 Mantoidea
Mantis religiosa 2 0.70 1 2.32
ORTOPTERA
SubO. Ensifera 2 0.70 2 4.65
SubO. Celifera 4 1.41 3 6.97
*Undeterm. Orthoptera 3 1.05 3 6.97 HYMENOPTERA
*Formicidae 120 42.25 12 28.0
Undeterm. Formicidae 4 1.41 4 9.30
Apidae 2 0.70 2 4.65
Vespidae 1 0.35 1 2.32
Symphytasp. 1 0.35 1 2.32
ODONATA
SubO. Anisoptera 3 1.05 2 4.65
*Undeterm. Odonata 2 0.70 2 4.65
DERMAPTERA
Forciculasp. 1 0.35 1 2.32 DIPTERA
Brachicera Muscidae
Muscasp. 2 0.70 2 4.65
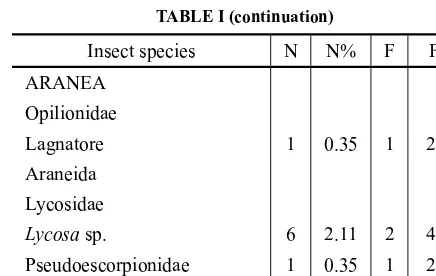
TABLE I (continuation)
Insect species N N% F F%
ARANEA Opilionidae
Lagnatore 1 0.35 1 2.32
Araneida Lycosidae
Lycosasp. 6 2.11 2 4.65
Pseudoescorpionidae 1 0.35 1 2.32 *Undeterm. Araneida 6 2.11 6 13.95
Undeterm. =undetermined fraction due to decomposition. We used body structures for classification. Total number of insects=284. Total stomach contents=43. *Formicidae (Attasp.,Solenopsis saevissima, Acromyrmex lundiandAcromirmex striatum).
TABLE II
Plant species number (N) and frequency (F) of occurrence consumed byEmbernagra platensisduring the summer
at the Laguna de Guaminí.
Plant species N N% F F%
DICOTYLEDONEAE CHENOPODIACEA
Chenopodiumsp. 16 7.17 3 6.97 MONOCOTYLEDONEAE
Cyperaceae
Scirpussp. 56 25.11 2 4.65 POACEAE (Gramineae) 43 19.28 4 9.30
Triticum aestivum 60 26.90 14 32.55
Paspalumsp. 14 6.27 2 4.65
Panicumsp. 25 11.21 5 11.62
Leptochloasp. 2 0.89 2 4.65
Schizochinumsp. 1 0.44 1 2.32 * Undeterm. Plants 6 2.69 6 13.95
*Undeterm. =undetermined fraction due to deterioration, material that was weighed and contributed to the diet but that couldn’t be clas-sified as a plant gender or species. Total number of plants=223.
of about 0.016 (F-ratio = 42.287; P-value = 0.002). The test of significance of all canonical axes (trace) was 0.041 (F-ratio =139.205; P-value=0.002). The first two canonical correlations were significant, representing a good association between the two sets of variables.
The t-test for the abundance range hypothetical model curves showed that ‘C1’ (summer males) and ‘C3’ (winter males) paired better with the logarithmic model curve (p=0.45, df=8; p=0.30, df=10). On the other
hand, ‘C2’ (summer females), and ‘C4’ (winter females) paired better with the geometric curve (p=2.5×10⁶; p=5.2±106). During the summer, ‘C1’ (males) con-sumed 393 preys of 21 species; ‘C2’ (females) 119 preys of 16 species. During the winter, ‘C3’ (males), ingested 485 preys of 11 species, and ‘C4’ (females) consumed 423 preys of 11 species.
Tables IV and V show the mean values of diet items for the winter and summer, based on 38 and 43 stomach contents, respectively.
DISCUSSION
In order to discuss the feeding ecology of the Great Pampa-finch during the summer, we made some com-parisons concerning the proportions and the diversity of prey items ingested between the two seasons when possible. The specimens collected had consumed 17% of seeds (biomass) in the summer and 60% in the winter. Plant seed families were Chenopodiaceae, Asteraceae, Cyperaceae, and Poaceae for the winter, and they dif-fered from the summer in certain species, namely He-lianthus annuus, Setaria ssp.,Zea mays, and Eleusine tristachia (Montalti et al. 2005). The summer plant species diverged considerably from the winter species (Table II), but they were all local components, both cul-tivated and ornamental crops. We assume that the un-determined vegetal fraction was obtained as part of in-digestible seed husks and grass that were picked while birds were eating fallen seeds. Wheat and corn were ob-tained from leftover crops at the end of August-Novem-ber. The harvesting activity spreads native and exotic seeds, but also grain storage offers “free” nourishment, especially for pest insects commonly preyed upon seed-eating birds. Even though seeds are important compo-nents of the winter diet, during the nesting season most of the birds feed on insects. Energy and protein require-ments increase in birds during breeding (Klasing 1998). Arthropod ingestion provides more nutrients than fruit for most passerine birds (Izhaki 1998). During the sum-mer, the amount of seeds and gastroliths decreased in comparison with the winter (Montalti et al. 2005).
[image:4.709.51.269.85.223.2]TABLE III
CCA analysis summarizing the correlation among variables and the information explained by axes.
Axes 1 2 3 4 Total
inertia
Eigen values 0.016 0.013 0.006 0.003 0.044
Species environment correlation 0.962 0.981 0.993 0.939 Cumulative percentage variance
of species data 37.3 67.1 80.6 86.4
of species-environment relation 39.4 70.9 85.1 91.3
Sum of all eigen-values 0.044
Sum of all canonical eigen-values 0.041
All four eigen-values reported above are canonical and correspond to axes that are constrained by the environ-mental variables.
TABLE IV
Mean winter dietary item values ofEmbernagra platensisat the Laguna de Guaminí during July 2000 (Montalti et al. 2005).
TW GN GW SN SW IN IW ItN
Mean* 1.13 16.54 0.25 11.17 0.59 19.09 0.41 27.21 Ds 0.28 12.78 0.32 9.75 0.39 23.51 0.34 24.14
Min. 0.62 2 0.01 1 0.01 1 0.04 2
Max. 1.8 50 1.11 43 1.4 77 1.23 104
N 38 28 30 36 36 33 34 38
Total 391 630 1034
*Mean values were based on N=38 stomach contents collected during the winter. TW=total stomach content weight, GN=number of gastroliths, GW=weight of gastroliths, SN=seed number, SW=seed weight, IN=insect number, IW=insect weight, ItN=number of items.
TABLE V
Mean summer dietary items values ofEmbernagra platensisat the Laguna de Guaminí during December 1997.
TW GN GW SN SW IN IW ItN
Mean # 0.57 0.82 0.01 7.19 0.21 7.39 0.40 11.95 Ds 0.21 2.22 0.02 11.10 0.20 9.77 0.40 13.44
Min. 0.16 0 0 0 0 1 0 1
Max. 1.16 10 0.06 56 0.66 50 1.77 63
N 43 22 22 26 26 43 43 43
Total 223 284 507
# Mean values were based on 43 stomach contents collected during the summer. TW=total stomach content weight, GN=number of gastroliths, GW=weight of gastroliths, SN=seed number, SW=seed weight, IN=insect number, IW=insect weight, ItN=number of items.
and Coleoptera. The summer dietary components were terrestrial insects, such as the 44.1% of Formicidae (bio-mass) represented byAcromyrmexsp. andAttasp. We suggest that some ants were captured from the ground and some were winged reproductive individuals that
Blattidae, Coleoptera, and Hymenoptera, compared to the winter even though they had eaten a larger quantity of preys. The presence of Araneae, Lycosidae, Cara-bidae, Curculionidae and Tenebrionidae may suggest that birds are digging the ground, removing leaves, tree barks and tissues, and exploring soil surfaces. Dermap-tera (Forcicula sp.) and Heteroptera (Periplaneta sp.) are not abundant, but we suggest that they were trapped during flying displays or while scavenging the soil stra-tum. A similar dietary diversity was registered in South African passerine birds also composed by beetles, ter-mites, berries, seeds and ants (Kopij 2003, 2005).
Aquatic arthropods were represented by larval stages of Odonata (dragonflies) and Hemiptera such as
Belostomasp., that were found in six different samples (Beltzer 1990). We found several brownish and green-ish caterpillars. A diversity measurement gave us the trophic spectrum, which was composed of 41 taxa (9 plants, 32 arthropods) for the summer and 21 (9 plants, 12 arthropods) for the winter (Montalti et al. 2005).
During the summer, the mean seed weight of the content (0.57g, SD±0.21) (0.21g) was half of the mean weight encountered for the winter (Tables IV and V), which was 1.6% and 3% of the body mass, respectively. Other summer values resulted in a minor proportion in comparison to the values of the winter. The items con-sumed throughout the summer were also half in quan-tity (abundance) in comparison with the winter period. This behavior could be related to the feeding period of chicks. However, variety in the trophic spectrum was higher during the summer, whereas the mean body weight was similar for both seasons (Tables IV and V).
Concerning the animal fraction, we would like to emphasize the proportion of ants in the diet of Ember-nagra platensis, which is notorious and very abundant when compared to other insect proportions. Beltzer (1990) found Atta sp. and Acromyrmex sp., the same genus found in this study for both seasons. These “leaf-cutter ants” can be universally found in a variety of eco-systems. 44.1% of ants (out of a total of 83% of in-sect biomass for the summer) and 39% (out of a total of 95.8% for the winter) are too many ants for a seed-eating bird species. Curiously, the Great Pampa-finch could be developing some kind of natural control on harmful insects. In the same line, this bird could be
showing a behaviour indulged in by birds called “ant-ing”. Many bird species have been observed picking up ants and rubbing them on their plumage, a behavior which is displayed frequently (Clark and Clark 1990). Most anting reports involve passerines, especially of the Corvidae, Sturnidae and Emberizidae families (Wenny 1998) but, in fact, though anting is not well understood yet, birds seem to acquire the defensive secretions of ants due to their fungicidal and bactericidal properties. Video-recording could be a helpful tool in case of labo-ratory experiments, but what happens during the anting behavior is not known. These finches could be perform-ing a defensive treatment by usperform-ing ants or stimulatperform-ing the formic acid discharge before eating them because of their taste. In this sense, the Great Pampa-finch could naturally be displaying some kind of pest biological con-trol in local agriculture, feeding on harmful insects, ants and beetles (e.g.Curculionidae). This could be an auspi-cious hint of an opportunity to study some of the feeding mechanisms thatEmbernagra platensisuses.
ACKNOWLEDGMENTS
This work was part of an integral research program car-ried out by many groups of investigators researching in the same Laguna de Guaminí area. We want to thank the Dirección Provincial de Recursos Naturales de la Provincia de Buenos Aires (Direction of Natural Re-sources of the Province of Buenos Aires) for the per-mission granted according to federal laws to do research in this area in December 1997. We also want to thank Magdalena Ponce for manuscript corrections.
RESUMO
O objetivo deste estudo foi reunir dados referentes à ecolo-gia alimentar do Sabiá-do-banhado,Embernagra platensis, na laguna de Guaminí, Buenos Aires, Argentina, e explorar as
(26,9%), Cyperaceous (25%), Poaceae (Gramineae) (19,3%) ePanicumsp. (11,2%). Os valores de IRI foram 893,8 para
Triticum aestivum, 174,5 para Gramineae, 126,5 para Pani-cum sp. e 112,8 paraScirpus sp. A largura do nicho ali-mentar foi 0,33 para ambos o sexos; o índice de diversidade resultou em 1,06 para fêmeas e 1,33 para machos, e a diversi-dade específica variou de 1,87 a 2,84. A análise canônica de
componentes (ACC) foi realizada nas variáveis ambientais e morfométricas, e o teste de Monte Carlo confirmou as corre-lações canônicas. O teste-tmostrou que alguns pássaros har-monizaram com um modelo logarítmico e alguns com uma curva geométrica. Durante o verãoEmbernagra platensis in-gere Hymenoptera e Coleoptera com mais frequência do que sementes, sugerindo que dois mecanismos biológicos poderiam estar ocorrendo neste pássaro.
Palavras-chave: Argentina,Embernagra platensis, ecologia alimentar, Sabiá-do-banhado.
REFERENCES
ARAVENARO. 1928. Notas de alimentación de algunas aves. Hornero 4: 153–166.
BELTZERAH. 1990. Biología alimentaria del Verdón Común
Embernagra platensis platensis(Aves: Emberizidae) en el Valle aluvial del río Paraná Medio, Argentina. Orn Neot 1: 25–30.
CLARKCCANDCLARKL. 1990. Anting behavior by Com-mon Grackles and European Starlings. Wilson Bull 102: 167–169.
COLWELLRKANDFUTUYMADJ. 1971. On the measure-ment of niche breadth and overlap. Ecology 52: 567–576.
CRONQUIST A. 1993. The evolution and classification of flowering plants. New York: New York Botanical Garden, Bronx, 555 p.
HAYESFE. 2003. Geographic variation in the Great Pampa-FinchEmbernagra platensiscomplex: evidence for two species. Ardeola 50: 223–235.
IZHAKII. 1998. Essential amino acid composition of fleshy fruits versus maintenance requirements of passerine birds. J Chem Ecol 24: 1333–1345.
KLASINGK. 1998. Comparative Avian Nutrition. New York: Oxford University Press, 350 p.
KOPIJ G. 2003. Diet of some species of Turdidae in South African grasslands: short communication. SAJWR 33: 55–59.
KOPIJ G. 2005. Diet of some insectivorous passerines in semi-arid regions of South Africa. Ostrich 76: 85–90.
KREBSCJ. 1989. Ecological Methodology. New York: Har-per Collins Pub, 654 p.
KUSNEZOV N. 1978. Claves para la identificación de las hormigas de la fauna argentina. Ministerio de Agricultura y Ganadería, Buenos Aires, p. 1–56.
LEVINSR. 1968. Evolution in Changing Environments. Prin-ceton, N.J.: Princeton University Press, 120 p.
MARELLICA. 1919. Sobre el contenido estomacal de algu-nas aves. Hornero 1: 221–228.
MERRITRWANDCUMMINSKW. 1978. An introduction to the aquatic insects of North America. Debuque: Kendall-Hunt Pub Co, 441 p.
MONTALTI D, FERMAN L, CAMPERI AR, SOAVE GE, ARAMBARRIAMANDDARRIEUCA. 2005. Winter diet of Embernagra platensis platensisin Guaminí Lagoon, Argentina. Acta Ornithol 40: 79–82.
RIDGELY RS AND TUDOR G. 1989. The birds of South America. Vol. 1. The Oscines Passerines. Austin: Uni-versity Texas Press, 814 p.
SHANNONCEANDWEAVERW. 1949. The Mathematical Theory of Communication. Urbana: University of Illi-nois Press, 144 p.
SHORTLL. 1975. A zoogeographic analysis of the South American Chaco avifauna. Bull Amer Mus Nat Hist 154: 165–352.
WENNYD. 1998. Three-stripped Warbler (Basileuterus tris-triatus) “Anting” with a caterpillar. Wilson Bull 110: 128– 131.
YARDHKANDBLAKEJG. 2002. Inventory and Monitoring of Terrestrial Riparian Resources in the Colorado River Corridor of Grand Canyon, An Integrative Approach. An-nual Report. Cooperative Agreement 01WRAG0044 and 01WRAG0034.
ZOTTA A. 1932. Notas sobre el contenido estomacal de algunas aves. Hornero 5: 77–81.
ZOTTA A. 1936. Sobre el contenido estomacal de aves Argentinas. Hornero 6: 261–270.