Based on a Fuzzy Logic Model
Esteban Arias Caracas(&) , Daniel Fernando Mendoza López(&) , Paulo Alonso Gaona-García(&) ,
Jhon Francined Herrera Cubides(&) , and Carlos Enrique Montenegro-Marín(&)
Faculty of Engineering, Universidad Distrital Francisco Joséde Caldas, Bogotá, Colombia
{eariasc,dfmendozal}@correo.udistrital.edu.co, {pagaonag,jfherrerac,cmontenegrom}@udistrital.edu.co
Abstract. Linked Open Data has been one of the most widely used online data publishing methods in recent years. This growth means that the quality of this data is required for the benefit of consumers and people who wish to use this data. There are approaches based on classical mathematical models, however, most of these results are too linear; that is, they use conventional evaluators to define both quality aspects and results. In response, a new approach based on fuzzy logic is constructed as an application, which aims to complement and compare traditional models without the need to restrict the quality aspects with which it can be measured. As a methodology, it is done by obtaining data from each dataset through the SPARQL Endpoints provided by high category data-sets, classifying them within accessibility and trust dimensions, represented in 4 values: response time, scalability, trustworthiness and timeliness. This analysis is done internally for the values within the accessibility dimension, and exter-nally for the values within the confidence dimension. In this way, it is possible to know or determine a better general quality approximation of the Linked Open Data according to a large number of quality evaluation variables, or even parameterize its own aspects in the model as a complement to the already established models, through the concept of fuzzy logic.
Keywords: Linked open data
Fuzzy logicQuality measurement1
Introduction
Linked Open Data has been one of the most recent changes in information in recent years, specifically the way in which data is published, distributed and consumed [1]. These data can easily be uploaded and updated by any type of organization, be it individuals, small groups of people, educational organizations, social networking sites and even government agencies [2]. This upload process in the data management platforms allows an agile data publication, and with few restrictions to the end user, through a simple web interface. On the other hand, if a developer or researcher, it is required to query or download their Dataset, these platforms offer an API interface that interacts with different tools, offers a variety of services, and allows to carry the
©IFIP International Federation for Information Processing 2018
required processes [18]. Due to this large number of people, which can upload data to the Web, this model has grown exponentially, from 12 datasets in 2007, to approxi-mately 300 in September 2011, and 9,960 datasets in 2016 [3], taking into account that this number is accumulated from the data catalogs: data.gov, publicdata.eu and data-hub.io [4]; three of the main collections of datasets available to the public.
This growth in Linked Open Data requires methods or tools that can handle this data, to make it“secure, stable, fast and accurate; in other words, have a better quality,”[5]. However, quality is a very complex concept; defining what is good quality or not is very subjective and cannot be defined in one way or by a simple judgment [2,6].
For this reason, many researchers have been looking for methods to complement the quality of the data and administer them for later evaluation. Some of these researchers have created software that can evaluate quality with mathematical proce-dures, such the quality measurement software,“Luzzu”[6]. However, much of these results are extracted from classical or conventional mathematical models. This causes the calculated quality to possess a certain degree of uncertainty. Therefore, a formu-lated problem is generated: How to calculate the quality of Linked Open Data in a more precise way, with a considerable amount of quality variables to take into account?
As a new solution to the previous problem, modeling based on fuzzy logic is a solution that can provide the measurement of quality, taking into account the tolerance of intermediate values between conventional evaluators [7]. To cover the complexity of quality, it has approached the classification of quality through dimensions [8]. The proposed model covers 2 dimensions, of which four aspects will be represented in order to evaluate the quality of the linked open data, which will help to show the capacity of the fuzzy logic model when supporting a large number of quality aspects, and obtain a more accurate approximation of quality.
2
Theoretical Background and Related Work
2.1 Quality Dimensions
Datasets can be analyzed and classified through different dimensions, which can be contextual, trustworthy, intrinsic, among others [8]. These dimensions are classifi ca-tions of groups of different variables or data quality measurement values or variables. For this model, the trust and accessibility dimensions were the most appropriate approaches to analyze the model.
The reason why these dimensions were chosen resides in the importance of each dimension can generate and the relationship between factors linked to the opinion of the client and linked to the functionality of the data set. The combination of both factors can arrive at a closer approximation to correctly measure the quality of the data, as well as to build the model as comprehensible to the user as possible.
The classification of each concept to its respective dimension results in the grouping of the response time and scalability in the dimensions of accessibility and the Trustworthiness and Timeliness in the confidence dimension.
2.2 Fuzzy Logic
The need to specify the fuzzy logic as the model to work was justified by the importance of changing the paradigm of mathematical results during studies during the last years. In classical mathematical concepts, variables can only be represented in 0 or 1, true or false, among others. In the measurement of quality, this type of results is ambiguous, since quality cannot exist or not exist. It is a value that can be partially good or partially bad, partially true or partially false [9]. Quality, for example, is something that cannot be described in a classic model of good or bad so easily; leads to ambiguous results and inaccurate results, but Fuzzy Logic, considering that it uses
rules that define quality in segments and results that can be represented in more than two ways or variables, can adequately define a better approximation of the Data Quality evaluation.
2.3 Related Work
It is worth noting that both the fuzzy logic, which is the model used, and the open data are quite recent concepts and both have a very strong affinity, as well as a greater use during the last years [10]. Due to this reason, there are very few previous works similar to the one in this article.
The union of these two concepts arises from their compatibility and innovation. The representation of the rules that define the quality in segments of more than two answers can adequately define a better approximation of the evaluation of Data Quality, without the need of great requirements both for its main design and its portability, thus allowing to add more quality variables and more dimensions to work, for later calculation of quality more accurately.
The most outstanding works to take into account are the one by Daniel Lewis and Trevor Martin about the use of fuzzy logic for the analysis of ontologies and vocab-ularies within of Linked OpenData [11]; and the other one by Herrera-Cubides et al., about the description, modeling, implementation and analysis of a fuzzy system type I based on logical rules, oriented to the decision making about the uncertainty of trust levels in the consumption LOD Datasets [17].
3
The Proposed Methodology
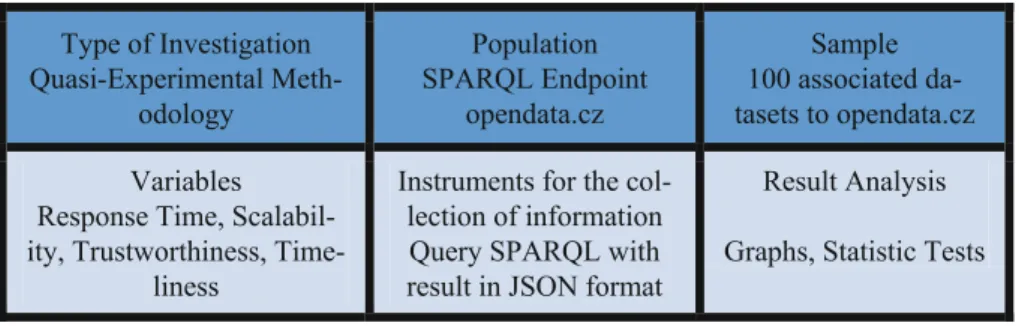
As a population the dataset ofopendata.czis taken into account, which has its own RDF Query Language (SPARQL) Endpoint, by which query type queries are carried out. As a sample, 100 datasets were taken associated with the main datasetopendata.cz, located in the Czech Republic. The SPARQL Endpoint corresponding to theopendata.cz dataset was used as instruments for data collection, and a JSONfile for its subsequent analysis within the model was obtained as a result of a query to this endpoint. As a model analysis plan, it has been decided to compare quality values between the two cases raised for the visualization of the effect of more or less variables included within the fuzzy logic model. In turn, it was decided to show the comparative graphs between both cases for the values resulting from the evaluated quality, at the same time to visualize by means of tables statistical tests such as the deviation and the standard error.
The modeling for the evaluation of data quality in Linked Open Data can be built with a fuzzy logic approach, defining whether the quality is low, medium or high. Due to the represented model that uses a centroid method, since the need to improve previous models of data quality with a considerable number of inputs or quality criteria, allows us to obtain a percentage approximation value. As a percentage that is repre-sented between a range and this truth value is more extended than the classical mathematical values of 0 and 1, the established ranges represent values of real life, such as low, medium or high (Fig.2).
The fuzzy logic model requires the evaluation of each of the four quality mea-surement channels, also known as the background of the model, through a series of rules, to then evaluate the output to determine if the quality of the data is high, medium
Type of Investigation Quasi-Experimental
Meth-odology
Population SPARQL Endpoint
opendata.cz
Sample 100 associated da-tasets to opendata.cz
Variables Response Time, Scalabil-ity, Trustworthiness,
Time-liness
Instruments for the col-lection of information Query SPARQL with result in JSON format
Result Analysis
Graphs, Statistic Tests
Fig. 1. Methodological design graphic, source: own elaboration
or low. Two cases are evaluated: for thefirst case all four aspects are taken and the quality is measured with them. In the second case, 2 of the aspects are taken and redefined in their worst possible values and evaluate the quality of the data in a similar way to thefirst case. The main objective of these cases is to evaluate and compare the results considering that one case has many more factors than the other, and therefore is more accurate [8].
Thefirst entry to evaluate is the Response Time, in which it can be calculated using the capacity in which the analyzed dataset is available and can respond to requests, because it is defined as“a data set can work well only if It is available and has a low response time” [12]. As a model definition within a range between 0 and 1, the response time is 1 if a response is received when requesting internal data from each dataset and the value is 0 otherwise. (Figure3).
The second input to be measured in the model is scalability. Scalability measures the ability to respond to multiple users or requests at the same time [8]. The evaluation of this concept is taken by the concept of concurrency that supports the service that exposes the endpoint. As a methodology, it is measured by one and four users towards each of the datasets, performing a simulation in which each of these users makes a query towards the endpoint at the same time. After this, the average server response time is calculated for each user case and then applied a division between each average time of one and four users. This response variable will be expressed within a range [0,1], in which the value 0 is considered the lowest possible scalability and 1, the highest.
The relationship between the average time and the generation of the formula was based on the formula of the Timeliness assessment model of Olaf Hartig [13]. In his work, due to the similarity and the evaluation method used, which allowed to verify mathematically in a range, adaptable to this model of fuzzy logic.
The third entry to analyze in the model is Trustworthiness. The reliability allows to evaluate if the information and the data are classified as true and correct within the needs of each user of them. The Trustworthiness is measured in an interval [−1,1] that considers−1 as absolute distrust and 1 as absolute confidence.
0 0.2 0.4 0.6 0.8 1 1.2
0
Membership
Response Time
high_responseƟme low_responseƟme
The fourth entry of the model is Timeliness. This concept defines the moment in which the datasets were updated or modified for the last time. As a measurement, Timeliness is defined in an interval [0,1] in which 0 represents uncertainty and the result 1 represents certainty.
Each case of the fuzzy logic model has three specific rules, one defining each possible case of quality within each dimension. It is necessary to clarify that, the output value called Quality within each rule for each dataset is according to the dimension in which the rule is classified, but not to the global quality. This is for the purpose of measuring global quality taking into account all the proposed rules and not only one or two that are met, at the same time to associate each aspect with its related ones and not to mix them, since comparing non-related metrics does not have a lot of logic. According to Fig.3 and thanks to the software MATLAB and the tool Fuzzy Logic Toolbox, the rules for the Accessibility Dimension (from number 1 to number 6) and the rules for the Trust Dimension (from number 7 to number 10) are:
It is necessary to emphasize that the relationship that has the response time and the scalability shown in Fig.4, is mainly the performance that both variables specify when evaluating the dataset. Scalability successively measures the response time of each dataset, so the result of the response time will directly affect the scalability result. The relationship that maintains Trustworthiness and Timeliness sown in Fig.4, is mainly from the internal analysis of each dataset. Both Trustworthiness and Timeliness take internal data from the dataset as date of creation, authors, dataset of origin, among others, which internally define the confidence dimension for obtaining the quality of the data.
Regarding the output result, the model will take into account the generated rules and produce an interval percentage between 0% and 100%, 0% representing the worst possible quality and 100% representing the best possible quality.
4
The Infrastructure of the Implemented Model
The capture of the data (or the population to be taken into account in the research) was done through the SPARQL Endpoint of the data set “opendata.cz“, known for its interest in“building an open data infrastructure that allows access to public data in the Czech Republic”[14]. Within this Endpoint, the number of data sets that the SPARQL query displays is 100, taking it as the investigative sample of the process. It is nec-essary to emphasize that the approach used requires both the internal data of the SPARQL query and external data, taken mainly to measure the values of Response Time and Scalability within the framework.
The SPARQL query used in the test model obtains the metadata results: the dataset title, the dataset description, the dataset creator (important for the Trustworthiness analysis), the dataset’s contributors (important for the analysis of the Trustworthiness), the date of creation and modification of the dataset (important for the analysis of Timeliness), these grouped within a JSONfile for later addition to the model. These are designed for the standards of the Semantic Web of RDF and the Vocabularies dcterms (Dublin Core Terms) and foaf (Friend Of A Friend).
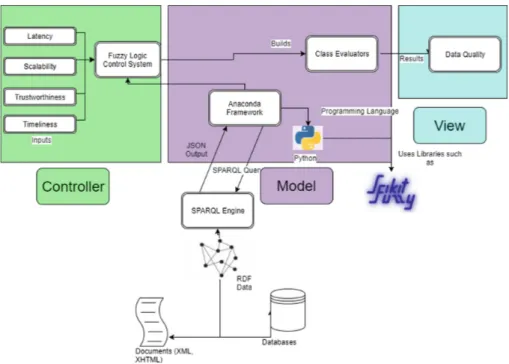
As shown in the Fig.5, the analysis of the data is done through Anaconda Framework, driven by the Python programming language, which allows to evaluate the data of a JavaScript Object Notation (JSON), which is a light interchangeable
structured result of data generated by SPARQL Endpoints through the open server VIRTUOSO. As a note, the SPARQL query that obtains information shows the associated datasets, defining their relationship, point of origin and internal data such as the dataset author or the creation date of the dataset [4]. Mechanically, both the response time and the scalability are calculated by making requests based on HTTP/1.1 of the SPARQL query, to obtain response times and calculate an average.
After obtaining the main data, the model proceeds to use controllers and evaluators defined for each antecedent as part of the structure in its programming, each with its specific function; the controllers allow the JSON data to be extracted and divided into segments, defined by the four dimensions of the quality of the data, and the evaluators execute the operations on the data to prepare them for processing in the model. Within the fuzzy logic model, the entries are updated and proceeds to compare the results with the 6 previously defined rules, and allow to obtain an output result per dataset.
5
Results
The data collection was successful for the 100 datasets to be analyzed, obtained in a JSON file as a result. To show results not extensive to the reader, only four sample datasets from the list of 100 datasets obtained from the SPARQL Endpoint of the dataset“opendata.cz“are shown in this section.
For the Response Time case, the average response time calculated as 43.73 ms was compared to each time calculated. This procedure was executed approximately 50 times more and then the average of those times was obtained, in which it gave the result of 48.32 ms. It was possible to verify that each of the datasets analyzed within the study gave results within the JSON of the given request, that is, no null values or no response were obtained from the datasets, so the response time value for each of these datasets is 1 (Table1).
In the case of Scalability, the procedure to follow was a SPARQL request to extract internal data from each dataset, used within the cases of Trustworthiness and Timeli-ness. This process was executed an amount of 50 times more, obtaining as a result response times for one and four users separately, for a total added of 250 times. As a next step, each of the four user times were added, obtaining data from a single response time group, which were then compared with a user’s data, using the average time of both groups. With this, the formula proposed above is applied and the average scal-ability result equals 0.900363599953. As a reference, this value is between a range of [0,1] (Table2).
Table 1. Examples of results of response times, Source: Own.
Dataset name Calculated response time Czech municipalities 48.1128183467
In the case of Trustworthiness, the natural way to measure this case is to take the author and collaborator values of each dataset and evaluate if these data are present (without null value). However, due to the empirical status of the study for the 100 sample datasets, the Trustworthiness was statically evaluated as 1, considering that all datasets contain authors and contributors verified by Datahub, a platform designed by the Open Knowledge Foundation.
In the case of Timeliness, the date of each dataset was taken into account as regards its creation and last modification. In order to specify and generalize the calculation of this factor, only the current year of this article (2017) was taken into account to compare both dates. As a result, you get a range between 0 and 1 per data set.
Taking into account the analysis plan previously proposed in the Methodology section, as afirst step we studied the standard deviation and the error of the results of the model both for the quality cases and for the Response Time and Scalability due to the use of its average values to execute the model. The standard deviation of both quality cases is quite small, which can define the high precision of the calculated data, due to the low dispersion range between the mean and the values obtained [15]. It is worth noting that Case 2 has a larger Standard Deviation because taking only Time-liness and Response Time as factors thatfluctuate the result, but all other variables are still present within the same values as Case 1, so a correlation between both cases exists and has similar standard deviation results, and, therefore, defining a high precision in the output results of the fuzzy logic model.
At the same time, the addition of the standard error confirms the fact that the sample of the data taken does not have a high discrepancy. Specifically, with the result of the quality in case 1, which contains all four quality variables, it is important to know that this discrepancy decreases, and thus allows recognizing that the model can support a greater number of quality variables without fluctuation much discrepancy found (Figs.6and 7).
In relation to the results of the quality of the results for both cases, it is observed that thefirst case has a higher percentage than the second case due to having a better score in two of the dimension values, however, it is observed that both cases have peaks that mean higher quality. The main reason for this phenomenon is that Time-liness and Response Timefluctuate the results. In a real scenario, the peaks are rep-resented by values that do not have a high Timeliness, proven by not having the best possible value in the interval, 1.
In the comparison of the Luzzu framework, although the modeling of both frameworks are different, it can be seen that their growth in terms of processing and speed based on the execution time of the models are linear. However, it is noted that the
Table 2. Examples of scalability results. Source. Own elaboration
Dataset name Calculated scalability result Czech municipalities 0.917890563599
fuzzy logic model has a faster amount of time executed for the processing in com-parison to Luzzu, making it have a better performance.
As an added value to this model, although it uses mathematical formulas similar to those of this model for the calculation of data [6,12], Luzzu uses classic modeling to process data in a percentage way, without the advantages that fuzzy logic generates to obtain a more precise result, such as the establishment of rules according to dimensions.
6
Conclusion and Discussion
Linked Open Data has been growing exponentially in recent years, and will continue to grow more and more due to the full capacity for everyone to publish data on the web freely to share information. However, that only makes quality more and more important
56 56.5 57 57.5 58 58.5 59 59.5
1 7 13 19 25 31 37 43 49 55 61 67 73 79 85 91 97
Quality Value
Dataset Number
Fig. 6. Graph of the quality of the results,first case. Source: Own.
15 16 17 18 19 20
1 6 11 16 21 26 31 36 41 46 51 56 61 66 71 76 81 86 91 96
Quality Value
Dataset Number
towards the future as shown in reviews of the state of the Web of the data made by authors such as Herrera-Cubides et al. [16]. An approach through fuzzy logic is a solution that has many advantages, such as the ability to mathematically define quality and focus on it deeply, rather than classical mathematical approaches. However, as an example, its full potential has not been proven; in this case, the same endpoint was evaluated, which means that quality aspects were similar, apart from facts such as the need to add more and more quality dimensions and, therefore, the use of more rules and operations. Another aspect that this model must consider is a greater inclusion of the user in the evaluation of quality, due to the need to evaluate the model personally and with the help of feedback, allowing the model to be even more precise. In turn, as seen in the comparison with other recent frameworks, there are limitations both of this fuzzy logic model, and of these frameworks, which can be mitigated or complemented. It is possible tofind results that allow us to verify the main functionality of this concept, that is, in the definition of relative results, instead of absolutes, as in the case of“if it has quality or does not have quality”scenario.
In summary, the key contribution of the fuzzy logic model is the capacity of the quality calculation of Linked Open Data, related within the datasets, in a precise and controlled manner with a large number of variables and dimensions of quality to measure. As future work, we mainly seek to add a greater number of dimensions to achieve a global quality of the data, while adapting this model to other research techniques within the LODfield with different means and alternatives, according to the evolution of these data.
References
1. Hu, B., Rodrigues, E.M., Viel, E.C.: Proceedings of the 16th International Conference on Information Integration and Web-based Applications & Services - iiWAS 2014, pp. 217– 223. ACM Press, New York (2014).https://doi.org/10.1145/2684200.2684336
2. Bonatti, P.A., Hogan, A., Polleres, A., Sauro, L.: Robust and scalable linked data reasoning incorporating provenance and trust annotations. Web Semant. Sci. Serv. Agents World Wide Web9(2), 165–201 (2011).http://aidanhogan.com/docs/saor_ann_final.pdf
3. Auer, S., Ermilov, I., Lehmann, J., Martin, M.: LODStats - 9960 datasets (2016).http://stats. lod2.eu/. Accessed 14 Aug 2017
4. Ermilov, I., Lehmann, J., Martin, M., Auer, S.: LODStats: the data web census dataset. In: International Semantic Web Conference, pp. 38–46 (2016). http://jens-lehmann.org/files/ 2016/iswc_lodstats.pdf
5. Thakkar, H., Endris, K. M., Gimenez-Garcia, J. M., Debattista, J., Lange, C., Auer, S.: Are linked datasets fit for open-domain question answering? A quality assessment. In: Proceedings of the 6th International Conference on Web Intelligence, Mining and Semantics - WIMS 2016, pp. 1–12. ACM Press, New York (2016).https://doi.org/10.1145/2912845. 2912857
6. Debattista, J., Auer, S., Lange, C.: Luzzu—a methodology and framework for linked data quality assessment. J. Data Inf. Qual.8(1), 1–32 (2016).https://doi.org/10.1145/2992786
8. Zaveri, A., Rula, A., Maurino, A., Pietrobon, R., Lehmann, J., Auer, S.: Quality assessment methodologies for linked open data a systematic literature review and conceptual framework, Undefined(1), pp. 1–5 (2012).http://www.semantic-web-journal.net/system/files/swj414.pdf
9. Stella-vagaska Alena, H.: Application of fuzzy principles in evaluating quality of manufacturing process. WSEAS Trans. Power Syst.7(2), 1–10 (2012)
10. Dernoncourt, F.: Introduction to Fuzzy Logic, pp. 1–21. Massachusetts Institute of Technology (2013).http://aisii.azc.uam.mx/mcbc/Cursos/IntCompt/Lectura15.pdf
11. Lewis, D.J., Martin, T.P.: Managing vagueness with fuzzy in hierarchical big data. Procedia Comput. Sci.53, 19–28 (2015).https://doi.org/10.1016/j.procs.2015.07.275
12. Zaveri, A.: Linked Data Quality Assessment and its Application to Societal Progress Measurement. University of Leipzig (2015).https://core.ac.uk/download/pdf/35206278.pdf
13. Hartig, O., Zhao, J.: Using web data provenance for quality assessment. In: Proceedings of the First International Conference on Semantic Web in Provenance Management, vol. 526, pp. 29–34 (2009).http://ceur-ws.org/Vol-526/paper_1.pdf
14. Nečaský, M., Klímek, J., Chlapek, D., Kučera, J., Mynarz, J., Svátek, V. OpenData.cz (2015).https://opendata.cz/. Accessed 5 Sept 2017
15. DataStar Inc.: How to Interpret Standard Deviation and Standard Error in Survey Research (2013).www.surveystar.com. Accessed 7 Sept 2017
16. Herrera-Cubides, J.F., Gaona-Garcia, P.A., Sánchez-Alonso, S.: The web of data: past, present and future? In: XI Latin American Conference on Learning Objects and Technology (LACLO), San Carlos, Costa Rica, pp. 1–8 (2016).https://doi.org/10.1109/LACLO.2016. 7751802.https://ieeexplore.ieee.org/document/7751802/. Accessed 3 Sept 2017
17. Herrera-Cubides, J.F., Gaona-García, P.A., Alonso-Echeverri, J.I., Riaño Vargas, K.A., Gómez- Acosta, A.C.: A Fuzzy Logic System to Evaluate Levels of Trust on Linked Open Data Resources. Revista Facultad de Ingeniería,86(2018).http://aprendeenlinea.udea.edu. co/revistas/index.php/ingenieria/article/view/328937, Universidad de Antioquia, Colombia, ISSSN 0120-6230. Accessed 1 Feb 2018