PERMANYER www.permanyer.com
ORIGINAL ARTICLE Rev Inves Clin. 2015;67:372-8
Decades of Experience in the Diagnosis
of Dengue Fever
in the Northwest of Mexico
Manuel Moreno-Legorreta
1, Sara Díaz-Castro
1, Alfredo Ortega-Rubio
1, Ivonne Tovar-Zamora
2and Vania Serrano-Pinto
1*
1Centro de Investigaciones Biológicas del Noroeste; 2Laboratorio Estatal de Salud Pública, Ministery of Health, La Paz, Baja
California Sur, Mexico
Corresponding author:
*Vania Serrano-Pinto
Centro de Investigaciones Biológicas del Noroeste Instituto Politécnico Nacional, 195
C.P. 23096, La Paz, B.C.S., México
E-mail: vserrano04@cibnor.mx Received for publication: 04-12-2015 Accepted for publication: 12-12-2015
ABSTRACT
Background: The State of Baja California Sur is in an arid region of Mexico, the southern half of the Baja California Peninsula.
Given its aridity and physical isolation from mainland Mexico, there were no records of dengue fever in the state before 1985. Until now, no data on dengue incidence had been published. Objective: To study some epidemiological features of dengue fever
in Baja California Sur, Mexico in the last 30 years. Methods: Total number of cases, general population, sex, age groups, serotypes,
mortality, and incidence data were analyzed. Results: There was a 652% increase in reported cases from 2012 through 2014.
Age groups mostly affected were adults aged 15-24 and 45-64 years old. Conclusions: This study makes a thorough analysis
of the incidence of dengue and makes recommendations to face the epidemiological challenge. (REV INVES CLIN. 2015;67:372-8) Key words: Dengue. Diagnosis. Vector-borne disease. Baja California Sur. Mexico.
INTRODUCTION
Dengue fever is a viral infection transmitted by mos-quito bites, which in the last few years has become a national public health priority. Dengue fever, dengue hemorrhagic fever, or its most serious form, dengue shock syndrome, are acute infectious diseases caused by an arbovirus of the family Flaviviridae, genus Flavi-virus dengue1,2. Infection can be lethal and is caused
by the dengue virus (DENV) group, which includes four
serotypes: DENV-1, DENV-2, DENV-3, and DENV-43,4.
Dengue virus is transmitted by infected Aedes aegypti female mosquitoes4. This is one of the most effective
vectors, as it is highly anthropophilic and lives and breeds in urban areas. The dengue mosquito has rap-idly expanded its geographic distribution, accompanying climate change, poor attention to control and eradica-tion programs, rapid populaeradica-tion growth, insufficient mu-nicipal infrastructure, and unsanitary habits that pro-mote an increase in the vector and infection in humans.
No part of this publication may be reproduced or photocopying without the prior written permission
of the publisher
.
The World Health Organization shows that the inci-dence of dengue has dramatically increased in the last few decades5. The number of dengue cases is often
poorly documented and many cases are incorrectly classified. According to a recent estimate, 390 million dengue infections occur each year, of which 67-136 mil-lion have clinical manifestations, regardless of the im-pact on victims6. In Mexico, the number of deaths
caused by dengue in the last few years is 3497; in 2014,
there were 46,092 confirmed cases of dengue reported and 8,856 confirmed cases of hemorrhagic dengue fe-ver. In 2014, Baja California Sur (BCS) reported 6,641 cases of dengue fever and 95 cases of hemorrhagic dengue8. In 2010, to warn the public about dengue, the
dengue mortality rates in Mexico from 1980 to 2009 were published9. In the Baja California Peninsula, little
information had been released, despite the history of dengue cases, its severity and risks, and that the num-ber of dengue cases has greatly increased in the last few years. This data needs to be understood and analyzed to estimate the extent of the public health problem. Our main objective was to assess the inci-dence of dengue in BCS from 1985 through 2014.
MATERIALS AND METHODS
Study population and data
Information on dengue fever and hemorrhagic dengue fever were obtained from online databases of the Annals of Morbidity from the Ministry of Health of Mexico (Anuarios de Morbilidad, Sistema Nacional de Vigilancia Epidemiológica. Epidemiología. Sistema Úni-co de Información, Dirección General de Epidemiología [DGEPI], Secretaría de Salud) from 1985 through 20148. In relation to the total number of cases,
inci-dence was analyzed for the general population, sex, seven age groups, serotypes, and mortality. All data were confirmed by serological tests (NS1, IgM, IgG), according to procedures for laboratory diagnosis of dengue fever and dengue hemorrhagic fever included in the Guidelines for the Epidemiological Laboratory Surveillance of Dengue (Lineamientos para la Vigilan-cia Epidemiológica de Dengue por Laboratorio)10.
Statistical analysis
Normality tests (Kolmogorov-Smirnov test), and ho-mogeneity of variance (Levene’s test) were used, with
significance set at p < 0.05. Analyses used Statistica 8.0 software (Statsoft, Tulsa, OK) to observe trends in case numbers for each age group in the study pe-riod. One-way ANOVA was conducted on data having significant statistical differences, using post hoc anal-ysis (Fisher’s Least Significant Difference Test) to find data having statistical significance. ANOVA was per-formed “within” each age group across the years of study and among the age groups.
RESULTS
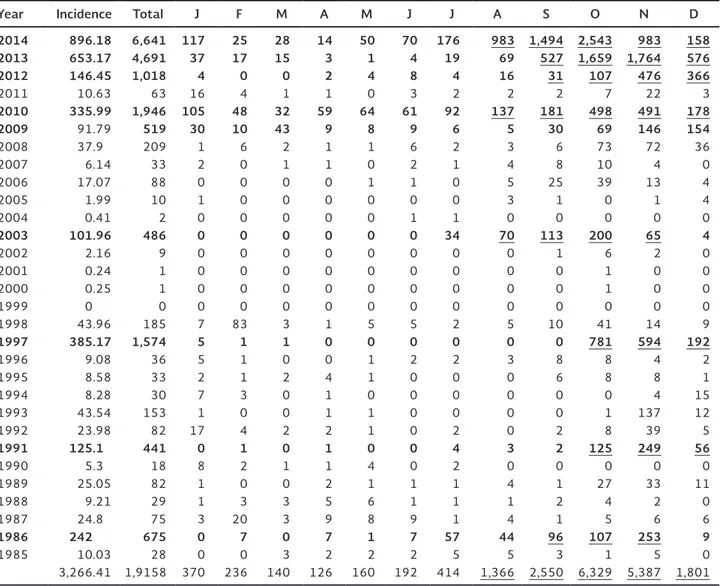
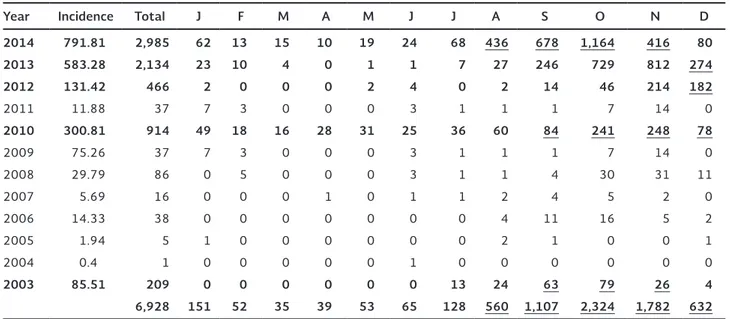
Table 1 shows cases of dengue fever by month in the last 30 years. Peak years were 1986, 1991, 1997, 2003, and 2010. Starting in 2010, major increases in cases occurred in 2012, 2013, and 2014. This table also shows that the highest number of cases occurred from August through December. Table 2 shows the in-cidence among females, starting in 2003 when more systematic records were kept. Years 2003, 2010, 2012, 2013, and 2014 had significant peaks. Table 3 shows similar data for males. As in table 1, most cases oc-curred in August through December. Table 4 shows cases of dengue hemorrhagic fever, number of deaths, and serotypes during the last few years.
The trend over the past 30 years in the state is shown in figure 1. Cyclic outbreaks occurred about every six or seven years (1991, 1997, 2003, and 2010). The cycle disappeared in 2012, when epidemic outbreaks started, which continued in 2013 and 2014. In 2014, the number of cases was 652% higher than in 2012.
The ANOVA was performed for the age groups only for years with peak outbreaks (Fig. 2). 1991 and 1997 showed statistically significant differences among age groups 15-24, 25-44, and 45-64. In 2003 and 2013, the most affected age group was 45-64; in 2010 and 2014, the most affected was 15-24 years old.
DISCUSSION
Occurrence of dengue fever in the State of Baja Cali-fornia Sur has been recorded since 1985. The number of cases has increased more than 75-fold, with higher rates among women in the last 12 years (2003-2014). The most likely cause for higher infection rates among women is that the majority remains at home for more
No part of this publication may be reproduced or photocopying without the prior written permission
of the publisher
.
Table 1. Cases of dengue fever in Baja California Sur by month from 1985 through 2014
Year Incidence Total J F M A M J J A S O N D
2014 896.18 6,641 117 25 28 14 50 70 176 983 1,494 2,543 983 158
2013 653.17 4,691 37 17 15 3 1 4 19 69 527 1,659 1,764 576
2012 146.45 1,018 4 0 0 2 4 8 4 16 31 107 476 366
2011 10.63 63 16 4 1 1 0 3 2 2 2 7 22 3
2010 335.99 1,946 105 48 32 59 64 61 92 137 181 498 491 178
2009 91.79 519 30 10 43 9 8 9 6 5 30 69 146 154
2008 37.9 209 1 6 2 1 1 6 2 3 6 73 72 36 2007 6.14 33 2 0 1 1 0 2 1 4 8 10 4 0 2006 17.07 88 0 0 0 0 1 1 0 5 25 39 13 4 2005 1.99 10 1 0 0 0 0 0 0 3 1 0 1 4 2004 0.41 2 0 0 0 0 0 1 1 0 0 0 0 0
2003 101.96 486 0 0 0 0 0 0 34 70 113 200 65 4
2002 2.16 9 0 0 0 0 0 0 0 0 1 6 2 0 2001 0.24 1 0 0 0 0 0 0 0 0 0 1 0 0 2000 0.25 1 0 0 0 0 0 0 0 0 0 1 0 0 1999 0 0 0 0 0 0 0 0 0 0 0 0 0 0 1998 43.96 185 7 83 3 1 5 5 2 5 10 41 14 9
1997 385.17 1,574 5 1 1 0 0 0 0 0 0 781 594 192
1996 9.08 36 5 1 0 0 1 2 2 3 8 8 4 2 1995 8.58 33 2 1 2 4 1 0 0 0 6 8 8 1 1994 8.28 30 7 3 0 1 0 0 0 0 0 0 4 15 1993 43.54 153 1 0 0 1 1 0 0 0 0 1 137 12 1992 23.98 82 17 4 2 2 1 0 2 0 2 8 39 5
1991 125.1 441 0 1 0 1 0 0 4 3 2 125 249 56
1990 5.3 18 8 2 1 1 4 0 2 0 0 0 0 0 1989 25.05 82 1 0 0 2 1 1 1 4 1 27 33 11 1988 9.21 29 1 3 3 5 6 1 1 1 2 4 2 0 1987 24.8 75 3 20 3 9 8 9 1 4 1 5 6 6
1986 242 675 0 7 0 7 1 7 57 44 96 107 253 9
1985 10.03 28 0 0 3 2 2 2 5 5 3 1 5 0 3,266.41 1,9158 370 236 140 126 160 192 414 1,366 2,550 6,329 5,387 1,801
Years with outbreaks are in bold typeface. Months with the highest number of cases are underlined.
Source: SUIVE/DGE/Secretaría de Salud/Estados Unidos Mexicanos 2014.
hours each day; mosquitoes breed in larger numbers in residential areas where standing water is common. These results are consistent with a study conducted in the cities of Merida and Tampico, where higher incidence is reported for women11. Similar findings
occurred in Malaysia from 1973 through 198712.
The incidence over the past 30 years peaked every 6-7 years. Starting in 2012, the incidence dramati-cally increased to epidemic proportions. The viral se-rotype found in 2010 and 2011 was DENV-1. Sero-types from 2012 through 2014 were DENV-1 and DENV-27. In 2014, the number of cases was 652%
higher than in 2012. It is possible that a change in the predominant circulating serotype may have, in some
way, contributed to these large and severe epidemics. Some authors mentioned that the DENV-2 serotype is associated with increased pathogenicity in the Ameri-cas13. Serotypes found in Mexico from 2005 through
2013 were DENV-1, -2, -3, and -49,14. This information
is similar to other studies15,16. In an effort to identify
factors related to transmission, these authors indepen-dently published two models that essentially reached the same conclusion: periodicity of dengue transmis-sion depends only on crossed, neutralizing, short-term immunity reactions15,16. This would explain why,
de-spite a cyclic period of about three years in dengue transmission, on average, synchrony is observed only in transmission of DENV-2 and DENV-3, while trans-mission peaks for DENV-4 have a longer periodicity17.
No part of this publication may be reproduced or photocopying without the prior written permission
of the publisher
.
Table 2. Cases of dengue fever in Baja California Sur among women by month from 2003 through 2014
Year Incidence Total J F M A M J J A S O N D
2014 1,004.25 3,656 55 12 13 4 31 46 108 547 816 1,379 567 78
2013 653.17 2,557 14 7 11 3 0 3 12 42 281 930 952 302
2012 146.45 552 2 0 0 2 2 4 4 14 17 1 262 184
2011 10.63 26 9 1 1 1 0 0 1 1 1 0 8 3
2010 335.99 1,032 56 30 16 31 33 36 56 77 97 257 243 100
2009 91.79 26 9 1 1 1 0 0 1 1 1 0 8 3 2008 46.8 123 1 1 2 1 1 3 1 2 2 43 41 25 2007 6.63 17 2 0 1 0 0 1 0 2 4 5 2 0 2006 19.97 50 0 0 0 0 1 1 0 1 14 23 8 2 2005 2.05 5 0 0 0 0 0 0 0 1 0 0 1 3 2004 0.41 1 0 0 0 0 0 0 1 0 0 0 0 0
2003 119.26 277 0 0 0 0 0 0 21 46 50 121 39 0
8,322 148 52 45 43 68 94 205 734 1,283 2,759 2,131 700
Years with outbreaks are in bold typeface. Months with the highest number of cases are underlined.
Source: SUIVE/DGE/Secretaría de Salud/Estados Unidos Mexicanos 2014.
Table 3. Cases of dengue fever in Baja California Sur among men by month from 2003 through 2014
Year Incidence Total J F M A M J J A S O N D
2014 791.81 2,985 62 13 15 10 19 24 68 436 678 1,164 416 80
2013 583.28 2,134 23 10 4 0 1 1 7 27 246 729 812 274
2012 131.42 466 2 0 0 0 2 4 0 2 14 46 214 182
2011 11.88 37 7 3 0 0 0 3 1 1 1 7 14 0
2010 300.81 914 49 18 16 28 31 25 36 60 84 241 248 78
2009 75.26 37 7 3 0 0 0 3 1 1 1 7 14 0 2008 29.79 86 0 5 0 0 0 3 1 1 4 30 31 11 2007 5.69 16 0 0 0 1 0 1 1 2 4 5 2 0 2006 14.33 38 0 0 0 0 0 0 0 4 11 16 5 2 2005 1.94 5 1 0 0 0 0 0 0 2 1 0 0 1 2004 0.4 1 0 0 0 0 0 1 0 0 0 0 0 0
2003 85.51 209 0 0 0 0 0 0 13 24 63 79 26 4
6,928 151 52 35 39 53 65 128 560 1,107 2,324 1,782 632
Years with outbreaks are in bold typeface. Months with the highest number of cases are underlined. Source: SUIVE/DGE/Secretaría de Salud/Estados Unidos Mexicanos 2014.
Although it is not fully understood, having all four se-rotypes present at the same time in one region would increase the possibilities for transmission, i.e., as circu-lation of all serotypes is established, more frequent epidemic episodes will occur, as in Southeast Asia17.
We reviewed state fumigation calendars for 2003 through 2014, finding large disparities of application
dates in different municipalities; that is, the same ap-plication calendar was not followed and changed each year in one or all five municipalities in the state18.
The highest incidence rates reported in this state, start-ing in 2003, agrees with information provided by the Pan-American Health Organization, where the number of reported cases increased fivefold from 2003 through
No part of this publication may be reproduced or photocopying without the prior written permission
of the publisher
.
10,000 a
b
c
e e g e d
Years f
8,000
6,000
4,000
Incidenc
e of dengue f
ev
er
2,000
0
2014 2013 2010 2003
1997 1991 1984
Table 4. Cases of dengue hemorrhagic fever, mortality, and se-rotypes in Baja California Sur, Mexico, from 1995 through 2014
Year DHF Mortality Serotypes
2014 95 4 1, 2 2013 117 3 1, 2 2012 14 0 1, 2
2011 7 0 1
2010 79 1 1 2009 21 0 0 2008 13 1 0 2007 5 NA NA 2006 27 NA NA 2005 2 NA NA 2004 0 NA NA 2003 441 NA NA 2002 0 NA NA 2001 0 NA NA 2000 0 NA NA 1999 0 NA NA 1998 0 NA NA 1997 1 NA NA 1996 2 NA NA 1995 1 NA NA
NA: data not available; DHF: dengue hemorrhagic fever. Source: SINAVE/DGE/SALUD/Sistema Especial de Vigilancia Epidemiológica de Dengue.
Figure 1. lncidence of dengue fever for 30 years in the State of Baja California Sur. Different letters on peaks mean signifi-cant statistical differences using ANOVA (Tukey, p < 0.05).
where adult patients had higher morbidity and increased number of deaths22. Similar trends of increasing
num-bers of adult patients occurred in South and South-east Asia and Latin America23-25. In a report that
in-cluded six cities in Asia, the most vulnerable subset was those over 15 years old26. Data from many
stud-ies suggest that a greater attention to the adult pop-ulation may help in reducing a serious loss of financial resources for working adults during their illness. A different age group appears to be more vulnerable in some nations. In the last 10 years, Brazil, Colombia, Costa Rica, El Salvador, Guatemala, Honduras, and Nicaragua experienced a higher incidence among chil-dren27. This has also been reported for Thailand, where
most dengue fever and dengue hemorrhagic fever oc-curs among children28.
It must be noted that this assessment used only avail-able data. Not all cases are reported, suggesting a larger problem. Also, we recognize the limitations of this study since there is no data by sex from 1985 to 2002 and no positive cases recorded in the official databases.
Today, significant progress has been made in research on the dengue tetravalent vaccine, currently tested in children29. As long as the vaccine is not available to
the general public, other measures must be imple-mented, particularly vector prevention and permanent containment of larvae. Measures include elimination of breeding grounds and fumigation. One of the most important actions in the short term is the immediate 201319,20. The latest report of cases in the state in 2014
is probably related to Hurricane Odile, which devas-tated the peninsula on 14 September 2014. This was the strongest tropical cyclone ever to hit the Baja California Peninsula, leaving an unprecedented trail of damage, flooding, and large-scale residential destruc-tion, providing very favorable conditions for the devel-opment of the vector mosquito. The highest number of reported cases occurred from October through De-cember. This increase is most likely tied to the ecol-ogy of the vector; when temperatures decline, larvae maturation time increases. They are smaller adults, and therefore, females must feed more frequently to fulfill nutritional and reproductive requirements, which makes them more efficient vectors21.
From 2003 through 2014, the highest morbidity oc-curred in the age groups 15-24 and 45-64. Similar results were seen in Sri Lanka in the last few years,
No part of this publication may be reproduced or photocopying without the prior written permission
of the publisher
.
Age groups
Incidenc
e of dengue f
ev
er
e d
500 1,000 1,500 2,000 2,500
f c
b
d a
e
f c
a
d b
e 2014 2013
3,000
b b b a
b e e b
a
c b
d 500
1,000 1,500 2,000 2,500
2003 2010
3,000 500
b b b a a a c c b
a a a b 1,000
1,500 2,000 2,500 3,000
1991 1997
c c
b
< 1 1-4
5-14 15-24 25-44 45-64 > 65 < 1 1-4 5-14 15-24 25-44 45-64 > 65
Figure 2. lncidence of dengue fever in different age groups in years with outbreaks in the State of Baja California Sur. Different letters on the bars indicate significant statistical differences ANOVA (Tukey, p < 0.05).
No part of this publication may be reproduced or photocopying without the prior written permission
of the publisher
.
intervention of public health services to improve mos-quito management and control. Current efforts are not enough. Public awareness of the seriousness of this dis-ease needs to be improved, emphasizing that the most effective measure against dengue fever is prevention, particularly eliminating breeding habitats, including re-moval of trash, old tires, and water-holding containers in backyards. We also recommend a structured fumi-gation calendar that works throughout the year in all municipalities. Government agencies should provide more resources to scientific efforts attempting to un-derstand the ecology and physiology of the mosquito and transmission of dengue fever.
ACKNOWLEDGMENTS
Funding was provided by the Centro de Investigaciones Bi-ológicas del Noroeste (CIBNOR project PPAC-2015) and the Natural Protected Areas Network (RENANP) as a part of the Consejo Nacional de Ciencia y Tecnología (CONACYT). The authors thank Ramón Gaxiola at IMSS for advice. Ira Fogel at CIBNOR provided editing services. Departamento de Estadísti-ca, Dirección General de Planeación de la Secretaria de Salud, BCS. Departamento de Vigilancia Epidemiológica, Subdirección de Medicina Preventiva de la Dirección de los Servicios de Salud, BCS, and Programa de Vectores de la Secretaria de Salud, BCS provided data and information.
REFERENCES
1. Chiparelli H, Schelotto F. Dengue una enfermedad emergente muy cerca de nuestro país. Revista de Infectología. Departa-mento de bacteriología y virología, Facultad de Medicina, Mon-tevideo, Uruguay. 2002. Available at: http://www.infecto.edu. uy/espanol/revisiontemas/tema10/den6290.html [Accessed 25 July 2015].
2. World Health Organization. Discriminating Concentrations of In-secticides for Adult Mosquitoes. WHO/CDC/CPC/MAL/1998;12. Geneva. P.1. Available at: http://www.who.int/csr/resources/pub-lications/dengue/Denguepublication/en/ [Accessed 12 July 2015]. 3. Rico-Hesse R. Molecular evolution and distribution of dengue
viruses type 1 and 2 in nature. Virology. 1990;174:479-93. 4. Monahth TP, Heinz FX. Flavivirus. In: Fields BN, et al. (eds).
Virol-ogy II, Third Edition, Philadelphia: Lippincott Raven. 1996;961-84. 5. World Health Organization. Dengue y dengue grave. 2015. Avail-able at: http://www.who.int/mediacentre/factsheets/fs117/es/. [Accessed 17 July 2015].
6. Bhatt S, Gething PW, Brady OJ, et al. The global distribution and burden of dengue. Nature. 2013;496:504-7.
7. SINAVE/DGE/SALUD/Sistema Especial de Vigilancia Epidemiológi-ca de Dengue. Secretaría de Salud. 2015a. Available at: http:// www.epidemiologia.salud.gob.mx/dgae/panodengue/intd_den-gue.html [Accessed 15 July 2015].
8. SUIVE/DGE/Secretaría de Salud/Estados Unidos Mexicanos. Anuarios de Morbilidad Sistema Nacional de Vigilancia Epidemi-ológica. Sistema Único de Información de la Dirección General de Epidemiología (DGEPI). Secretaría de Salud. 2014. Available at: http://www.epidemiologia.salud.gob.mx/anuario/html/anuarios. html. [Accessed 4 July 2015].
9. Gaxiola-Robles R, Celis A, Serrano-Pinto V, Orozco-Valerio MJ, Zenteno-Savín T. Mortality trend by dengue in Mexico 1980 to 2009. Rev Invest Clín. 2012;64:444-51.
10. Dirección General de Epidemiología. Instituto de Diagnóstico y Ref-erencia Epidemiológicos. Secretaría de Salud, 2015. Available at: https://col131.mail.live.com/mail/ViewOfficePreview.aspx?mess ageid=mgBKiAtjbG5RGuSwAhWtm-Vg2&folderid=flinbox&attind ex=1&cp=-1&attdepth=1&n=40265319. Accessed 14 July 2015]. 11. Kaplan JE, Eliason DA, Moore M, et al. Epidemiologic investiga-tions of dengue infection in Mexico, 1980. Am J Epidemiol. 1983;117:335-43.
12. Shekhar KC, Huat OL. Epidemiology of dengue/dengue hemor-rhagic fever in Malaysia–a retrospective epidemiological study 1973–1987. Part I: Dengue hemorrhagic fever (DHF). Asia Pac J Public Health. 1992-1993;6:15-25.
13. Ricco-Hesse R, Harrison LM, Salas RA, et al. Origins of Dengue Type 2 Viruses associated with increased pathogenicity in the Americas. Virology. 1995;230:244-51.
14. CENAPRECE. Centro Nacional de Programas Preventivos y Control de Enfermedades. Secretaría de Salud. Dirección General de Epide-miología. Reporte Panorama Epidemiológica Sem-45. Available at: http://187.141.20.3/reuniondirectores/2013/2013_6/09.40_ Dengue.pdf. 2013. [Accessed 15 July 2015].
15. Wearing HJ, Rohani P. Ecological and immunological determinants of dengue epidemics. Proc Natl Acad Sci USA. 2006;103:11802-7. 16. Adams B. Cross-protective immunity can account for the alter-nating epidemic pattern of dengue virus serotypes circulating in Bangkok. Proc Natl Acad Sci USA. 2006;103:14234-9. 17. Falcón-Lezama JA, Ramos C, Zúñiga J, et al. HLA class I and II
polymorphisms in 291 Mexican Mestizo patients with dengue fever. Acta Trop. 2009;112:193-7.
18. Plataforma SINAVE/DGEPI/SALUD/Sistema Nacional de Vigi-lancia Epidemiológica. 2013. Available at: www.sinave.gob.mx. [Accessed 1 November 2015].
19. Brathwaite DO, San Martín JL, Montoya RH, del Diego J, Zam-brano B, Dayan GH. The history of dengue outbreaks in the Americas. Am J Trop Med Hyg. 2012;87:584-93.
20. Zambrano B, San Martin JL. Epidemiology of dengue in Latin America. J Pediatric Infect Dis Soc. 2014;3:181-2.
21. Alto BW, Reiskind MH, Lounibos LP. Size alters susceptibility of vectors to dengue virus infection and dissemination. Am J Trop Med Hyg. 2008;79:688-95.
22. Malavige GN, Velathanthiri VG, Wijewickrama ES, et al. Patterns of disease among adults hospitalized with dengue infections. Q J Med. 2006;99:299-305.
23. Rigau-Perez JG, Vorndam AV, Clark GG. 2001. The dengue and dengue hemorrhagic fever epidemic in Puerto Rico, 1994-1995. Am J Trop Med Hyg. 2001;64:67-74.
24. Siqueira JB, Martelli CM, Coelho GE, Simplicio AC, Hatch DL. Den-gue and denDen-gue hemorrhagic fever, Brazil, 1981-2002. Emerg Infect Dis. 2005;11:48-53.
25. Gupta E, Dar L, Narang P, Srivastava VK, Broor S. Serodiagnosis of dengue during an outbreak at a tertiary care hospital in Delhi. Indian J Med Res. 2005;121:36-8.
26. Anker M, Amira Y. Male–female differences in the number of reported incident dengue fever cases in six Asian countries. Western Pac Surveill Response J. 2011;2:17-23.
27. Martín JL, Brathwaite O, Zambrano B, et al. The epidemiology of dengue in the Americas over the last three decades: a wor-risome reality. Am J Trop Med Hyg. 2010;82:128-35. 28. Scott B. Halstead dengue in the Americas and Southeast Asia:
do they differ? Rev Panam Salud Publica. 2006;20:6.
29. Villar L, Dayan GH, Arredondo-García JL, et al. Efficacy of a tetravalent dengue vaccine in children in Latin America. N Engl J Med. 2015;372:113-23.
No part of this publication may be reproduced or photocopying without the prior written permission
of the publisher
.