data-based industrial process monitoring.
Selección de variables guiada por conocimiento
del experto para el monitoreo basados en datos
de procesos industriales
Cesar Uribe, Claudia Isaza*
Department of Electronic Engineering. Universidad de Antioquia. Calle 67 No. 53-108 Bl.19 Of. 426, Medellín, Colombia.
(Recibido el 10 enero de 2012. Aceptado el 6 noviembre del 2012)
Abstract
uncertainty, unpredictability and nonlinear behavior. Rigorous measuring
Therefore, data-based monitoring systems have gain interest in academia and
parameters. When a mechanistic or structural model is not available or suitable, selecting relevant and informative variables (reducing the high dimensionality) eases pattern recognition to identify functional states of the
capable of represent intrinsic historical-data structure integrating the expert
correctly identify the process functional states.
--- Keywords
Resumen
Los procesos industriales se caracterizan por estar en ambientes abiertos, inciertos y no lineales. La medición y monitoreo de estos busca calidad, seguridad y economía en los productos. Los sistemas de monitoreo basados
en datos han ganado un gran interés en la academia y en la industria, pero los procesos industriales tienen grandes volúmenes de datos complejos y de alta
imprecisas y parámetros desconocidos. Cuando un modelo mecánico no está disponible, seleccionar las variables relevantes e informativas (reduciendo la
funcionales del proceso. En este artículo se propone usar el conocimiento del experto como guía dentro de un wrapper de selección de descriptores basado en agrupamiento para reducir el conjunto de variables necesarias para representar la estructura intrínseca de los datos históricos del proceso. Un
el Open Plate Reactor,
correctamente los estados funcionales del proceso.
--- Palabras clave
Introduction
Large volumes of complex and high dimensional
decision support and monitoring systems [1]. Using relevant and informative variables eases
obtained and the sensor cost for the selected process measurements, but a process model is needed.
method based on Hausdorff distance measure in a supervised manner. Fraleigth et al. [6] developed a sensor system selection for model-based real-time optimization. Verron et al. [7] proposed supervised
discriminant analysis and mutual information.
the features responsible for success or failure in the manufacturing process in a supervised context. These methods focus on constructing process
available [9]. Thus, several researchers focused on the development of robust and reliable monitoring systems based on data analysis.
Data-based monitoring systems use measurement's information to identify process behaviors as functional states or classes. Such information
categories and correlations among them. The expert judgment approach may result in an effective
the training set [12]. Real-life applications require the involvement of domain experts to validate the allocation of operating states of the process into classes resulting from clustering. Nevertheless,
desirable due to their inability to examine large
clustering results as similar as the expert data partition maintaining a cluster structure. The method is applied on fault detection and
search, clustering algorithms, clustering quality assessment. Third section details the open plate
Wrapper feature selection guided
variable selection [17], regardless of the chosen learning machine or quality subset criterion [18]. The performance of the induction algorithm guides the search, producing better results than
applications [19].
methodology. Historical data (i.e. database of the N n space, as a set ; N is the number of elements, n is the number of features in the original feature set F n and Fr r r n represented as F
r. The clustering algorithm partitions the data subset into c clusters, optimizing some metric J over the data. Consider the clustering algorithm as Y = J Fr,
Let be the
partition produced by the clustering algorithm and Q(Y , Y) = be the performance function
(e.g. expert and clustering partition). The feature search procedure generates the optimal set of features FOP by testing different forms of the map
r = f
Figure 1 clustering
feature search
Finding the optimal feature subset FOP requires either an exhaustive search that involves the evaluation of 2n subsets (becoming infeasible since n is large) [19] or the monotonicity of a
F0,,,n partitions are obtained using clustering and its quality is computed. First, each feature subset includes only
1 associated
selected variable in the vector v. Each feature that is not yet included in v is included and the quality of the n - 1 partitions is computed. The vector v
These steps are repeated, adding one feature
characteristics is achieved (e.g. the total number of characteristics) or a performance criterion is
full set of features, at each step the features are removed one by one.
Clustering algorithm
Data-based monitoring systems based on
data and group them into classes that correspond to functional states. The term “similarity” should be understood as a mathematical measure of
[image:3.612.315.537.86.180.2]partition is build, a single sample belongs to only one cluster. The fuzzy clustering extends this
different membership degrees.
In this article the Learning Algorithm for Multivariate Data Analysis (LAMDA) is used.
literature for the construction of systems for monitoring industrial processes [14, 16, 17,
overall adequacy level of each individual to each class, called Global Adequacy Degree (GAD). The GAD is the membership degree of each object to each class. Its value is estimated using the contributions of the features based on
the use of traditional distance approximations. The contribution of each descriptor is called the Marginal Adequacy Degree (MAD) and it is computed using a possibility function. The class adequacy concept is expressed as the “fuzzy” truth value of a compound sentence using logical
Attributes can be numeric, symbolic or mixed
descriptors). Also, LAMDA methodology does
as parameter, thus, it is capable of producing a data partition estimating the number of classes based on the data distribution. For a complete description of the LAMDA methodology see [25, 26].
Feature evaluation criteria
Partitions results are evaluated comparing the clustering algorithm and the process expert partition. The expert's partition is not used as
producing partitions similar to the expert proposal,
among data in order to identify similarities in the historical data [27].
The Index of Dissimilarity Idn proposed by Lopez
and it has been recently used to compare partitions of industrial process [14]. The contingency
classes are denoted (a1, a2, … , ai,…, ap)) and B b1 , b2,…, bj,…, br)). The probabilities corresponding to each class and
of A partition and a partition class B are noted as Eq.1:
Pi = P(ai), Pj= P(bi), Pij= P(ai bi) (1)
ai bi is formed by the elements that belong simultaneously to the latter class ai and class bi. The probabilities satisfy Eq. 2:
(2)
The probability of elements belonging to this class ai and class bi
M is the cardinality N and the total number of individuals ordered M(X).
(3)
The Idn is zero only if the contingency matrix is “almost diagonal” or “quasi-diagonalizable”,
compatible or equal modulo zero. The Idn is estimated from the conditional information
A normalized index of dissimilarity
Y and expert partition Y
(4)
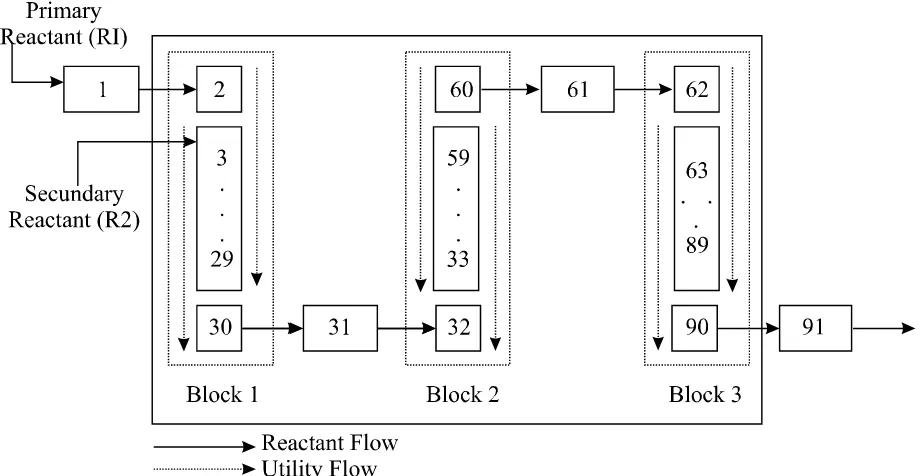
Cases studies: Open Plate Reactor
–OPR
[15]. One side is used as a chemical continuous
R1
R2 can
R2
[image:5.612.77.538.190.428.2]is used to cool (exothermic reaction) or heat (endothermic reaction) the reactor side.
Figure 2
the introduction of the reactants in the reactor at normal temperature [15]. The OPR has 27 available sensor measurements from temperatures and pressures from different cells of the reactor.
Failures in the OPR for the thiosulphate reaction
in the process in the form of disturbances on the main variables: increase and decrease of
secondary reactants and increase and decrease of the compositions of the primary and secondary reactants.
Thiosulphate reaction
highly exothermic.
over the thiosulfate reaction. The database used is composed by the measure of the 27 variables
The reaction scheme is in Eq. 5:
Table 1
Functional State Description Thiosulfate
Description Fluid Variable Id Initial Final Initial Final
Normal 1
F(Uf) Utility 2 m3h m3h 3m3h 1m3h
F(Uf) Utility 3 m3h m3h 3m3h 5m3h
T(Uf) Utility 4 8°C 70°C 60°C
T(Uf) Utility 5 20°C 70°C 80°C
F(R1) 6 m3h 30m3h 15m3h 10m3h
F(R
1) 7 m
3h 50m3h 15m3h 20m3h
T(R1) 8 10°C 20°C 10°C
T(R1) 9 30°C 20°C 30°C
F(R) 10 m3h 5m3h 10m3h 7m3h
F(R) 11 m3h 15m3h 10m3h 13m3h
T(R) 12 10°C 20°C 10°C
T(R) 13 30°C 20°C 30°C
C(R
1) 14
C(R
1) 15
C(R) 16
C(R) 17
sd(Rf) 18 m3h m3h
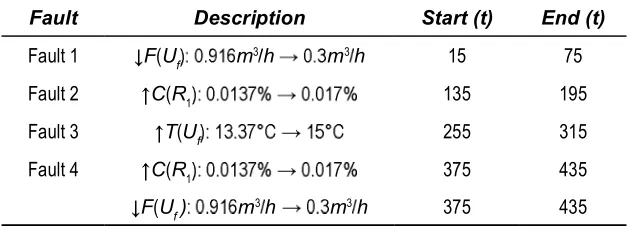
In order to validate the generated model using just the selected subset of sensors (the selected
dataset as described in table 2.
Table 2
Fault Description Start (t) End (t)
Fault 1 F(Uf m3h m3h 15 75
Fault 2 C(R1 135 195
Fault 3 T(Uf 255 315
Fault 4 C(R1 375 435
[image:6.612.149.466.581.694.2]Fault Description Start (t) End (t)
Fault 5 C(R1 495 555
F(Uf m3h m3h 495 555
Fault 6 C(R1 615 675
F(Uf m3h m3h 615 675
T(Uf 615 675
exothermic. To accelerate it, it is necessary to heat the reaction medium. In this case, the utility
have been applied to the reactor. Failures in the OPR are disturbances on the temperatures and C4H8O) secondary
or injected reactant (C6H10O3), cooling system (utility), and composition in primary and secondary reagents, see table 2.
samples described only by the selected feature
[image:7.612.119.494.374.528.2]the test dataset as described in table 3.
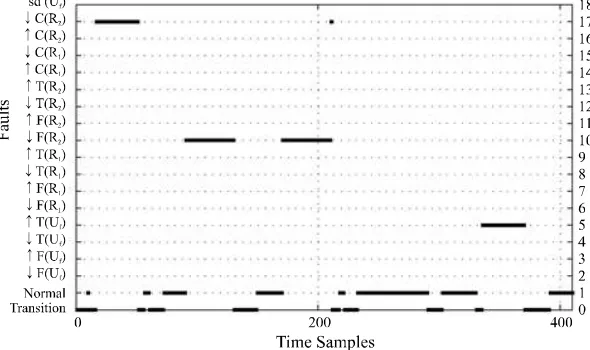
Table 3
Fault Description Start (t) End (t)
Fault 1 C(R2 10 50
Fault 2 T(Uf 90 130
Fault 3 C(R2 170 210
F(R2): 10m3h m3h 170 210
Fault 4 F(Uf): 3m3h m3h 250 290
Fault 5 F(Uf): 3m3h m3h 330 370
T(Uf 330 370
Experimental results and
discussion
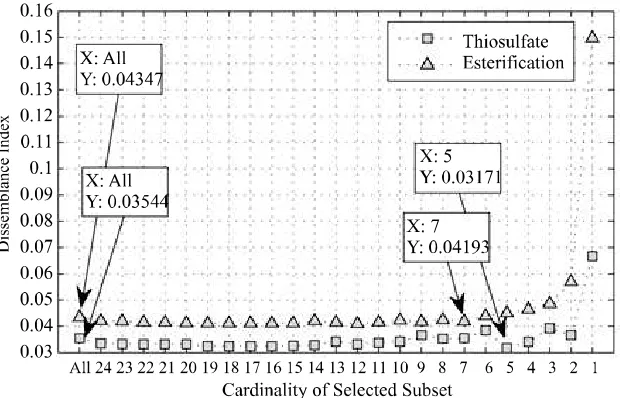
Variables representing input pressures for
since they are constant. Feature selection is applied to the remaining 25 variables. The data Idn value is represented by the set of features that minimize the
the clustering algorithm and the partition proposed
reaction, the feature set
and are selected as
the best set of features reaching Idn = 0.03232 and Idn
sets and
Figure 3
Figure 4
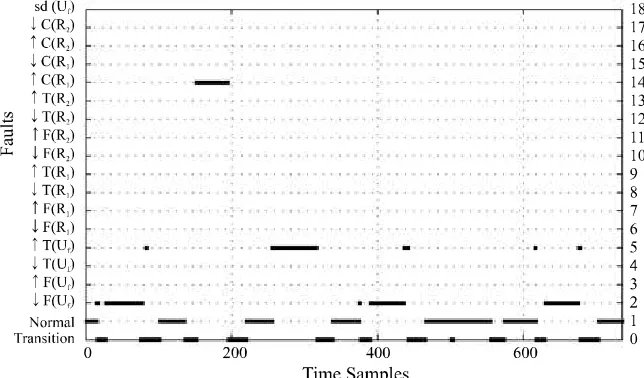
the selected features. The monitoring system
transition class. This class represents a deviation
from the Normal state and it is not included by the process expert. False alarms appears at the end of
T(Uf
[image:8.612.151.461.316.515.2]Figure 5
Figure 6
[image:9.612.155.449.509.681.2]Figure 8
are presented simultaneously. Perturbation 5 is
of both perturbations cancels out. The reactor is
both procedures, SFS and SBE, produce different
is very exothermic, so the impact of such small variation does not affect la reaction. In the SBE search, the second perturbation corresponding to T(Uf
F(R2) this is because a decrease on the utility
Reactant.
[image:10.612.142.464.492.681.2]Figure 10
Figure 11
[image:11.612.157.452.512.687.2]method based on information-theoretic measures
each variable to select the most informative ones.
approaches for unsupervised feature selection.
[image:12.612.102.512.189.303.2]feature selection results on the same process Idn value
Table 4
Author Feature Set Idn
[1, 4, 5, 6, 12, 14, 22, 25, 26] Filter
[1, 7, 25, 9, 6, 21, 20, 8, 10] Wrapper
[6, 8, 1, 7, 25] Wrapper
[1, 22, 7, 8, 24] Wrapper
[24, 8, 7, 22, 1] Wrapper
Table 5
Author Feature Set Idn
[11, 26, 12, 22, 25, 1, 2, 3]
Filter
[5, 14, 4, 6, 1, 2, 27, 3]
Wrapper
Not Available
Wrapper
[5, 14, 2, 1, 22, 18, 20, 15]]
Wrapper
[21, 8, 6, 13, 19, 22, 3]
Wrapper
on data-based industrial process monitoring is
into account the data structure itself. Sequential
algorithm and the Index of Dissimilarity to assess the cluster quality measure comparing the
expert-the Open Plate Reactor (OPR), on expert-the thiosulfate
using relative simple sensor (temperature), even
composition of primary and secondary reactants. First, using a training data set, the subset of feature is selected and a behavioral model is constructed using just the reduced set of features. Then, the
set consisting of perturbations different than those used in training, including simultaneous faults.
[image:12.612.101.511.335.458.2]states of the complex chemical process. The
The main improvement of this methodology is introducing the unsupervised learning and expert guidance in the search process. The use of a non-iterative clustering algorithm leads to fast performance on the search over the feature subset
different methods of feature selection, clustering, cluster quality and partition comparing to
applications.
LAAS/CNRS for the access to the OPR databases.
References
multivariate systems using pattern recognition and multisensor data analysis technique”. Computers & Chemical Engineering. Vol. 25. 2001. pp. 1313-1339.
Extraction: Foundations and Applications” Studies in Fuzziness and Soft Computing. Vol. 207. pp. 1-22.
A comparative evaluation of sequential feature selection algorithms. In Proceedings
Intelligence and Statistics. Springer-Verlag. 1995. Fort Lauderdale. USA. pp. 1-7.
A methodology for optimal sensor selection in chemical processes. Proc.
American Control Conference the 2002. Villanova, Pennsylvania, USA. 2002. pp. 4274-4278.
hausdorff distance”. Inf. Tech. and Management. Vol. 6. 2005. pp. 315-331.
6. L. Fraleigh, M. Guay, J. Forbes. “Sensor selection for model-based real-time optimization: relating design of experiments and design cost”. Journal of Process Control. Vol. 13. 2003. pp. 667-678.
7. S. Verron, T. Tiplica, A. Kobi. “Fault detection and
mutual information”. Journal of Process Control. Vol. 18. 2008. pp. 479-490.
8. M. Bensch, M. Schroder, M. Bogdan, W. Rosenstiel.
Feature selection for high-dimensional industrial data. Proceeding of the European Symposium of
pp. 375-380.
9. T. Kourti. “Process analysis and abnormal situation detection: from theory to practice”. Control Systems Magazine IEEE. Vol. 22. pp. 10-25.
Surveillance de procédées à base de
. Ph.D. dissertation. INSA Toulouse. 2004. pp. 16-20.
discovery”. Data Mining and Knowledge Discovery. Vol. 3. 1999. pp. 409-425.
12. T. Cheng, C. Wei, V. Tseng. “Feature selection for medical data mining: Comparisons of expert judgment and automatic approaches”. Computer-Based Medical Systems. 2006. pp. 165-170.
Mach. Learn. Vol. 38. 2000. pp. 89-107.
14. C. Isaza. Diagnostic par techniques d’apprentissage
d’optimisation des partitions”. Ph.D. dissertation. Laboratoire d’Analyse et d’Architecture des Systèmes du CNRS. Toulouse, France. 2007. pp. 5-23.
C. Gourdon, M. Cabassud. “Selection of sensors by a
and entropy criteria”. Chemical Engineering Research and Design. Vol. 85. 2007. pp. 825-838.
17. C. Uribe, C. Isaza, O. Gualdron, C. Duran, A. Carvajal, A wrapper approach based on clustering for sensors selection of industrial monitoring systems. Proceedings of the 2010 International Conference on Broadband. Wireless Computing, Communication and Applications. Japan. 2010. pp. 428-487.
18. I. Guyon, A. Elisseeff. “An introduction to variable and feature selection”. J. Mach. Learn. Res. Vol. 3. 2003. pp. 1157-1182.
19. S. Guerif, Y. Bennani. “Selection of clusters number
. 2006. pp. 28-33.
of complex systems. The 7th IFAC International Symposium of Fault Detection. Supervision and Safety of Technical Processes. 2009. Barcelona, España. pp. 1132-1137.
state machine”.
Intelligence. Vol. 19. 2006. pp. 461-477.
22. J. Aguilar, C. Isaza, E. Diez, M. LeLann, J. Waissman. “Process Monitoring Using Residuals and Fuzzy
Advances in Soft Computing. Vol. 42. 2007. pp. 275-284
23. C. Isaza, M. Lann, J. Aguilar, Diagnosis of chemical processes by fuzzy clustering methods: New optimization method of partitions. 18th European
Symposium on Computer Aided Process Engineering (ESCAPE 10). 2008. pp. 1-6.
24. A. Orantes. Methodologie pour le placement des
vue du diagnostic. Ph.D. dissertation. Laboratoire d’Analyse et d’Architecture des Systemes du CNRS. 2005. pp. 29-39.
25. J. Aguilar, R. de Mantaras.
and learning the meaning of linguistic descriptors of concepts. Approximate Reasoning in Decision Analysis. 1982. M.M. Gupta et E. Sanchez (eds.) North Holland. pp. 165-175.
26. J. Aguado, J. Aguilar. A mixed qualitative-quantitative
diagnosis. QR’99 The Thirteenth International Workshop on Qualitative Reasoning
pp. 124-128.
Information theoretic measures for clustering comparison: is a correction for chance necessary?
pp. 135.
28. R. Mantaras. “A distance-based attribute selection measure for decision tree induction”. Mach. Learn.. Vol. 6. 1991. pp. 81-92.
29. R. Mantaras. Autoapprentissage d’une partition: application au classement iteratif de donnees multidimensionelles. Ph.D. dissertation. Univ. Paul Sabatier. Toulouse. 1979. pp. 20-37.