NON-LINEAR ACOUSTICS OF RIGID- POROUS MATERIALS
PACS: 43.25.Dc
Attenborough, Keith; Umnova, Olga; Cummings, Alan Department of Engineering,
University of Hull, Hull, HU6 7RX UK
Tel: 44 1482 466600 Fax: 44 1482 466664
E-mail: k.attenborough@hull.ac.uk
ABSTRACT
Models for the propagation of high amplitude continuous sound and pulses in rigid porous materials have been developed allowing for linear dependence of flow resistivity on air velocity. The models require 4 parameters: tortuosity, porosity, flow resistivity and a non-linearity parameter. Predictions have been found to be in good agreement with measurements of admittance at high amplitudes. Good agreement has been obtained, between non-linear theory and data for shock reflection by a 0.15 m thick sample of porous aluminium as a function of incident pressure amplitude, after adjustment of parameters to fit the shock data at the lowest amplitude.
INTRODUCTION
High amplitude harmonic wave propagation in rigid porous media has been subject of study for over a decade [1,2]. Increase in absorption with sound amplitude has been attributed to Forchheimer’s non-linearity which results from the dependence of dc flow resistivity on flow velocity amplitude. If the flow resistivity is assumed to depend linearly on flow velocity, the value of Forchheimer’s non-linearity parameter, ξ, is given by the slope of the resistivity – velocity curve. This is valid for relatively low incident pressure amplitudes. Harmonic generation has been observed also as a result of the hydrodynamic non-linearity of the air in the pores of the material. However it can be shown that the latter effect is relatively weak. In a study of the propagation of acoustic pulses in rigid porous material in the linear regime [3], it has been shown that at low frequencies (i.e. for longer pulses) the evolution follows a diffusion equation, whereas for higher frequencies (shorter pulses) the wave is described by hereditary mechanics. The influence of non-linear 1D step loading on the pore fluid in a semi-infinite rigid porous medium, neglecting inertia effects, has been studied [4]. Good agreement between numerical results and data has been demonstrated.
three-parameter rigid-porous model are compared with admittance data for a hard-backed layer of porous aluminium at low (linear) amplitudes. The theoretical result of including finite amplitude effects in impedance are stated and compared with data for high-amplitude admittance data for rigid-porous layers using properties that have been measured non-acoustically or deduced. In the following section the results are stated of extending the low frequency approximation for pulses previously derived [3] to include Forchheimer’s non-linearity and finite amplitude effects [5] for a semi-infinite porous medium. Predictions are compared with high-amplitude pulse reflection data for a porous aluminium layer and concluding remarks are made.
HIGH-AMPLITUDE ADMITTANCE RESULTS FOR A POROUS MEDIUM WITH FORCHHEIMER’S NONLINEARITY
Consider sound propagation at high-amplitudes in a rigid-framed porous material with porosity
Ω0, tortuosity α, DC flow resistivity σ0 and Forchheimer’s non-linearity parameter ξ. If ρ is
density,
p
is pressure, andv
is particle velocity, then the 1D equations of continuity, momentum conservation and state for the gas in the pores of the material can be written as:). (
, 0 ) (
, ) 1 (
0 0
ρ ρ ρ
ξ σ
ρ αρ
p p
v
v v p
v v v
x t
x x t
=
= ∂ + ∂
+ Ω − −∂ = ∂ + ∂
(1)
The gas in the material is supposed to be adiabatic. Equations (1) imply three-parameter models for the complex density in the linear regime. The relationship for normalised complex density may be written
( )
0 0 0
0 ωρ
σ α ρ
ω ρ
i −
Ω +
= (2).
The expression for (low-amplitude) wavenumber in the material, corresponding to (2) is
( )
α ωρ σ α
ω ω
0 0
1 i c
k
− Ω +
= (3).
Expressions for the linear characteristic impedance and the surface impedance of a hard-backed layer of thickness d follow respectively from,
( )
ω ωρ( ) ( )
ω k ωZ = / and Z
( ) ( )
ω,d = Zωcoth(−ik( )
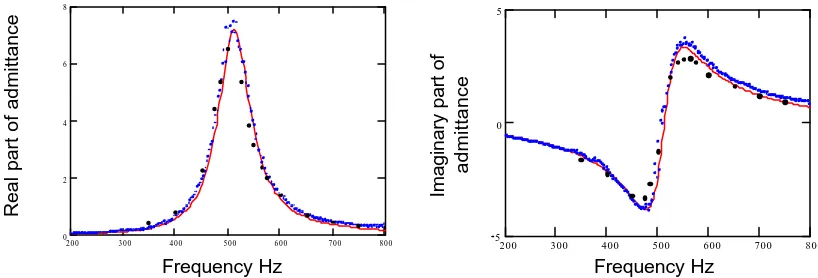
ωd) (4).Comparisons between the predictions of equations (2) and (3) and admittance data obtained at relatively low amplitudes using a two-microphone white noise method with a 0.15 m thick sample of porous aluminium in an impedance tube are shown in Figure 1.
Real part of admittance
2 0 0 3 0 0 4 0 0 5 0 0 6 0 0 7 0 0 8 0 0 0
2 4 6 8
Imaginary part of
admittance
200 300 400 500 600 700 800 5
0 5
[image:2.596.90.499.516.655.2]Frequency Hz Frequency Hz
Fig. 1.- Comparison of predictions for the surface admittance of a 0.15 m thick layer of porous aluminium with data obtained in an impedance tube. The closely spaced dots correspond to data obtained using the two-microphone white noise method. The isolated dots correspond to single frequency measurements and continuous lines correspond to predictions.
Figure 2 shows measurements of flow resistivity for porous aluminium and porous concrete and demonstrates the deduction of the appropriate values of Forchheimer’s non-linearity parameter.
Flow Resistivity, Pa s m
−
2
0.25 0.3 0.35 0.4
700 750 800 850 900
Flow Resistivity, Pa s m
−
2
0.2 0.25 0.3 0.35 0.4 1.4.104
1.6.104 1.8.104 2.104 2.2.104
Flow velocity, m s
−1Flow velocity, m s
−1Fig. 2 - Measurements of flow resistivity (error bars and dots) as a function of flow velocity through porous aluminum and porous concrete. Assuming
σ
=
σ
0(
1
+
ξ
v
)
, the lines shown lead to ξ values of 1 and 1.7 s m−1 respectively.
Solution of equations (1) leads to the following implicit equation for the surface impedance of a layer as a function of incident pressure amplitude, P,
(
)
( )
+ Ω − −
+ Ω − Ω =
P Z ik
mP d
ik P
Z ik
mP ck
P d Z
, 1 1
coth ,
1 2 1
) , , (
0 0
0 0
ω ω
ω
ω (5)
where 3
0 2 0 0
0
2k c
m
ρ ωσ
ξ Ω
= .
To achieve higher pressures than possible with white noise (maximum 20 Pa), single frequency measurements have been made at amplitudes up to 246 Pa. Figure 3 shows data for the reflection coefficient magnitude obtained as a function of incident pressure amplitude using continuous sound. The data are for the specified single frequencies for pulse reflection from 0.15 m thick layers of porous aluminium and concrete. It is interesting to note the measured and predicted tendency for the reflection coefficient of the porous aluminium layer to decrease with increasing pressure at 500 Hz. This tendency differs from that observed at other frequencies with porous aluminium and at a similar frequency for other rigid-porous samples with the same thickness but with lower porosity and higher flow resistivity; for example, porous concrete (porosity 0.3, flow resistivity 120 kPa s m−2, tortuosity 2.2).
Reflection Coefficient 0.6 100 200 300 0.7
Reflection Coefficient 100 200 300
0.2 0.25 0.3 0.35 0.4
Incident Pressure, Pa Incident Pressure, Pa
Fig. 3 - Data (points) and predictions (lines) for the magnitude of the (continuous sound) reflection coefficient for 0.15 m layers of porous aluminium and concrete as a function of incident sound pressure amplitude at 500 Hz and 550 Hz respectively.
porous aluminium
porous concrete
porous aluminium
500 Hz 550Hz
[image:3.596.100.501.541.707.2]RESULTS FOR STRONG SHOCKS
By following the standard procedure [6], in cases where Forchheimer’s non-linearity dominates, equations (1) together with boundary conditions on the rigid surface can be simplified to give a single equation for the velocity v−(t) of the pulse reflected from the surface of semi-infinite material [5]. This has an exact solution in the case of a triangular incident pulse associated with velocity v+(t), i.e.
> ≤ ≤ − = + + + + + , , 0 , 0 , 1 ) ( T t T t T t A t
v (5).
where
A
+ is the incident velocity pulse amplitude andT
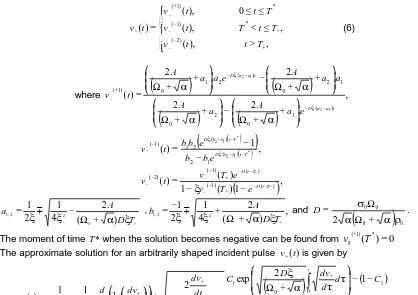
+ is the incident pulse duration. The solution for the velocity associated with the reflected pulse is: > ≤ < ≤ ≤ = + − − + − − + − − , ), ( , ), ( 0 ), ( ) ( ) 2 ( * ) 1 ( * ) 1 ( T t t v T t T t v T t t v t v (6)
where
(
)
( )
(
)
(
)
(
)
( ) , 2 2 2 2 ) ( 1 2 1 2 1 0 2 0 1 2 0 2 1 0 ) 1 ( t a a D t a a D e a A a A a a A e a a A t v − − − − + − + + Ω − + + Ω + + Ω − + + Ω = ξ ξ α α α α ( )( )(
)
( )( )(
)
, 1 ) ( 1 ) ( ) ( , 1 ) ( ) ( ) 1 ( ) ( ) 1 ( ) 2 ( 1 2 2 1 ) 1 ( * 1 2 * 1 2 + + − − + − − − − + − − − − − − − − − − − − = − − = T t D T t D T t b b D T t b b D e T v e T v t v e b b e b b t v ξ ξ ξ + + Ω − = T D A a ξ α ξ ξ ( ) 2 4 1 2 1 0 2 2 ,1 m , ,
) ( 2 4 1 2 1 2 2 , 1 + + Ω + − = T D A b ξ α ξ
ξm and
(
0)
00 0
2 α αρ
σ + Ω Ω = D .
The moment of time T* when the solution becomes negative can befound from (1)( *) 0
0 =
+
T v
The approximate solution for an arbitrarily shaped incident pulse v+(t)is given by
[image:4.596.85.503.248.543.2](
)
(
)
(
)
(
)
(
)
(
)
(
)
. 2 2 ln 2 1 2 1 2 1 where , 1 2 exp 1 2 exp 2 ln 4 1 2 1 ) ( 0 0 0 0 0 0 1 1 0 0 1 1 0 0 1 0 + Ω + + + Ω + = − + + Ω − − + Ω + Ω + − − = = + = + = + = + + + + + −∫
∫
t t t t t t dt dv D dt dv dt d D dt dv D v C C d d dv D C C d d dv D C D dt dv dt dv dt d D t v α ξ α ξ τ τ α ξ τ τ α ξ α ξ ξ ξ (7).Pressure kPa
2 4 6 8 10 12 14
0 20 40
Time ms
Fig. 5 - Example shock tube time series showing incident pulse at 4 ms and overlapping re-flections from the front and back surfaces of a 0.15 m thick porous aluminium sample between 8 and 10 ms.
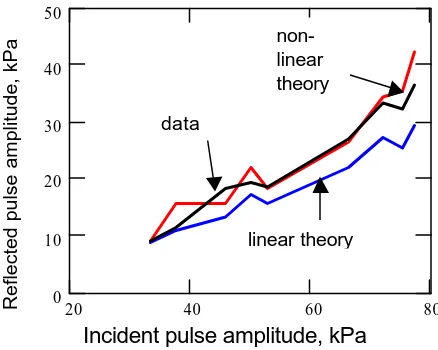
The smallest peak pressure in the shock tube tests is two orders of magnitude greater than the highest pressure achieved in impedance tube measurements. It is to be expected, therefore, that a different value of Forchheimer’s non-linearity parameter is needed to make predictions at such high pressures. Figure 6 compares predictions of both linear (low-amplitude) and non-linear theories with data for the dependence of the amplitude of the pulse reflected from the front surface of the material, which is assumed identical to that reflected from a semi-infinite layer, on the incident pulse amplitude. The flow resistivity and non-linearity parameter required for the linear and non-linear predictions have been fitted to the reflection coefficient data at the lowest shock pressure. The corresponding fitted parameters at lowest incident shock pressure are given by a flow resistivities of 2.8 kPa s m−2 for the linear theory and 0.757 kPa s m−2 for the non-linear theory. The non-linear theory fit to the data point corresponding to the lowest measured shock amplitude results in a non-linearity parameter value of 0.068 s m−1. This is a significantly smaller value than that deduced from Fig. 2.
Reflected pulse amplitude, kPa 20 40 60 80
0 10 20 30 40 50
[image:5.596.200.413.74.251.2]Incident pulse amplitude, kPa
Fig. 6: Comparison of data and predictions for the amplitude reflected from the front surface of a 0.15 m thick porous aluminium layer as a function of the incident pulse amplitude.
Clearly the non-linear theory gives better agreement with the data at higher pressures than the linear one.
data
non-linear theory
[image:5.596.200.419.480.655.2]CONCLUSION
Theories for high-amplitude reflection of continuous sound from rigid-porous layers and for shock wave reflection from a semi-infinite rigid-porous medium, based on a three parameter low-amplitude impedance model and taking into account Forchheimer’s non-linearity, have been validated against data. The data include reflection coefficients from high and low porosity rigid-framed materials subject to continuous high-amplitude sound as a function of frequency and amplitude. Also data and predictions have been presented for shock wave reflection from the surface of a 0.15 m porous aluminium layer as a function of incident pressure amplitude. Further work will involve measurements of Forchheimer’s non-linearity at higher flow velocities and comparison between predictions and data from reflection and transmission measurements on a wide range of porous materials including materials with elastic frames.
ACKNOWLEDGEMENTS
The work is supported in part by USARSDG (UK), contract R7D 8901-EN-01 funded by a Basic Research Grant from the USACE ERDC BT-25 Program. The authors are grateful to Edwin Standley who obtained the shock tube data.
BIBLIOGRAPHICAL REFERENCES
[1] H.L.Kuntz, D.T.Blackstock, “Attenuation of intense sinusoidal waves in air saturated, bulk porous materials”, J.Acoust.Soc.Am. 81, 1723-1731, 1987.
[2] R.F.Lambert, J.D.McIntosh, “Nonlinear wave propagation through rigid porous materials. Pt.1,2”, J.Acoust.Soc.Am. 88, 1939-1959, 1990.
[3] Z.E.A.Fellah, C.Depolier, “Transient wave propagation in rigid porous media: A time domain approach”, J.Acoust.Soc.Am. 107, 683-688, 2000.
[4] J.G.M.van der Grinten, M.E.H. van Dongen, “A shock tube technique for studying pore pressure propagation in a dry and water – saturated porous medium”, J.Appl.Phys., 58, 2937-2942, (1985).
[5] O. Umnova, K. Attenborough and A. Cummings, “High-amplitude pulse propagation and reflection from a rigid porous layer”, Proceedings INTERNOISE 2001, ed. R. Boone, paper IN01/051, 2001