A GENERIC ARCHITECTURE FOR
GEOGRAPHIC INFORMATION SYSTEMS
Tese Doutoral A Coruña, July 2004
Doutorando: Miguel Ángel Rodríguez Luaces Director: Dr. Nieves Rodríguez Brisaboa
Abstract
Geographic information systems (GIS) have been an active research field for decades now, and they aze becoming a very active commercial field due to the increasing demand for interactive manipulation and analysis of geographic information and the exponential improvement in the performance of computer-based technologies. On the other hand, after many yeazs of reseazch and development, it is now generally accepted that the functionality of a generic architecture for information systems must be divided into three separate tiers, namely: presentation tier, application logic tier, and data
tier. Even though this architecture is suitable for GIS applications, the special nature
and exclusive characteristics of geographic information impose special requirements on the azchitecture in terms of conceptual and logical models, data structures, access methods, analysis techniques, and visualization procedures.
The main goal of our work consists in proposing a generic azchitecture for GIS that provides support for the special nature of geographic information and the functional requirements of GIS applications. Our strategy to achieve this goal consists of two steps: (i) we analyze the special chazacteristics of GIS with respect to traditional information systems, (ii) and we adapt the traditional three-tier architecture for information systems to take into account the special characteristics of GIS.
Los sistemas de información geográfica (SIG) han sido un área de investigación muy activa durante décadas, y su aplicación comercial está ganando importancia debido al interés creciente por el análisis y manipulación de información geográfica y el incremento exponencial de la potencia de las sistemas de computación. Por otra parte, tras muchos años de investigación y desarrollo, se acepta que la funcionalidad de una azquitectura genérica para sistemas de información debe estaz dividida en tres capas:
capa de presentación, capa de lógica de aplicación, y capa de datos. Aún cuando
esta arquitectura se puede aplicar a aplicaciones de SIG, la naturaleza especial y las cazacterísticas exclusivas de la información geográfica imponen requisitos especiales en la arquitectura con respecto a modelos conceptuales y lógicos, estructuras de datos, métodos de acceso, técnicas de análisis, y procedimientos de visualización.
Nuestro objetivo principal es proponer una azquitectura genérica para SIG que tenga en cuenta la naturaleza especial de la información geográfica y los requisitos funcionales de las aplicaciones de SIG. Nuestra estrategia para conseguirlo consiste en: (i) analizar las características especiales de los SIG con respecto a los sistemas de información tradicionales, (ii) y adaptar la azquitectura tradicional de sistemas de información en tres capas para tener en cuenta las características especiales de los SIG.
Acknowledgements
I am very grateful to Nieves R. Brisaboa for letting me work six years under her supervision at the Database Laboratory of the University of A Coruña, and above all, for trusting me all these years. I am also grateful to Jose Ramón Paramá for his constructive criticism that has raised the quality of this work. I will never forget my colleagues at the Database Laboratory of the University of A Coruña: J.R., Fari, Fran, Eva, Ángeles, Tony, Jose, Miguel, Raquel, Cris, y mon. They have made the idea of going every day to work appealing. I am also very grateful to the people that worked on the EIEL project, particulazly to Cazmen García and to Alberto Vazela, because together we have achieved something great.
I am also very grateful to Prof. Dr. Ralf Hartmut Giiting for giving me the first opportunity to start this work, and for his help and support during the two-year period that I worked under his supervision in Germany. I will never forget my colleagues and friends in Germany and all the things they did for me. Particulazly, Stefan Dieker and our productive discussions regarding work and life in general, Anne Jahn, because without her my life in Germany would have been much more complex, and Thomas Meilwes, who taught me to appreciate the German culture and language, and at the same time, the Spanish ones.
But above all, I want to thank my pazents, Andrés and Mazi, because without their support, patience, and love, I would never have reached this goal. I will never forget either the confidence and the support of Paco and Maruchi, who have taken care of ine as if I was another son.
Gracias a Nieves R. Brisaboa por permitirme trabajar bajo su dirección estos seis años en el Laboratorio de Bases de Datos, y sobre todo, por la confianza depositada en mí. También le estoy agradecido a José Ramón Paramá por su crítica constructiva que ha elevado la calidad de este trabajo. Nunca olvidaré a mis compañeros del Laboratorio de Bases de Datos de la Universidade da Coruña: J.R., Fari, Fran, Eva, Ángeles, Tony, Jose, Miguel, Raquel, Cris, y mon. Ellos han conseguido que me apetezca ir a trabajar cada día a Coruña. También estoy agradecido a toda la gente que trabajó en la EIEL, sobre todo a Carmen García y a Alberto Varela, porque juntos hemos conseguido algo estupendo.
También quiero agradecer a Ralf Hartmut Giiting haberme dado la primera oportunidad para comenzaz este trabajo, y la ayuda y el apoyo que recibí durante los dos años que estuve trabajando junto a él en Alemania. Nunca olvidazé mis compañeros y amigos de Alemania, ni todo lo que hicieron por mí. En pazticulaz, a Stefan Dieker y nuestras productivas discusiones acerca del trabajo y la vida en general, a Anne Jahn, ya que sin ella mi vida en Alemania hubiera sido infinítamente más difícil, y a Thomas Meilwes por enseñarme a apreciar la cultura y la lengua alemana, y con ello, también la cultura y la lengua española.
Pero sobre todo, quiero dar las gracias a mis padres, Andrés y Mari, porque sin su apoyo, paciencia y cariño no habría llegado hasta aquí. Nunca olvidaré tampoco la confianza y la ayuda de Paco y Maruchi, que me han cuidado como a un hijo más.
Contents
1 Introduction 1
1.1 Background and Motivation . . . 1
1.2 Scope of the Thesis . . . 5
1.3 Thesis Outline . . . 7
2 Special Characteristics of Geographic Information 9 2.1 Introduction . . . 9
2.2 Basic Concepts . . . 10
2.3 Geographic Information Management . . . l3 2.3.1 Introduction . . . l3 2.3.2 A Conceptual Model for Geographic Information ... 15
2.3.3 A Logical Model for Geographic Information ... 21
2.3.4 Physical Model . . . 28
2.3.5 Summary . . . 30
2.4 Geographic Information Processing . . . 3l 2.4.1 Geographic Operations . . . 3l 2.4.2 Geographic Problem-solving . . . 34
2.4.3 Computational Performance . . . 36
2.4.4 Summary . . . 36
2.5 Data Presentation . . . 37
2.5.1 A Metaphor for Visualizing Geographic Information ... 38
2.5.2 Interaction with Geographic Information . . . 43
2.5.3 Summary . . . 46
2.6 System Architecture . . . 47
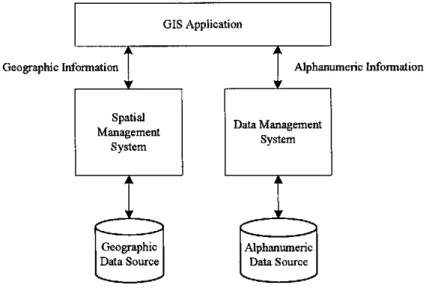
2.6.1 Architecture Types for Data Management . . . 47
2.6.2 Architecture of the System . . . 52
2.7 Metadata for Geographic Information . . . 54
2.8 Customization for GIS . . . 55
2.9 Temporal GIS and Spatio-temporal Databases . . . 56
3.2 Background and Motivation . . . . . . 60
3.3 The OGC and ISO Tazget Architecture . . . . . . 61
3.4 S[andards for Representing and Manipulating Geographic Information 64 3.4.1 Conceptual Model for Geographic Information ... 64
3.4.2 Logical and Physical Model for Geographic Information ... 74
3.4.3 Geography Mazkup Language . . . 77
3.4.4 Metadata and Feature Cataloguing . . . 79
3.5 Data Services for Geographic Information . . . . 83
3.5.1 Web Feature Service . . . . . . 84
3.5.2 Web Coverage Service . . . 87
3.6 Portrayal of Geographic Information . . . . 88
3.6.1 Basic Web Map Service . . . . . . 89
3.6.2 Styled-Layer Descriptor Web Map Service . . . 91
3.7 An Analysis of the OGC and ISO Proposals . . .
94
3.8 Summazy ... 97
4 A Generic Architecture for Geographic Information Systems 99 4.1 Introduction . . . 99
4.2 Requirements for the Architecture of a Geographic Information System 100 4.3 Architecture Overview . . . 102
4.3.1 Description of the Architecture . . . 102
4.3.2 Internal Architecture of the Tiers . . . 104
4.3.3 Chazacteristics of the Architecture . . . 107
4.4 Components of the Data Tier . . . 109
4.4.1 The Mediator Layer . . . 109
4.4.2 The Data Sources Layer . . . 113
4.4.3 The Data Services Layer . . . 115
4.5 Components of the Application Logic Tier . . . 115
4.5.1 Services for GIS Applications . . . 116
4.5.2 Service Chaining . . . 117
4.6 Components of the Fresentation Tier . . . 119
4.6.1 Portrayal Layer . . . 120
4.6.2 Map Display Layer . . . 122
4.6.3 Client Functionality Layer . . . 123
4.7 Building Specific Applications . . . 124
1X
5 The EIEL Project
127
5.1 Introduction . . . 127
5.2 The EIEL Project . . . 128
5.3 The EIEL Application Schema . . .
130
5.3.1 TerritorialInformation . . . 131
5.3.2
Road Network . . . 134
5.3.3 Waste Disposal and Street Lighting . . . l 36 5.3.4 Water Distribution Network . . . 138
5.3.5
Sewage Disposal . . .
140
5.3.6
Equipment . . . 143
5.3.7 Background Information . . . 144
5.4 The EIEL Project Workflow . . . 145
5.4.1 Application for the Creation of the Database ... 147
5.4.2 Applications for the Exploitation of the Database ... 155
5.4.3 SIGEIEL: Maintenance of the Database . . . lS5 5.5 WebEIEL: Web-based Exploitation Application . . . l56 5.5.1 The WebEIEL User Interface . . . 156
5.5.2 System Architecture . . . 16l
5.6 Summary . . .
l63
6 Problems of GIS Development Tools 165 6.1 Introduction . . . 1656.2 Comparison of the Architectures . . . 166
6.3 General Description of the Problems of GIS Development Tools ... ] 69
6.3.1 Generic Analysis of GIS Development Tools ... l70 6.3.2 Examples in WebEIEL . . . 171
6.4 Analysis of the Data Tier . . . l71 6.4.1 Common Problems in GIS Development Tools ... 17l
6.4.2
Examples in WebEIEL . . . 174
6.5 Analysis of the Application Logic Tier . . . 175
6.6 Analysis of the Presentation Tier . . . l76 6.6.1 Portrayal Layer . . . 176
6.6.2 Map Display Layer . . . 178
6.6.3 Client Functionality . . . 178
6.6.4 Problems Identified in WebEIEL . . . 179
6.7 Summary . . . ] 80
7 Conclusions and Future Work 181 7.1 Summary . . . . . . 18l 7.2 Future Work . . . 182
A International Standards 195
B Publications 197
B.1 Publications . . . 197
B.1.1 International Conferences . . . 197
B.1.2 National Conferences . . . 198
B.1.3 Journals and Book Chapters . . . 198
B.2 Research Stays . . . 199
C Descripción del 1^abajo Presentado 201 C.1 Introducción . . . 201
C.2 Metodología Utilizada . . . 205
List of Figures
1.1 Three-tier Information System Architecture . . . 2
1.2 Towards a Generic Architecture for GIS . . . 5
2.1 The Modeling Process . . . 14
2.2 Models in an Information System . . . . . 14
2.3 Object-based Geographic Information . . . . . ] 6
2.4 Field-based Geographic Information . . . . l7 2.5 Examples of Object-based Data Abstractions . . . . l7 2.6 More Examples of Object-based Data Abstractions. . . 18
2.7 An Example Representation of a Conceptual Model. ... ] 9
2.8 Tessellation Model . . . . 21
2.9 Vector Model . . . 22
2.10 Representation of a Field-based Model . . . . . . 23
2.11 Representation of an Object-based Model . . . 24
2.12 Weak Type Systems vs. Strong Type Systems . . . 27
2.13 Storage Representation of Attribute Values . . . 28
2.14 Storage Representation of a Disk Tuple . . . 29
2.15 Storage Representation of a Geometry Collection. . . 29
2.16 A Geographic Feature and a Cartographic Object. . . . . . 40
2.17 An Overload of Geographic Information in a Map. . ... 42
2.18 Hybrid Architecture . . . . . . . 48
2.19 Layered Architecture . . . . . . . . 49
2.20 Extensible Architecture . . . . . . S l 3.1 OpenGIS Logical Architecture . . . . . 63
3.2 Models in an Information System . . . . . . . 65
3.3 Feature Types Classifying Feature Instances . . . . . . 67
3.4 Features Representing Real-World Phenomena . . . 68
3.5 Inheritance Relationship . . . . 71
3.8 Simple Feature Geometry Model . . . 75
3.9 Conceptual Model For GML . . . 78
3.10 Conceptual Model For a Feature Catalogue . . . 80
3.11 Associating Metadata to Information Elements . . . 81
3.12 Conceptual Model for SLD . . . . . 91
3.13 Definition of a User Style in SLD . . . 93
3.14 OGC Services in the Architecture of a GIS . . . 96
4.1 A Generic System Architecture for GIS . . . 103
4.2 Software Layers in the Architecture . . . 105
4.3 Different Implementations of the Generic Architecture. ... 108
4.4 Architecture of the Data Tier . . . 110
4.5 Architecture of the Application Logic Tier . . . 116
4.6 Architecture of the Presentation Tier . . . 119
5.1 Geometry Types . . . 132
5.2 Territory . . . . 133
5.3 Road Network . . . 135
5.4 Waste Disposal and Street Lighting . . . 137
5.5 Water . . . 139
5.6 Water Equipment . . . . 141
5.7 Sewerage . . . . 142
5.8 Equipment . . . . 143
5.9 Background .. . . . 145
5.10 Development Process Workflow . . . 146
5.11 Geographic Data Input Module . . . . 150
5.12 Alphanumeric Data Input Module . . . 152
5.13 Information Linkage Module . . . . 153
5.14 Validation Module . . . 154
5.15 WebEIEL: HomePage . . . . . . . 158
5.16 WebEIEL: Map Window . . . . . . . 158
5.17 WebEIEL: Map Navigation . . . . . . 160
5.18 WebEIEL: Synthetic Map Window . . . . 160
5.19 System Architecture for the EIEL GIS . . . 162
6.1 Software Layers of our Architecture Proposal . . . . 167
6.2 Software Layers of WebEIEL . . . . . . l68 6.3 Architecture of the Data Tier . . . 172
6.4 Architecture of the Application Logic Tier . . . 175
6.5 Architecture of the Presentation Tier . . . . 177
C.1 Arquitectura de Sistemas de Información en Tres Capas. ... 203
Chapter 1
Introduction
1.1 Background and Motivation
Geographic information, in the form of paper maps, has been a driving force behind the progress of our society for many centuries. Until a few decades ago, manipulating, synthesizing and representing geographic information was restricted to paper maps and these tasks were limited to manual, non-interactive processes. The exponential improvement in the performance of computer-based technologies and the increasing demand for interactive manipulation and analysis of geographic information have created a need for geographic information systems (GIS).
Many definitions for the term GIS have been proposed in the literature, each considering the functionality of the system from different perspectives. All of them focus on three different aspects:
1. a GIS is a collection of computer tools to perform geographic analysis and
simulations [LT92, BM98, RSVO1],
2. a GIS is supported by a set of data structures and algorithms to represent,
retrieve and manipulate geographic information [Wor95, RSVO1],
3. and a GIS is a utility that helps people make decisions in tasks related to geography [LGMROl, HA03].
We can extract our own definition from these ones by saying that a GIS is a computer-based system to efficiently model, capture, store, manipulate, guery, retrieve,
analyze and visualize information, where part of the information is of a geographic nature.
An important chazacteristic of geographic information systems is that they aze more than tools to produce paper maps. Whereas in traditional cartography the paper map is the database, in a GIS the map is only a projection of a pazticulaz view of a geographic database at a given time. This enables the GIS end-user to review an unlimited number of analysis alternatives, and to make maps from different points of view emphasizing different aspects of the information [BM98]. As a consequence, functional requirements for GIS are vast and go faz beyond those of traditional information systems. For instance, public administration and mazket analysis applications require integrating and displaying data at different levels of resolution, fleet management applications need path-finding operations in transportation networks, and environmental information systems dealing with terrain analysis need data interpolation.
Figure 1.1: Three-tier Information System Architecture.
3
1.1. Background and Motivation
the architecture of general-purpose information systems must consist of three separate tiers, namely: the presentation tier, the application logic tier (or business logic tier), and the data tier (see Figure 1.1). The main advantage of this architecture is that it enforces a strict separation of the functionality of the system into three different modules that interact only at interfaces. This enables a developer to modify each one of these modules of the application with little impact on the others. Therefore, this architecture provides increased performance, flexibility, maintainability, reusability and scalability. For instance, if the relational data model is used in the data tier of a general-purpose information system, it is possible to use any relational database management system (DBMS) as data source with little impact to the application.
Even though the three-tier architecture for general-purpose information systems is suitable for GIS, the special nature and exclusive characteristics of geographic information impose special functional requirements on the architecture of GIS applications in terms of conceptual and logical models, data structures, access methods, analysis techniques, and visualization procedures. For instance:
• Special data types and operations are needed to represent and manipulate geographic information. The data types available in logical models for traditional information systems are suitable for representing business information such as numbers, texts, or dates. However, the representation of geographic information on a computer requires new data types such as
point, curve or surface. Similarly, the operations provided by logical models
for traditional information systems manipulate values of business data types (e.g., arithmetic operations, or basic string processing). In order to manipulate geographic information, new operations are required (e.g., distance, direction, or
intersection).
• Geographic information requires many different analysis and visualization procedures. There is a rich set of analysis techniques applicable to geographic information that require special transformation and analysis procedures including path finding algorithms in topological spaces, terrain
analysis, or geographic data interpolation. Moreover, given that geographic
information requires specific data types and operations for its representation and manipulation, new visualization techniques are also required to display values of these new data types and results from these operations.
• Geographic information is typically voluminous with a naturally imposed hierarchical structure. Whereas the representation of traditional business data requires few storage bytes, the representation of geographic data requires lazger amounts of storage space. For instance, to represent the border of a country, thousands of pairs of real numbers are needed. This implies that efficient storage representations, access structures, and operation algorithms must be defined for geographic information. Furthermore, the special nature of geographic space imposes relationships and a hierazchy between spatial values that do not exist in other data domains. For instance, roads aze related by a connection relationship and buildings in a city are related by a containment relationship to the city block in which they are. These relationships aze important and must be represented in the system.
• Geographic information processing is characterized by transactions that are much longer than a typical standard relational database transaction. T'his follows from the previous chazacteristic. Given that geographic information is voluminous, the creation and modification of geographic data requires much more time than the same tasks for traditional business data. Therefore, long transactions aze required to keep the data locked for a longer period of time.
• There are two dijj`erent conceptual views of geographic space. It is widely recognized that geographic space may be conceptualized in two distinct ways: using field-based models or using object-based models. Field-based models represent geographic information as collections of spatial distributions where each distributión may be formalized as a mathematical function from a spatial framework to an attribute domain. In these models, the geographic space is considered as an element existent in itself that has properties associated to each location. On the other hand, object-based models represent geographic information as discrete and identifiable entities that consist of a collection of attributes that describe the properties of a real-world phenomenon using alphanumeric and geometric values. These models consider the geographic space as a container for objects that have properties associated. Each view is conceptually different and needs to be represented in a conceptual model with different abstractions.
• Each conceptual view of space can be represented in many different ways in a computer. First, the logical models for traditional information systems do
1.2. Scope of the Thesis S
These and other features impact the overall azchitecture of a GIS. Therefore, it is very important to determine the special requirements of GIS and the functionality that must be provided by GIS beyond the standazd requirements and functionality of a general-purpose information system. This will enable us to design and implement a GIS with appropriate capabilities for modeling, collecting, querying, and visualizing geographic information.
1.2 Scope of the Thesis
The main goal of our work is a proposal of a generic architecture for geographic information systems that provides support for the special characteristics of geographic information. Our strategy to achieve this goal consists of two steps (see Figure 1.2):
• First, we analyze the special chazacteristics of geographic information that impose particular requirements over the design of the azchitecture of GIS applications.
• Then, we adapt the traditional three-tier architecture for general-purpose information systems to take into account the requirements extracted in the previous step.
Traditional Architecture for Architecture for Commercial
Information Systems GIS
Flexible and Special
Generic Chazacteristics
Architecture of Geographic
Information
Generic Architecture for GIS
This strategy enables us to design an azchitecture for GIS that keeps the benefits of the traditional three-tier azchitecture for general-purpose information systems while providing support for the special requirements of geographic information. GIS applications developed using this azchitecture inherit and enjoy important properties that aze already present in the architecture of general-purpose information systems (e.g., interoperability, flexibility, generality, reusability, or scalability). The most important properties of the azchitecture proposed aze its fíexibiliry (i.e., the azchitecture can be adapted to support applications in many different technological environments), and its generality (i.e., the architecture can be used for multiple applications with different and specific purposes). At the same time, these GIS applications take into consideration the particulaz requirements of geographic information with respect to the azchitecture of the system. In order to achieve these goals, each component of the azchitecture must be described precisely, and illustrated by research results, existing standards, or commercial applications, as appropriate.
There have been many research and industrial efforts to standardize many aspects of GIS technology, particulazly by the OpenGIS Consortium (OGC) and the ISO Technical Committee 211 (ISO/TC 211, Geographic Information/Geomatics). Their long-term goal is the full integration of geospatial data and geoprocessing resources into mainstream computing and the widespread use of interoperable geoprocessing software and geodata products throughout the information infrastructure^ [OGC99c, IS002a]. These goals overlap with the main goal of our work, and therefore it is indispensable that we review thoroughly the OGC and the ISO proposals. We point out in this review the strengths of the standards and implementation specifications proposed by these organizations, and we also describe and analyze the drawbacks of these proposals. Finally, we describe the solutions adopted in our proposal to overcome these drawbacks while conforming with the standards where aze available.
1.3. Thesis Outline 7
1.3 Thesis Outline
In this section, we describe the structure of this document. First, in Chapter 2 we analyze the special features of geographic information that impose requirements on the azchitecture of GIS beyond those common to general-purpose information systems. These features involve all levels of the information system, from data management to data presentation.
Then, in Chapter 3, we review the OGC and ISO proposals of standards for representing and manipulating geographic information. We also point out in this review the benefits and drawbacks of these proposals.
In Chapter 4, we present first a summary of the requirements for the architecture of general-purpose information systems, and we enumerate the requirements for the architecture of a GIS, which are extracted from the special characteristics of geographic information described in Chapter 2. Then, we introduce our proposal for a generic azchitecture for GIS that fulfills these requirements, and we present a detailed description of the components in the azchitecture and their interactions. Finally, we also compare our architecture to the OGC proposal and we analyze the improvements that our approach enables.
In order to show our experience in the development of a GIS that follows our generic azchitecture proposal, we describe in Chapter 5 the development of a GIS for the Provincial Council of A Coruña. We first give the background and motivation for the development of this GIS, and then we present the application schema and the workflow that was followed to build the GIS. Finally, we show the applications that were developed for the GIS, paying special attention to the web-based data exploitation tool.
Then, Chapter 6 is devoted to the evaluation of the differences between the proposed azchitecture and the implemented GIS application. These differences are caused by the limitation of commercial GIS development tools, and we analyze the consequences of these limitations.
Special Characteristics of
Geographic Information
2.1 Introduction
GIS researchers and practitioners have always assumed the existence of differences between general-purpose information systems and geographic information systems. However, we believe that it is necessary to analyze in a detailed way the special requirements that geographic information imposes on the architecture of general purpose information systems in order to define a generic architecture for GIS applications that takes these requirements into account.
This chapter presents the first contribution of this work: a systematic analysis of the different aspects where GIS applications have different needs with respect to general purpose information systems.
10 Chapter 2. Special Characteristics of Geographic Informa[ion
2.2 Basic Concepts
Geographic information has been an important and active reseazch field since the early times of computer science because a lot of human activities and decisions involve a geographic component. This reseazch area has involved much effort because geographic information has many pazticulaz characteristics that make it different from traditional business information. As an example, whereas the information of an employee in a traditional information system can be represented with simple values like numbers and integers, the geographic information associated to a meteorological model is much more complex. In order to provide efficient storage and manipulation of geographic information, the architecture of the information system must be adapted to accommodate the special nature and exclusive chazacteristics of geographic information and the requirements that emerge from the functionality required to the system.
In this chapter, we analyze the chazacteristics of geographic information which are peculiaz to it, and we describe the requirements that they impose on the design of the architecture of a GIS. The first point of view that can be used to discover these requirements consists of an analysis of the functionality that must be provided by any GIS application. This functionality can be classified as follows (according to [BM98]):
• Data input and verification. This concerns all aspects of capturing geographic
data, verifying their correctness and converting them to a common digital form.
• Data storage and management. It covers the structure and organization of geographic information both in terms of the way in which it is perceived by the user (i.e., conceptual modet) and the way in which it is handled in the computer (i.e., logical model and physical model).
• Data transformation and analysis. This functionality consists of the processes
of editing the information to keep it up to date or to remove errors. Data analysis is one of the main tasks of GIS, and concerns the application of analysis methods to the information to achieve answers to the questions asked to the GIS.
• Data output and presentation. The functionality of producing maps and map
based material is a highly distinctive feature of GIS compared with a general purpose information system. Together with the analysis techniques, this is the aspect that differs the most from traditional information systems.
it in the data management system. Furthermore, if the data already exist, they may be in a different format or referenced to a different reference system. Therefore, the system must include procedures to integrate these data in the data model of the application. Finally, it is necessary that the system provides methods and tools to check for correctness, integrity and consistency of any new data before they enter the system.
Regazding data storage and management, traditional information systems are not suitable for representing geographic information. Conceptual models for general purpose information systems (e.g., the entity-relationship model) do not have constructs to model application schemas that deal with geographic information. Furthermore, logical models (e.g., the relational model) are strongly geazed towazd business applications that manipulate large but simple data sets, and do not include functionality to represent geographic information. The data types of logical models for traditional information systems are suitable for representing simple information such as numbers, texts, or dates. However, the representation of geographic information on a computer requires new data types such as point, curve or surface, or collection types such as point collection, line collection, surface collection or geometry collection. Similarly, the operations provided by logical models for traditional information system manipulate simple values. New operations aze required to manipulate geographic information (e.g., distance, direction, or intersection). Finally, physical models for traditional information systems aze unable to represent efficiently geographic information. Summarizing, traditional information systems must also be extended at all levels from the conceptual model to the physical model to represent geographic information adequately. Section 2.3 describes these issues in more detail.
Considering data transformation and analysis, there is a rich set of analysis techniques applicable to geographic information that require special transformation and analysis procedures (e.g., path finding algorithms in topological spaces, terrain
analysis, or geographic data interpolation). These techniques must be supported by
primitive operations defined on the data types that represent geographic information, for instance: geometric operations (e.g., distance, bearing), topological operations (e.g., adjacency, connectivity) or set-oriented operations (e.g., intersection, di,^erence). Furthermore, computational efficiency is an important requirement for these analysis techniques. This implies that efficient physical representations for geographic data, efficient access structures for fast data retrieval, and new algorithms for query processing must be defined. Section 2.4 provides more detail on these aspects of geographic information.
Finally, the chazacteristics of geographic information that make the process of presenting geographic information to a final user so distinctive in GIS applications aze presented in Section 2.5. However, we can summarize these characteristics here as follows:
12 Chapter 2. Special Characteristics of Geographic Information
transformation and analysis procedures. Therefore, the user-interface of the GIS application must be prepazed to enable the user to invoke these procedures and to visualize their results. For instance, the user interface must provide tools to draw geographic values to be used as pazameters for queries.
• Geographic information needs difj`erent visual representations according to different display parameters. Unlike values from traditional data types like
number or string, a value from a geographic data type is complex and it must
be displayed with appropriate detail at different scales. For instance, the border of a city may be represented as a complex polygon at a lazge scale map, as a polygon with less detail at a medium scale map because the resolution of the display device may not allow to display all the detail of the complex polygon, and as a point at a small scale map.
In addition to the requirements that emerge from having to implement this functionality, there aze other requirements that arise from the special nature of geographic information:
• Geographic information is characterized by its large volume and its intrinsic complex structure. This has two important consequences:
- The large volume of geographic data values must be taken into account in the design of the architecture of GIS applications. Efficient data manipulation and transmission procedures between the components of the architecture must be designed and implemented. Moreover, the azchitecture of GIS applications is also lazgely affected by the need for new conceptual and logical models for geographic information. These issues aze described in more detail in Section 2.6.
- The volume and complexiry of geographic information causes metadata to be more important than in general-purpose information systems.
Appropriate metadata for geographic information is essential for its efficient use by end-users and applications. Section 2.7 is devoted to this topic.
• The different rypes of analysis that may be performed by end-users are not limited. No logical model for GIS applications can aim at providing a complete
set of analysis operations. Therefore, the system must provide some primitive functionality that covers as much ground as possible, and offer the possibility to be extended by developers to implement advanced specific functionality (i.e.,
customization). This topic is further described in Section 2.8.
. The time component of geographic information has often been neglected in research and commercial tools. However, reseazch and tools supporting dynamic
domains such as meteorology or fleet management. T'his has changed in the last years and a new research area has emerged named spatio-temporal
databases. These research results are slowly being added to commercial systems.
Section 2.9 briefly reports on these advances.
2.3 Geographic Information Management
2.3.1
Introduction
The phenomena that can be observed in the real world cannot be represented as such in a computer because the real world is infinitely complex and the storage space and the representation power of a computer are limited. Therefore, it is necessary to define
models to represent real world information in a form that is suitable for a computer. A
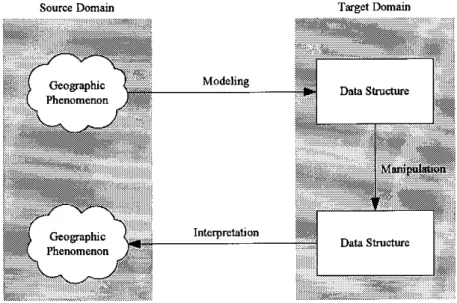
model is an artificial construction in which parts of a domain (i.e., the source domain) are represented in another domain (i.e., the target domain). A model allows developers to simplify and to abstract from the source domain by representing its elements with elements of the target domain. Processes that take place in the source domain can also be represented with operations on elements on the target domain. This allows the user of the model to simulate these processes and predict their outcome by applying operations on elements of the target domain and interpreting the results in the source domain. For the particular case of geographic information, the source domain consists of real world geographic phenomena, and the target domain consists of data elements that are stored in a computer. Manipulation algorithms and visualization techniques are applied upon the data on the computer, and the results are then interpreted as real world geographic phenomena (see Figure 2.1).
Two models are used in the development of a general-purpose information system:
a conceptual model and a logical model (see Figure 2.2). A conceptual model (also
called abstract model) is used to classify, identify and represent the phenomena of the real world in order to communicate it to other users or to the computer. However, a conceptual model cannot directly be represented in a computer system because it does not take into account the representation limitations of computer systems. For instance, geographic values are considered as infinite point sets with infinite resolution in the conceptual model, which cannot directly be represented using the limited precision of computer arithmetic. In order to represent phenomena of the real world in a computer, it is necessary to build a logical model (also called discrete model) that adapts the conceptual model to take into account the representation limitations of computer systems. Continuing with the same example, a logical model for geographic information represents the geographic values of the conceptual model using linear approximations of curve segments and surface borders.
14 Chapter 2. Special Characteristics of Geographic Information
Source Domain Tazget Domain
Figure 2.1: The Modeling Process.
Real-World
Phenomena
represented in a I
Conceptual Application Schema
implemented in a
using abstractions
, from /
represented
using
^using abstractions
from / Logical
Application Schema
represented using
Conceptual Model
Fortnal Schema Language
Logical Model
Formal Schema Language
is nowadays being replaced by the model defined by the Unified Modeling Language (UML) [BRJ98]. The logical model used to represent these models is often the relational model [Cod70]. Nonetheless, object-oriented models have also been used in domains where relational DBMS were not appropriate [Ban88]. Nowadays, the relational model has been extended to incorporate concepts from object-oriented models such as behaviour associated to the basic data abstractions [SM96].
These models cannot be used to represent geographic information because they aze strongly geared towards business applications. New conceptual models and logical models aze necessary. This has been a central issue in the reseazch of GIS for many yeazs [Gñt94, SCR+99]. In the following sections, we describe how geographic information can be represented in a computer system. First, we describe in Section 2.3.2 the chazacteristics required by a conceptual model for geographic information. Then, the characteristics of a logical model for geographic information are analyzed in Section 2.3.3.
2.3.2 A Conceptual Model for Geographic Information
A conceptual model for geographic information must capture two different aspects of reality. First, it must provide constructs to represent spatial and geographic data
values. Given that the traditional data abstractions (e.g., number, string, or date) cannot
efficiently be used to represent geographic information, it is necessary to define a model with data abstractions for the representation of the geographic component of real-world phenomena such as the course of a river, the temperature values at noon in a country, or the division of a country into parcels that are owned by people. This model is often called geographic data model or spatial data model.
Secondly, the conceptual model must provide constructs to describe the data schema of an application that manipulates geographic information. This is often referred to as the geographic application schema. We will describe the requirements of each part of the conceptual model separately.
Conceptual Representation of Geographic Values
The conceptual model for geographic values must provide data abstractions for the representation of geographic space. It was recognized at an eazly stage in the development of GIS technology that geographic space may be conceptualized in two distinct ways [Chr75, Chr78]: space can be considered as an element existent in itself that has properties associated to each location, or it can be considered as a container for objects with properties associated. Each point of view has originated a different family of spatial data models, namely field-based models and object-based models.
16
Chapter 2. Special Characteristics of Geographic InformationFigure 2.3: Object-based Geographic Information.
properties. Figure 2.3 shows an example of object-based geographic information. This figure shows a map of the Spanish province of A Coruña that depicts the municipalities and the main roads. Each municipality is manipulated and drawn as an independent polygon, and each road is manipulated and drawn as an independent line. This view of geographic information gathers within a spatial object points of the geographic space that share several common properties (i.e., having the same set of descriptive attribute values). In order to distinguish an object from others, an explicit identity is assigned to it.
On the other hand, field-based models treat geographic information as collections of spatial distributions, where each distribution may be formalized as a mathematical function from a spatial framework to an attribute domain. Figure 2.4 shows field-based geographic information that was added to the information in Figure 2.3. The colored azeas represent the amount of rain expected at every location at a particular time instant. In a field-based model, one or several attribute values aze associated to each point in space. In our figure, this attribute value is the expected amount of rain. Identifiable objects and zones aze only recognized when there aze remazkable clusters of similaz attribute values or significant events in space, time, or attribute values.
Figure 2.4: Field-based Geographic Information.
Both models are needed in a GIS because each of them is better suited for a different set of analysis techniques. As an example, the analysis of geographic information collected by sensors (e.g., satellites or meteorological stations) is better performed using a field-based model. On the other hand, object-based models are more suitable for the analysis of man-made structures and divisions (e.g., road networks, administrative divisions, cadastre).
In order to be included in a conceptual model for GIS application schemas, both kinds of models define domains or data abstraction that are later used as part of the conceptual model for the GIS application schema.
/^``^^^,;.>\^:^,>^;,;
•
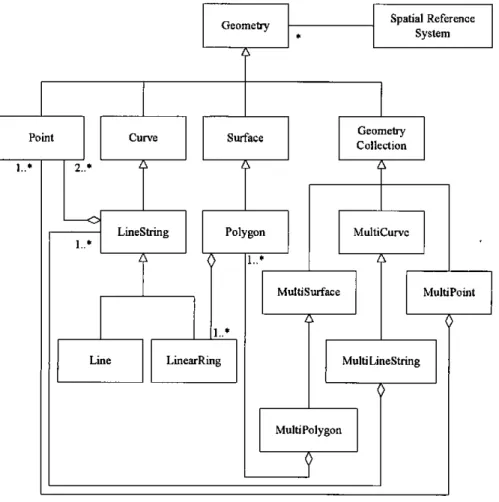
point curve surface volume
Figure 2.5: Examples of Object-based Data Abstractions.
Object-based models usually define a set of data abstractions to represent the different kinds of geographic objects supported by the model. The choice of data abstractions is usually based on the dimensions of the geographic object, for instance
I S Chapter 2. Special Characteristics of Geographic Information
dimensional). Figure 2.5 shows example values of these data abstractions. In addition to these, data abstractions to represent homogeneous and heterogeneous sets of objects are often defined. For instance, point collection, curve collection surface collection,
volume collection and geometry collection (see Figure 2.6 for example values of these
data abstractions). Finally, abstractions that represent restricted cases of the general data abstractions are usually defined as well. As an example, consider the data abstraction line ring that represents a closed line.
•
point curve surface volume geometry collectron collection collectron collection collection
Figure 2.6: More Examples of Object-based Data Abstractions.
On the other hand, field-based models usually define a single data abstraction that represents the field function. The name most commonly assigned to this data abstraction is coverage, though other names such as partition are also used.
Conceptual Model for GIS AppGcation Schemas
In addition to a conceptual model for representing the geographic component of real-world phenomena, it is necessary to define a conceptual model that enables the developer to define the schema of any GIS application. Many conceptual models for geographic information have been proposed in the literature, and it is outside the scope of our work to provide a detailed description of them. A thorough survey can be found in [Viq03].
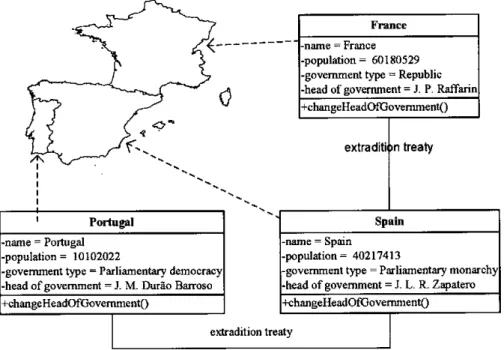
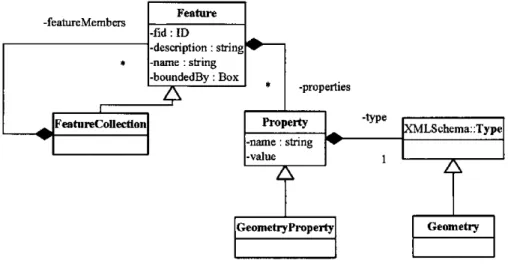
A common characteristic of all conceptual models is that they provide an abstraction for real world phenomena. In the entity-relationship model [Che76], this abstraction is called entity. In object-oriented models [RBP+91], this abstraction is called object. In the particular case of conceptual models for geographic information, many names have been used (e.g. geographic object, spatial object, feature). We will use the term feature in the following descriptions.
Each conceptual model proposed defines an abstraction that captures different aspects of the real world. However, it is nowadays generally accepted that the following aspects of real-world phenomena must be represented by this abstraction:
- Geographic attributes. These attributes describe the geographic characteristics of the feature. Alternative names aze spatial attributes or
geometric attributes.
- Descriptive attributes These attributes represent the chazacteristics that are
unrelated to the geographic component. They aze also called alphanumeric
attributes.
• Relationships between the real-world phenomenon and other real-world phenomena in the model. It consists of associations between a feature and other features (or itself). An example of this type of information is a topological association that describes an adjacency relationship.
• Behavioral aspects of the real-world phenomenon. This behaviour is represented in the feature as a set of operations that can be applied upon the feature to perform analysis procedures.
«featwe type»
River «featwe type»
I-name : String traverses Country
^sowce : point -name : String
course : curve -extent : azea
^-mouth : point -elevation : coverage
+flood(in height : Integer) : area ^
^ i
«instance» « instance»
«featwe instance»
«featwe instance»
River
Country
-name = Nile
-name = Egypt -source = <coordinates>
-extent = <coordinate lisV -course = <coordinate list>
-elevation = <coverage instance> -mouth = <coordinates>
Figure 2.7: An Example Representation of a Conceptual Model.
20 Chapter 2. Special Characteristics of Geograptvc Information
an alphanumeric attribute that represents the river name, a geographic attribute of type
point that represents the location where the river has its source, a geographic attribute
of type curve that represents the river course, and a geographic áttribute of type point that represents the location where the river flows into another river or the sea. The feature representing the river is also associated to the features in the application schema that represent the administrative division of the country by the relationship traverses. Finally, the behaviour of the river when a flood occurs is represented by the operation
fiood that simulates a flooding by raising the water level of the river and computing the
azeas of the country that are affected using the relief map of the country represented with a geographic attribute of type coverage.
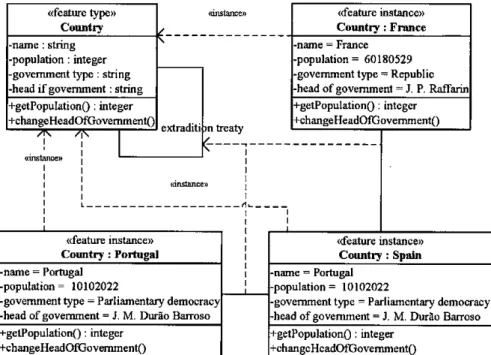
This example shows how the conceptual model is used to represent geographic information. Real-world phenomena (e.g., a river, or a country) aze represented by features. The information that characterizes the phenomena is represented by properties of the features (e.g., the river name, or the country name). Furthermore, data abstractions such as point or curve aze used to represent geographic properties of the features using an object-based view of the geographic space (e.g., the river source and mouth, or the river course). Finally, a specialized feature (in the object-oriented sense of the term) denominated coverage is used to represent geographic properties of the features from a field-based view of geographic space.
A representation of the real world in this conceptual model consists of set of individual features. These features are called feature instances, and aze akin to entities in the entity-relationship model or objects in the object-oriented model. In order to classify the real world phenomena into classes that aze used to describe the schema of a particulaz application, individual features aze grouped into classes with common chazacteristics. These classes are called feature types, and are akin to entity types in the entity-relationship model or object types in the object-oriented model.
Finally, an abstraction is needed to represent an homogeneous collection of feature instances (i.e., having the same feature type and the same semantics). This collection is used to gather all information corresponding to a particulaz topic in order to be manipulated as a set. This abstraction is commonly called feature collection,
geographic theme, geographic layer, thematic layer, or simply layer.
2.3.3 A Logical Model for Geographic Information
The previous section has informally defined a conceptual model for geographic information, by defining the data abstractions that aze used in the model to represent geographic information. T'his conceptual model is abstract in the sense that no details have been given regarding the representation of the model abstractions in a computer system. For instance, geographic values are represented in the conceptual models as infinite point sets with infinite precision. This cannot directly be represented in a computer system because the storage space and the arithmetic precision are limited. Therefore, it is necessary to define a logical model for the representation of geographic information that overcomes the representation limitations of a computer system.
This section describes the main characteristics of logical models for geographic information. We will describe first a logical model for the representation of geographic data values. Then, we will enumerate some considerations that must be taken into account when the logical model is designed.
Representation of Geographic Data Values
There aze two different approaches for the representation of geographic information in a computer: the tessellation model and the vector model.
(a) Fixed Tessellation Model (Raster). (b) Variable Tessellation Model.
Figure 2.8: Tessellation Model.
22 Chapter 2. Special Characteristics of Geographic Information
A variable tessellation model handles units of decomposition of various sizes and shapes. Geographic values are represented as collections of cells from the tessellation. Figure 2.8 presents examples of a fixed tessellation and a variable tessellation. The figure on the left shows a fixed tessellation of space using a regulaz grid of square cells. The figure on the right depicts a variable tessellation of space that assigns more cells to the central part of the space in order to capture more detail.
(13,5)
(0,0)
Figure 2.9: Vector Model.
In the vector model, geographic information is represented by points and edges. A point is represented by its coordinates with respect to some reference system of the space, and an edge is represented by a finite straight line segment defined by its end points. Figure 2.9 shows some geographic values represented using a vector model. The axes of the coordinate reference system aze shown as well as the coordinates of some points in the objects. A discretization of geographic space is not explicit in the vector model as it is with the tessellation model. However, it must exist implicitly in some form, because of the discrete nature of computer arithmetic.
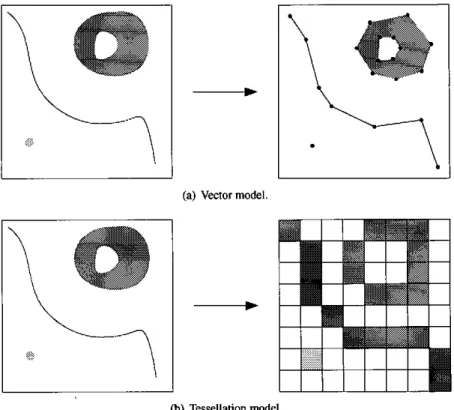
The choice of a conceptual model and a logical model are orthogonal because any logical model can be used to represent any conceptual model. A field-based model can be represented using both the tessellation model or the vector model, and an object based model can be represented using the vector model or the tessellation model.
Figure 2.10(a) shows how a field-based model can be represented using the tessellation model. Field-based information is still represented as a function from space to a range. However, the function domain is no longer the infinite set of points, but a finite set of cells. Space is no longer seen as a continuous field, but as a discrete one, which allows for an explicit representation of data values.
(a) Tessellation model.
(b) Vector model.
24 Chapter 2. Special Characteristics of Geographic Information
of representation aze triangulated irregular networks (TIN), that represent space using a triangulaz partition where no assumption is made on the distribution and location of the vertices of the triangles. The attribute values are recorded at each vertex, and inferred at any other point by lineaz interpolation of the three vertices of the triangle that contains the point .
(a) Vector model.
-^
(b) Tessellat3on model.
Figure 2.11: Representation of an Object-based Model.
A vector model can be used to represent an object-based model (see (Figure 2.11(a)). A point is simply given as a coordinate. An arc is discretized as a sequence of straight-line segments, each represented by a vector, and a surface is defined in terms of its boundary, represented by a collection of vectors. There exists a large number of variants to represent azcs and surfaces in vector model.
Finally, a tessellation model can also be used to represent an object-based model (see Figure 2.11(b)). Each spatial object is represented by the smallest set of cells that contains it. This set is finite, and therefore, representable. Thus, a point may be represented as a single cell, an arc by a sequence of neighboring cells and a connected azea by a collection of contiguous cells.
and it is outside the scope of our work to provide a detailed description of each model and a comparison between the different models. However, we can briefly compare and summarize the advantages and drawbacks of each kind of model with respect to the other. We can affirm that generally, the vector model is more suitable for the representation of object-based models and the tessellation model is more appropriate for the representation of field-based models. However, the following aspects influence the decision [BM98, LGMROI, LT92, RSVO1, Wor95]:
• Representation efficiency. The vector data model is more efficient in the use of computer storage than the tessellation model because only points of interest have to be stored. On the other hand, the tessellation model implies large data volumes. T'he larger the grid resolution (i.e., the smaller the cell size), the better the approximation and the higher the number of cells needed to represent the information. This implies that the representation occupies much memory space and operations on objects aze more time-consuming. A tessellation stored in a raw state with no compression can be extremely inefficient in terms of computer storage usage.
• Computational efficiency. The vector model implies the storage and manipulation of complex data structures (lists of points and edges). Some operations (e.g., intersection of geographic values, overlay of feature collections) aze complex and require considerable computing power. On the other hand, the tessellation model uses simple data structures that are handled naturally by computers because all commonly used programming languages support array handling and operations. This implies that spatial analysis and filtering is easy.
• Expressive power. The vector model allows the explicit representation of
topological relationships between geographic objects, and therefore can easily be used to perform topological analysis such as path-finding in networks. The tessellation model is not suitable for this kind of analysis. On the other hand, the vector model assumes a that real-world phenomena have crisp boundaries, which does not agree with our observations. To change this viewpoint, another level of complexity must be added to the representation (e.g., using fuzzy coordinates for the end-points of the edges).
• Supported transformations. Coordinate transformations, affine transformations
(e.g., rotation, translation) and adjustments to surface models aze simple in vector models. However, this transformations aze time-consuming, and need complex algorithms in tessellation models, which may result in loss of information and distortion.
• Location-specific analysis. The manipulation of alphanumeric data for each
26 Chapter 2. Special Characteristics of Geographic Information
location of geographic space is a simple task in the tessellation model, because it only requires to retrieve the cell that represents that location, or to interpolate the values of the surrounding cells. On the other hand, the same analysis in the vector model requires to check all geographic objects to see if they contain the given location (i.e., a point query), which is a more complex task.
. Data presentation. Data displaying and plotting may be time-consuming and
expensive in vector models, but the graphical representation is accurate at all scales. On the other hand, raw maps produced from tessellation models aze inelegant but simple to produce.
• Data production. The tessellation model is of prime importance because of the
exponentially growing volume of data coming from satellite sources and the its increasing use in scientific applications such as environmental fields (e.g., pollution, weather). The vector model is important for the huge amount of data coming from CAD sources.
Systems have tended to specialize in one of these models because each requires different technologies and each originates from different viewpoints of geographic information. Vector data models were seen as being truer to conventional cartography and were used for applications where high-quality map-making was required. On the other hand, tessellation models were seen as being suitable for overlay analysis and sensor-based information.
This specialization is no longer relevant because it has been shown that what seemed to be an important conceptual difference, it is in fact largely a question of technology. Today, many GIS development tools support both models and provide translation procedures between them (i.e., rasterization for vector to raster conversion and vectorization for raster to vector conversion).
^rade-offs in the Definition of a Logical Model
The definition of a logical model for geographic information involves deciding a number of data types to represent geographic data values. This decision involves in turn a number of trade-offs that have been the cause of the definition of such a high number of logical models for geographic information. It is outside the scope of our work to describe and analyze them. An exhaustive survey and compazison can be found in [Viq03]. Nevertheless, now we give a brief summary of the consequences of finding a compromise between the following pairs of chazacteristics:
• The expressive power versus the simplicity of the type system. A simple type
real-world phenomenon depicted in 2.12(a) that consists of a river that has a dam in the middle of the course. If a simple type system consisting only of the data types point, curve, and surface is used to represent this real-world phenomenon, then more than one object must be used because the area of the dam cannot be represented as a line and the course of the river cannot appropriately be represented with a surface. The real-world phenomenon is a mixture of a line and a surface. On the other hand, this real-world phenomenon can be represented using a complex type system that has a type for heterogeneous collection of geographic values. For instance, type system defined by the ISO/TC 211 to represent geographic information in [IS003b] includes dozens of data types. The problem with complex type systems is that it may not be easy to understand the difference between some of them.
Furthermore, if a simple type system is used, it may be impossible to define some operations because the result may not be representable in that type system. For instance, in the general case, the intersection between two geographic values of type curve is a set of points (the curves may intersect at more than one point). The simple type system described previously cannot represent the result of this operation using the data type point, and therefore, the operation cannot be included unless new data types are defined.
• A weak type system versus a strong type system. A weak type system defines data types that do not impose strict constraints on the values. This results in a type system that is more intuitive and closer to the user perception. On the other . hand, a strong type system imposes rigid constraints on the data types that avoid incorrect or inconsistent geographic values but may be unable to model some geographic phenomena.
(a) Real World Phenomenon. (b) Weak Type System. (c) Strong Type System.
Figure 2.12: Weak Type Systems vs. Strong Type Systems.
28 Chapter 2. Special Characteristics of Geographic Information
represented using a curve that becomes a surface at the dam and then becomes a curve again after the dam. In a weak type system, this can be modeled using a geographic attribute of type surface that is degenerated into a curve when the river is outside the dam (see Figure 2.12(b)). A geographic attribute of a type that allows heterogeneous collections of spatial objects may be used as well. On the other hand, a strong type system considers this geographic object an invalid case, and it must be modeled as two independent objects, namely a river and a dam (see Figure 2.12(b)).
2.3.4 Physical Model
Whereas the data types of the logical model of traditional information systems (e.g., the relational model) can be stored using simple storage tools like disk pages and records, geographic information requires data types whose representations may vary in size from very small to very lazge. Consider, for example, the implementation of a surface data type represented by a list of vertices. A value of this data type could represent the border of the US state of Colorado (which is exactly a rectangle and would need exactly four pairs of coordinates) or the border of Norway (which has thousands of vertices because of the many fjords). Therefore, the data structure supporting this data type must be prepazed to deal with values of different sizes.
Furthermore, these data values aze generally used as components of a comprising structure (e.g. as attribute values in a tuple). If the storage size of the representation of a value is small, the best approach is storing it inline within a storage block representing a tuple in order to retrieve the value when the tuple is fetched and save a disk access. On the other hand, if the representation is lazge, it is better to store it using a sepazate BLOB, especially if the value is accessed only rarely. For a given size and access
probability of a large object, query performance depends on its representation: either
inlined within the aggregate or swapped out to a separate object.
su ace integer douóle
_ _ _ ..._ _.... _....
l^t,tu»El«ri+h?^iF^ I rnfes bl^":
Figure 2.13: Storage Representation of Attribute Values.
Consider, for example, a geographic feature that represents a country. Each instance of this feature type consists of an attribute of the data type integer representing the population of the country, an attribute of the data type double representing the average height of the people in the country, and an attribute of the data type
surface representing the geographic extent of the country. Furthermore, the storage
of the value, and two large objects storing a list of coordinates for the boundary of the surface, and a list of coordinates for the holes of the surface. The storage representation of these values is shown in Figure 2.13.
surface
m
`:óorandarv b1^^^^^^^^
e^ 61o6.:i
Figure 2.14: Storage Representation of a Disk Tuple.
Finally, when these values are embedded in a disk tuple, the best storage layout depends on the size and access probability of the lazge objects [DGOOb]. Figure 2.14 shows an example layout for a tuple containing these values. In this particular case, the system has determined that the best layout is the one where the large object representing the boundary of the surface is placed inside the disk tuple with the other attributes of the feature instance, whereas the lazge object representing the holes of the surface is stored in a sepazate disk page.
geomehy collecdon
ofli iw^ ^1^,+^
^^^^::^::::.
Figure 2.15: Storage Representation of a Geometry Collection.
Furthermore, the implementation of complex data models often requires nested lazge objects, and access performance is highly influenced by the clustering strategy followed to store the resulting tree of lazge objects. Consider, for instance, the storage representation of a geometry collection, as shown in Figure 2.15. In addition to a fixed-size record with properties of the value, the list of geometry values is stored in a large object. Given that the data type for each geometry value uses large objects for its representation, the result is that the storage representation of a geometry collection value is a tree of lazge objects.