COLEGIO DE POSTGRADUADOS
INSTITUCIÓN DE ENSEÑANZA E INVESTIGACIÓN EN CIENCIAS AGRÍCOLAS
CAMPUS MONTECILLO
POSTGRADO DE RECURSOS GENÉTICOS Y PRODUCTIVIDAD
GENÉTICA
ÍNDICES DE SELECCIÓN MOLECULAR: UN NUEVO
ENFOQUE
J. JESÚS CERÓN ROJAS
T E S I S
PRESENTADA COMO REQUISITO PARCIAL
PARA OBTENER EL GRADO DE:
DOCTOR EN CIENCIAS
MONTECILLO, TEXCOCO, EDO. DE MÉXICO
ÍNDICE DE SELECCIÓN MOLECULAR: UN NUEVO ENFOQUE
J. Jesús Cerón Rojas, Doctor
Colegio de Postgraduados, 2009
Con base en la teoría de la descomposición singular de las matrices de varianzas y covarianzas fenotípicas y genotípicas, y la de los marcadores moleculares, se presenta la teoría de dos índices de selección construidos con la información fenotípica y la que proporcionan los marcadores moleculares. Al primer índice de selección se le llama método del índice de selección molecular eigen (Molecular Eigen Selection Index Method, o MESIM por sus siglas en inglés) y al segundo, por tratarse de una generalización de MESIM al caso de la selección molecular del genoma completo en varios ambientes, método del índice de selección molecular del genoma completo (Genome Wide Molecular Eigen Selection Index Method, o MESIMGW, por sus siglas en inglés). La investigación se dividió en dos partes principales. En la primera se desarrolla la teoría estadística de MESIM y en la segunda parte la de MESIMGW siguiendo las ideas fundamentales de MESIM. Los resultados teóricos y los obtenidos por simulación en computadora indican que MESIM y MESIMGW tienen al menos tres ventajas sobre los índices de selección estándar actualmente disponibles: MESIM y MESIMGW no requieren ponderaciones económicas; las propiedades muestrales del índice y de los estimadores de sus parámetros son conocidas en el contexto asintótico, y el avance genético promedio que se alcanza con ellos es mayor o igual al de los índices de selección estándar.
ÍNDICE DE SELECCIÓN MOLECULAR: UN NUEVO ENFOQUE
J. Jesús Cerón Rojas, Doctor
Colegio de Postgraduados, 2009
Using the singular value decomposition of the phenotypic and genotypic variance-covariance matrices and the variance-variance-covariance matrix of molecular markers, we present the theory of two selection indices constructed with phenotype information and that provided by molecular markers. The first selection index is named Molecular Eeigen Selection Index Method (MESIM) and the second one is named Genome Wide Molecular Eeigen Selection Index Method (MESIMGW, GW stand for genome wide) because is a generalization of MESIM to the case of genome wide selection in several environments. This work is divided into two principal sections. In the first one the statistical theory of MESIM is presented and in the second part the theory of MESIMGW is presented by following basic ideas of MESIM. Computer simulation and theoretical results indicated that MESIM and MESIMGW have at least three advantages over the standard selection indices currently available: MESIM and MESIMGW do not require economic weights, the sampling properties of MESIM and MESIMGW are known and easy to estimate, and the genetic advance of MESIM and MESIMGW are equal or lager than that of the standard selection indices.
Key words. Eigenvalues and eigenvectors, Moore-Penrose matrix generalized inverse,
AGRADECIMIENTOS
Al Consejo Nacional de Ciencia y Tecnología (CONACYT)
por el
financiamiento otorgado para la realización del proyecto de
investigación que concluye con el presente trabajo.
A BIMBO
, por el financiamiento parcial de la primera parte del
trabajo de investigación.
Al
Dr. José Crossa Hiriart
, jefe de la
Unidad de Biometría y Estadística
del Centro Internacional de Mejoramiento de Maíz y Trigo (CIMMYT),
por su invaluable poyo en el presente trabajo de investigación.
Al
Dr.
Jaime Sahagún Castellanos
, quien fue el primero en creer que
el enfoque dado a los índices de selección en la presente investigación
era relevante.
Al
Dr. Fernando Castillo González
, por haberme permitido trabajar
con absoluta libertad en el presente trabajo de investigación.
Al
Dr. Amalio Santacruz Varela
, quien en uno de mis peores apuros
económicos me tendió la mano.
Al
Dr. Ignacio Benítez Riquelme
, quien siempre me orientó en la
manera de ordenar los cursos y en el formato que tendría el presente
trabajo de tesis.
DEDICATORIA
A
Ignacio y Samuel Cerón Rojas
hermanos entrañables, quienes, durante mis estudios de bachillerato
y licenciatura, me tendieron la mano cuando más necesité su apoyo
ÍNDICE GENERAL
RESUMEN GENERAL i
GENERAL SUMMARY ii
INTRODUCCIÓN GENERAL 1
Indice de selección molecular 2
Mapas de QTLs 3
Selección del genoma completo 5
Un nuevo enfoque de los índices de selección apoyados en marcadores moleculares 7
PRIMERA PARTE 10
A MOLECULAR SELECTION INDEX METHOD BASE ON EIGEN-ANALISIS 10
RESUMEN 10
ABSTRACT 11
INTRODUCTION 12
THEORY OF SELECTION INDICES 15
Smith`s selection index 15
Molecular selection index 17
MESIM 18
SIMULATED DATA 23
Generating a doubled-haploid population for selection 24
Sign of the coefficients, economic weights, and expected genetic gains 24
RESULTS AND DISCUSSION 26
CONCLUSIONS 36
APPENDIX 38
THEORETICAL DERIVATION OF MESIM 38
LITERATURE CITED 40
SEGUNDA PARTE 44
Evaluating and Comparing Genome Wide and Marker Assisted Selection Indices 44
Resumen 44
Abstract 45
Introduction 49
selection indices 49
The general genome wide selection index 50
The Lange and Whittaker genome wide selection index 52
The genome wide Molecular Eigen Selection Index Method 53
Estimating parameters 54
Criteria for evaluating the different selection indices 55
Criterion 1 Mean squared error of prediction and effectiveness 56
Criterion 2 The relative efficiency of the SIs 57
Criterion 3 Regression of the genotypic means of the selected
individuals on the selection cycles 57
Criterion 4 Effective genetic gain 57
Criterion 5 Expected genetic gain 58
Materials 58
Simulated data 58
Generating simulated doubled haploid and F2 populations for selection 59 Sign of the coefficient and economic weights of the selection indices 63
Real data 63
Results 64
Simulated data 64
Criteria 1 and 2 64
Criteria 3, 4, and 5 67
Comparing MESIMGW versus LW and MESIM versus LT 72
Comparing GW SIs versus MAS SIs 72
Comparing the DH population to the F2 population 73
Genetic gains across environments 74
Real data 78
Discussion 79
Appendices 81
Appedix A 81
The Moore-Penrose’s generalized inverse 81
Appedix B 83
Theoretical derivation of MESIMGW 83
Appedix C 85
Results using a population size of 500 individuals 85
References 91
DISCUSION GENERAL 93
Correlaciones canónicas e indices de selección 95
CONCLUSION GENERAL 97
INTRODUCCIÓN GENERAL
De acuerdo con Dwivedi et al. (2007), de 1995 al 2020 la población mundial pasará de 5,660 a 7,500 millones de personas. Los países en desarrollo contribuirán con el 97.5 % y los países desarrollados con el 2.5 % restante. La demanda de cereales durante tal período se incrementará 39 %; la demanda de carne 58 % y la demanda de raíces y tubérculos en 37 %. Los países en desarrollo serán responsables de aproximadamente el 85 % del incremento en la demanda global de cereales y carne. En respuesta a la alta demanda de carne, la demanda de cereales para la alimentación de ganado será el doble en los países en desarrollo. La demanda de maíz (Zea mays) en tales países se incrementará más rápido que para cualquier otro cereal y sobrepasará la demanda de arroz (Oryza sativa) y trigo (Triticum aestivum) en el 2020. Para satisfacer tal demanda, en el mundo se tendrá que incrementar en 40 % la producción de grano en el 2020. Como la ganancia que se obtiene con el mejoramiento convencional está disminuyendo gradualmente, el aumento adicional del rendimiento deberá generarse combinando el mejoramiento convencional con la genómica y las tecnologías de transgénicos para equipar a los cultivos con resistencia a estrés biótico y abiótico y con capacidad para la adaptación a diversos nichos ecológicos.
interés; pueden ser de tamaño muy diferente, desde pequeñas secuencias hasta grandes fragmentos de ADN que pueden contener algún gen. Las ventajas principales que tienen los MM son: (a) permiten detectar pequeñas variaciones con mínima cantidad de material; (b) no afectan al fenotipo; (c) pueden detectarse en cualquier estado de desarrollo de la planta; (d) se distribuyen a todo lo largo del genoma; (e) la mayoría de ellos son codominantes; (f) no tienen efectos epistáticos ni pleiotrópicos; y (g) el polimorfimo es enorme (Arús y Moreno-González 1993; Cubero, 2003). Actualmente se cuenta con una gran variedad de MM que son de utilidad en el mejoramiento genético de plantas y animales. Algunos de ellos son: RFLP (Restriction Fragment Length Polymorphism), RAPD (Random Amplified Polimorphic ADN), AFLP (Amplified Fragment Length Polymorphism ), SCAR (Sequence Characterised Amplified Region); STS (Sequence Tagged Sites); SNP (Single Nucleotide Polymorphisms), etc. Detalles específicos de los MM anteriores pueden verse en Cubero (2003).
Índice de selección molecular
Lande y Thompson (1990) establecieron las bases teóricas de MAS para la selección de caracteres cuantitativos utilizando estudios de simulación por computadora. Consideraciones teóricas adicionales han contribuido de manera más completa al entendimiento de aspectos fundamentales en el desarrollo de MAS respecto al tipo de población, tamaño de muestra, tamaño del genoma y número de MM (Zhang y Smith 1992, 1993; Gimelfarb y Lande 1994, 1995; Whittaker, 2003).
caracteres cuantitativos (QTL o Quantitative Trait Loci, por sus siglas en inglés) ligados a los MM. Esto se debe a que no es posible identificar todos los QTL que afectan al carácter de interés (Li, 1998), es decir, a menos que todos los QTL que afectan a los caracteres de interés sean identificados, en MAS debería combinarse la información fenotípica con los efectos de los QTL asociados a los MM , también denominados efectos MQTL, para asegurar la eficiencia de la selección (Dekkers y Settar, 2004). En la construcción del índice de selección de Lande y Thompson (1990) se requiere: (1) identificar el ligamiento entre el MM y el QTL en un mapa de QTLs o MMs; (2) estimar los efectos MQTLs; y (3) combinar los efectos MQTLs con la información fenotípica para clasificar los individuos mediante un índice de selección y, subsecuentemente, desarrollar líneas, variedades o poblaciones de interés. Los efectos MQTLs pueden identificarse y estimarse con base en el desequilibrio de ligamiento creado al cruzar líneas endogámicas o poblaciones divergentes (Jansen, 2003).
Mapas de QTLs
La identificación de QTLs se hace recurriendo a pruebas de hipótesis estadísticas que permiten identificar el ligamiento entre marcadores y QTLs en la progenie de una retrocruza o F . Éstos son los diseños experimentales ideales porque los progenitores en la 2 población F tienen la misma fase de ligamiento, toda la progenie es informativa y el 1 desequilibrio de ligamiento1 es máximo (Beavis, 1998).
La metodología estadística estándar para detectar ligamiento entre un marcador y un QTL recurre al estadístico de prueba t deStudent o FdeSnedecor (Soller et al., 1976) o al estadístico de razón de máxima verosimilitud cuando se involucran pares de marcadores adyacentes a un QTL; aunque, generalmente, se requerirá la aplicación de este último para estimar la localización del QTL (Jensen, 1989; Knapp et al., 1990; Lander y Botstein, 1989; Van Ooijen, 1992, 1999 ).
Los métodos convencionales para la identificación de QTLs están basados en la comparación de modelos con un QTL vs un modelo donde ningún QTL está presente. Por ejemplo, en el mapeo2 por intervalos estándar, la verosimilitud para un presunto QTL es evaluada en cada localización del genoma asumiendo que ningún QTL está en el intervalo bajo estudio vs un QTL está en dicho intervalo, sin embargo, es muy probable que los QTLs localizados en otra parte del genoma afecten al estadístico de prueba, disminuyendo, así, la potencia de la prueba y proporcionado estimaciones sesgadas del efecto y localización del QTL de interés (Lander y Botstein, 1989; Knapp, 1991). Además, aún si no
1
Asociación no aleatoria entre MMs y QTLs.
existe un QTL en el punto de prueba pueden aparecer los llamados QTLs “fantasmas3” (Haley y Knott, 1992; Martínez y Curnow, 1992).
De acuerdo con Carbonell (1997), la construcción de mapas de QTLs persigue, entre sus principales objetivos: (1) localizar los genes que contribuyen a la variación genética de los caracteres de importancia económica; (2) utilizar la información de los mapas de QTL´s en los programa de selección asistida con marcadores moleculares en plantas y animales; y (3) clonar molecularmente los genes subyacentes en los caracteres cuantitativos (un objetivo a largo plazo).
La identificación y localización de QTLs sigue un algoritmo básico: (a) se construye un mapa de ligamiento con marcadores moleculares; y (b) se hacen pruebas de significancia estadística asumiendo que ningún QTL vs al menos un QTL está en la región de interés para identificar QTLs utilizando estadísticos de prueba como t deStudent, FdeSnedecor, o la razón de máxima verosimilitud y, posteriormente, se estiman los efectos MQTL.
Selección del genoma completo (Genomewide Selection)
Whittaker (2001), en poblaciones endogámicas, y Meuwissen et al. (2001), en poblaciones no endogámicas, han considerado una ligera modificación al índice de selección de Lande y Thompson (1990): en lugar de estimar los efectos MQTL y enseguida construir el índice de selección, incorporaron los MM como variables aleatorias adicionales en el índice, lo cual permite predecir los valores genotípicos en una sola etapa. A tal procedimiento lo llamaron selección del genoma completo (genome-wide selection o GWS, por sus siglas en inglés). En GWS se utilizan todos los MM sin importar si éstos están ligados a los efectos aditivos de los QTL y sin estimar los efectos MQTL (Bernardo y Yu, 2008). De acuerdo con Wong y Bernardo (2008), al hacer el supuesto de que los MM son variables aleatorias en GWS se evita el problema de sobreparametrización que podría ocurrir en el índice de selección de Lande y Thompson (1990). Además, en GWS no se violan los supuestos de normalidad multivariada y cambios de frecuencia alélicos pequeños, lo que sí ocurre en el caso de Lande y Thompson (1990), ya que la selección se hace con base en los efectos mayores de los QTL. Utilizando simulación por computadora Lange y Whittaker (2001) compararon GWS con el en índice de selección de Lande y Thompson (1990) y concluyeron que el avance genético o la ganancia promedio alcanzada por GWS es superior al último método. Es decir, la selección del genoma completo es una forma de selección apoyada en MM donde se utilizan todos los MM considerando que éstos están ligados a los efectos aditivos de los QTLs, pero, sin estimar los efectos MQTL.
Prediction o BLUP, por sus siglas en inglés) y utilizan tales estimaciones para predecir el valor reproductivo de las plantas o animales candidatos a selección. Bernardo y Yu (2007) reportan ganancias de rendimiento de grano en maíz del 18 al 43 % superiores a las alcanzadas con el procedimiento de Lande y Thompson (1990). Resultados similares han sido reportados por Wong y Bernardo (2008) en aceite de palma.
Un nuevo enfoque de los índices de selección apoyados en marcadores moleculares
Recientemente, Cerón-Rojas et al. (2006) desarrollaron un índice de selección (IS) basado en el eigen-análisis: el método del índice de selección eigen (Eigen Selection Index Method, o ESIM por sus siglas en inglés) en el cual los elementos del primer vector característico de la matriz de varianzas y covarianzas (o de correlaciones) fenotípicas de los caracteres de interés se utilizan como ponderaciones en el IS y el primer valor característico es utilizado en la respuesta a la selección. ESIM no requiere estimaciones de la matriz de varianzas y covarianzas genotípicas, ni la asignación de ponderaciones económicas y proporciona una respuesta a la selección similar a la que se obtiene del IS de Smith (1936). De manera similar, Cerón-Rojas et al. (2008), siguiendo las ideas fundamentales del índice de selección restringido de Kempthorne y Nordskog (1959), construyeron un ESIM que permite fija un número de caracteres cuando se seleccionan individuos para el siguiente ciclo de selección al que llamaron el método del índice de selección restringido eigen (Restricted Eigen Selection Index Method o RESIM por sus siglas en inglés).
desarrollado por Cerón-Rojas et al. ( 2008) y en las ideas básicas de Lande y Thompson (1990). En este índice, denominado índice de selección molecular eigen (Molecular Eigen Selection Index Method, o MESIM por sus siglas en ingles), de manera similar que en el método de Lande y Thompson (1990) se utilizan los efectos MQTLs y los valores fenotípicos en el índice para hacer la selección de los individuos de interés. La eficiencia de este método en relación con la del método de Lande y Thompson (1990) se evaluó con simulación por computadora.
En la segunda parte se extiende la teoría de MESIM al caso del IS molecular del
A MOLECULAR SELECTION INDEX METHOD BASED ON
EIGENANALYSIS
§J. Jesús Cerón-Rojas, Fernando Castillo-González, Jaime Sahagún-Castellanos, Amalio Santacruz-Varela, Ignacio Benítez-Riquelme, y José Crossa
RESUMEN
El índice de selección molecular tradicional empleado en la selección asistida por marcadores moleculares maximiza la respuesta a la selección combinando la información de los marcadores moleculares ligados a los loci de los caracteres cuantitativos y los valores de los fenotipos de tales caracteres de los individuos de interés. Este estudio propone un índice de selección molecular basado en el método eigenanálisis (Molecular Eigen Selection Index Method, o MESIM por sus siglas en inglés), donde el primer eigenvector es utilizado como un criterio del índice de selección, y sus elementos determinan la proporción de la contribución de los caracteres al índice de selección. Este artículo desarrolla el esquema teórico de MESIM. Resultados de simulación muestran que las medias genotípicas y la respuesta esperada a la selección de MESIM para cada carácter es igual o mayor que la alcanzada por el índice de selección molecular tradicional. Cuando varios caracteres se seleccionan de manera simultánea, MESIM es muy eficiente para los caracteres con relativamente baja heredabilidad. Las ventajas principales de MESIM sobre el índice de selección molecular tradicional son que sus propiedades estadísticas muestrales son conocidas y que no requiere ponderaciones económicas y de esta manera puede utilizarse en aplicaciones prácticas cuando todas o algunas de las características necesitan mejorarse de manera simultánea.
Palabras clave: Índices de selección, eigen-análisis, loci de caracteres cuantitativos, marcadores moleculares
ABSTRACT
The traditional molecular selection index (MSI) employed in marker-assisted selection maximizes the selection response by combining information on molecular markers linked to quantitative trait loci (QTLs) and phenotypic values of the traits of the individuals of interest. This study proposes an MSI based on an eigenanalysis method (molecular eigen selection index method, MESIM) where the first eigenvector is used as a selection index criterion, and its elements determine the proportion of the trait’s contribution to the selection index. This paper develops the theoretical framework of MESIM. Simulation results show that the genotypic means and the expected selection response from MESIM for each trait are equal to or greater than those from the traditional MSI. When several traits are simultaneously selected, MESIM performs well for traits with relatively low heritability. The main advantages of MESIM over the traditional molecular selection index are that its statistical sampling properties are known, and that it does not require economic weights and thus can be used in practical applications when all or some of the traits need to be improved simultaneously.
INTRODUCTION
Marker-assisted selection (MAS) is an important breeding tool in which molecular marker alleles linked to quantitative trait loci (QTLs) that control phenotypic variables of important traits are selected. Marker-assisted selection can be more efficient than selecting individuals based on phenotypic trait values. Progeny of specific progenitors can be selected based on molecular markers as long as these are associated with breeding values of the traits under consideration. This is one form of MAS (DEKKERS and DENTINE 1991; ARUS and MORENO-GONZALEZ 1993). Another form of MAS is based on the molecular selection index (MSI) proposed by LANDE and THOMPSON (1990). In MSI the selection response is maximized by combining information on molecular markers linked to QTLs and the phenotypic values of the traits of interest.
The MSI is an application of the selection index methodology proposed by SMITH (1936), in which MQTL effects are incorporated. As proposed by LANDE and THOMPSON (1990), the MSI performs a linear regression of phenotypic values on the coded values of the molecular markers such that selected molecular markers are those statistically linked to QTLs that explain most of the variability in regression models. The coefficient of regression of the molecular marker is the MQTL effect. Statistical models and methods for mapping QTLs and estimating their MQTL effects have been developed (JANSEN 2003). Several authors have pointed out the effectiveness of the MSI in inbred populations with large population sizes and traits with low heritability values (ZHANG and SMITH 1992, 1993; GIMELFARB and LANDE 1994, 1995; WHITTAKER 2003) when only one trait (and its associated molecular score) is considered.
The selection index theory was originally developed by SMITH (1936) and generalized by KEMPTHORNE and NORDSKOG (1959) for a restrictive selection index. The standard selection index is defined as a linear combination of the observed phenotypic values of the traits of interest with the traits’ previously defined economic weights. Selection indices are based on improving one trait by incorporating information on related traits (WEI et al. 1996; FALCONER and MACKAY 1997) or incorporating information on MQTL effects by means of the MSI; other selection indices are based on improving several traits simultaneously, which requires assigning economic weights to each trait, as proposed by SMITH (1936).
must also be considered because it affects genetic marker means and the ability to detect QTLs (WU et al. 2000). Furthermore, since selection increases the frequency of the QTL’s favorable allele, as well as the allele of the molecular marker linked to it, total variability in the selected sample is reduced (MACKINNON and GEORGES 1992).
The MSI has the same advantages and disadvantages as Smith’s selection index; it is simple to use but its sampling statistical properties and selection response are unknown, except in the case of two traits (HAYES and HILL 1980). Even for two traits, the statistical properties of Smith’s selection index and its selection response, obtained using the delta method, are difficult to use and evaluate (HARRIS 1964); furthermore, it is not easy to consistently assign economic weights to the traits.
CERÓN-ROJAS et al. (2008) developed a restrictive ESIM (RESIM) that facilitates maximizing the genetic progress of some characters while leaving the others unchanged.
In this paper we develop a molecular selection index (molecular eigen selection index method, MESIM) based on the restrictive eigenvalue selection index method (RESIM) of CERÓN-ROJAS et al. (2008) and the molecular selection index developed by LANDE and THOMPSON (1990) using the selection index methodology proposed by SMITH (1936), in which MQTL effects are incorporated. Simulated data were generated for comparing the selection response based on various selection indices: (1) MESIM versus LANDE and THOMPSON (1990); (2) RESIM versus the restrictive selection index of KEMPTHORNE and NORDSKOG (1959), and (3) ESIM versus the Smith selection index (SMITH 1936). Practical and theoretical properties of estimators from MESIM, RESIM, ESIM, LANDE and THOMPSON, the SMITH selection index, and the restrictive selection index of KEMPTHORNE and NORDSKOG are discussed. The efficiency of MESIM, LANDE and THOMPSON, ESIM, the SMITH selection index, and the restrictive selection index of KEMPTHORNE and NORDSKOG is evaluated using the genotypic means of the selected individuals. The theory of RESIM is described in CERON-ROJAS et al. (2008).
THEORY OF SELECTION INDICES
Smith’s selection index
where p′=[p1 ... pq] is the vector of the phenotypic values, and β′=[β1 ... βq] is the vector of coefficients of p; Zis the breeding value, g′=[g1 ... gq] is the vector of genotypic values, and θ′=[θ1 ... θq] is the vector of economic weights. The phenotypic valuespj (j=1, 2 ,..., q) are modeled as pj =gj +εj, wheregj is the genotypic value of the jth trait and εj is the environmental component. Assuming that gj and εj are independent, and that gj represents only additive effects, Z =θ′g denotes the breeding value (HAZEL 1943; KEMPTHORNE and NORDSKOG 1959). Hence, selection based on
p β′
=
Y leads to a selection response
Sβ β Σθ θ
Σβ θ
′ ′
′
= =k Z YZ k Z
R σ ρ σ (2)
where Σ and S are the variance-covariance matrices of genotypic and phenotypic values, respectively, k is the standardized selection differential, θ′Σβ is the covariance between Y and Z, β′Sβ is the variance of Y, 2 =θ′Σθ
Z
σ is the variance of Z , and ρYZ is the correlation between Y and Z.
In Smith’s selection index, the vector βS =S−1Σθ(the subscript S denotes Smith’s method) where −1
Molecular selection index
LANDE and THOMPSON (1990) extended Eq. 1 to include the case where information on QTLs associated with molecular markers is available and denoted the molecular selection index as
YM =β′pp+β′mm (3)
=[β′p βm′ ]
m p
where βp is a vector of phenotypic weights, βm is the vector of weights of the molecular score, p is the vector of phenotypic values, and m′=
[
m1 ... mN]
, where each mj(j=1, 2, …, N; N= number of molecular scores) is the jth molecular score given by the the sum of the products of the estimated additive effect of the QTL linked to the molecular marker (MQTL effects) multiplied by the coded values of their corresponding molecular markers. The response to this molecular selection index may be written asM M M M M M M M M M Z Y M
M k k
R M M β S β θ Σ θ β Σ θ ′ ′ ′ =
= σ ρ σ (4)
where
= M M M S
SM ,
= M M M Σ
ΣM ;
k has been defined as in Eq. 2, σM2 =θ′MΣMθM
molecular scores when two or more traits are considered (LANDE and THOMPSON 1990). Only statistically significant additive MQTL effects are included in m.
The vector βMSI =SM−1ΣMθM allows constructing the molecular selection index
pm MSI MSI
Y =β′ p which has maximum correlation ( M MZ Y
ρ ) with ZM =θ1′g+θ′2m (the subscript MSI in βMSI denotes LANDE and THOMPSON’s molecular selection index method). In YMSI =β′MSIppm, p′pm=
[
p′ m′]
(Eq. 3). The variance of YMSI is(
YMSI)
M M M M MVar =θ′ Σ S−1Σ θ and the maximized selection response can be written as
MSI M MSI MSI k
R = β′ S β . Estimators of βpand βm (βˆ and p βˆm) for various traits are obtained
directly from the estimators of Σ, S, and M (Σˆ , Sˆ , and Mˆ ), and from the vector θM.
MESIM
Using a concept similar to that of KEMPTHORNE and NORDSKOD (1959), which maximizes the selection response (Eq. 2) by maximizing the square of the correlation between Y and Z (Eq. 1), and utilizing basic concepts from CERÓN-ROJAS et al. (2008), it can be shown that Eq. 4 is maximized by maximizing 2
M MZ Y
ρ . The key point when maximizing 2
M MZ Y
ρ is that the variances (or standard deviations) of YM =β′pp+β′mm and m
θ g θ1′ + ′2 =
M
Z are constants in each selection cycle. Thus, the selection of genotypes can be done using either YM or YM/ β′MSMβM . Because of this fact, when maximizing 2
M MZ Y
it is possible to impose restrictions β′MSMβM =1 and θ′MΣMθM =1 such that, in MESIM, it is required to maximize
Φ=
(
θ′MΣMβM)
2−µ(
β′MSMβM −1)
−ω(
θ′MΣMθM −1)
with respect to βM, θM, µ, and ω, where βM is the vector of MESIM coefficients, θM is the vector of economic weights, and µ and ω are Lagrange multipliers. In MESIM it is assumed that θM is not a vector of constants.
When Φ is derived with respect to βM and θM (Appendix ) and the result is set to the null vector, it follows that
(
θ′MΣMβM)
ΣMθM −µSMβM =0 (5)(
θ′MΣMβM)
ΣMβM −ωΣMθM =0 (6) Because the two restrictions β′MSMβM =1 and θ′MΣMθM =1, when Eq. 5 is multiplied byM
β′ and Eq. 6 is multiplied by θ′M, the result is
(
θ′MΣMβM)
2 =ω = µ. Hence, µ maximizes2
M MZ Y
ρ under the restrictions β′MSMβM =1 and θ′MΣMθM =1.
The following task is to determine the vector βM that allows constructing YM that maximizes its correlation with ZM =θ1′g+θ2′m. The Appendix shows that the required βM
is the solution to the following equality
(Q−µI)βM =0, (7) where Q= SM−1ΣM. Thus, for MESIM, the value that maximizes 2
M MZ Y
ρ under restrictions 1
=
′MSMβM
allows constructing YM (with maximum correlation with ZM =θ1′g+θ2′m) is the first eigenvector of matrix Q(βM).
Let µ and βM =βMESIM be the first (largest) eigenvalue and its corresponding Q eigenvector, respectively; then, the selection index in the context of MESIMis
pm MESIM MESIM
Y =β′ p (p′pm =
[
p′ m′]
) and, because(
θ′MΣMβM)
2=µ , the maximized selection response can be written as RMESIM =k µ . From (Q−µI)βM = 0 it is possible to determine the βM coefficients of YM =β′pp+β′mm (Eq. 3), β′M =[
β′P β′m]
. Although the partial derivatives of Φ are obtained with respect to βM and θM, in estimating YMESIM andµ k
RMESIM = , the vector of economic weights (θM) is not required because βM and µ are obtained directly from matrix Q.
Note that when information on the QTLs linked to the molecular markers is not incorporated into the selection index, i.e., when Y =β′p, Z =θ′g, and
Sβ β Σθ θ
Σβ θ
′ ′
′
=k Z
R σ , then Eq. 7 can be written as
(S−1Σ−µI)β=0 (8) from where it is evident that Q= S−1Σ. Equation 8 can be considered a variant of the procedure developed by CERÓN-ROJAS et al. (2006) for cases where the assumption of ESIM (Σθ=β) is relaxed.
As indicated by CERON-ROJAS et. al. (2008), the maximized selection response,
MSI M MSI MSI k
for all traits considered simultaneously but does not provide genetic gains per trait at each selection cycle. Alternatively, the expected selection response (BAKER 1986; VAN VLECK 1993) determines the expected genetic gain per trait per selection cycle
=
G
M M M
M M k
β S β
β Σ
′ . However, Gestimates the expected value of the genetic gains with
low precision; thus in our simulated data we used the genotypic means of the selected individuals and the regression of the genotypic means of the selected individuals on the selection cycles for evaluating the efficiency of MESIM RESIM, ESIM, LANDE and THOMPSON, the restrictive selection index of KEMPTHORNE and NORDSKOG, and the SMITH selection index on the response to selection.
Matrix Q is square and nonsymmetric of order q×q (where qis the total number of variables: phenotypic and molecular scores)
Q= SM−1ΣM
− −
−
− −
= −
−
I M Σ M S I
0 M Σ M S
) (
) (
) (
) (
1 1
(9)
Therefore, it is not possible to construct a subset of orthogonal vectors from Eq. 7. However, orthogonal vectors from Q can be calculated by means of singular value decomposition (SVD) (MARDIA et al. 1982). Using SVD, Qcan be written as
Q =UDV′ (10) where the columns of matrix U(U′U=I) are the left singular vector of Q, and the
The problem now is to determine: From where should the first singular vector for constructing YMESIM be taken, from U or from V? Note that Eq. 10 can be written as QV =UD, from where it is evident that if µ is the first singular value of Q, and v1and
1
u are its associated left and right first singular vectors, respectively, then Qv1 =µu1, from
where 1 1 1
1 S Σv
u =µ− −M . Let βMESIM =u1, then βMESIM is a linear transformation of v1. The estimators of µ=µMESIM and βMESIM are obtained from QˆQˆ′, such that
0 β
I Q
Qˆ ˆ′− ˆMESIM )ˆMESIM =
( µ2 . According to ANDERSON (2003), µˆMESIM2 and βˆMESIM are the maximum likelihood estimators of the eigenvector and eigenvalue of QQ′, respectively, and are asymptotically consistent and unbiased. The estimators of Q, U, V, and D are Qˆ , Uˆ , Vˆ , and Dˆ , respectively, so Qˆ =UˆDˆVˆ′. These results allow estimating YMESIM as
=
MESIM
Yˆ βˆMESIM ppm. Asymptotically, E(YˆMESIM) ≈ YMESIM (where ≈ means approximately).
When only one trait and its molecular scores are considered,
= 2 2
2 2 m m m M s σ σ σ S , = 2 2 2 2 m m m g M σ σ σ σ
Σ , and Q=
− − − − 1 0 2 2 2 2 2 2 2 2 m g m m g s s s σ σ σ σ σ
. When σm2 =0, then
= 0 0 0 2 s M S , = 0 0 0 2 g M σ
Σ and Q=
0 0 0 2 h
, where s2 and σg2 are the phenotypic and genotypic
variances of the trait, respectively, 2
m
σ is the variance of the molecular score associated
with the trait under selection, and 2
2 2
SIMULATED DATA
Generating a doubled haploid population for selection
The original data were taken from an actual doubled haploid maize mapping population of 236 genotypes with five traits; QTLs for all five traits were mapped. The five traits measured were: male flowering time (MFL) (days), female flowering time (FFL) (days), plant height (PHT) (cm), ear height (EHT) (cm), and 100-kernel weight (HKF) (grams). This data file was used to generate 200 doubled haploid genotypes that form the reference population (cycle 0). Using a selection pressure of 10% (k=1.755), 20 genotypes were selected under MESIM, the LANDE-THOMPSON, ESIM, RESIM, SMITH selection index, and the restrictive selection index of KEMPTHORNE and NORDSKOG . These 20 selected doubled haploids were then crossed in diallel fashion, and a new population of 200 doubled haploids was generated. This was repeated during five selection cycles for all five traits. The efficiency of the indices was compared using the mean genotypic value and the regression of the mean genotypic value of the selected genotypes on the selection cycles. We used phenotypic, genotypic, and molecular score variance-covariance matrices for estimating the singular vectors and singular values.
We also generated populations based on selection of individual traits with the objective of comparing MESIM and the LANDE-THOMPSON (1990) molecular selection index method for the simultaneous selection of five traits.
Sign of the coefficients, economic weights, and expected genetic gains
signs are always negative (decreasing the mean genotypic value), whereas for HKF the signs are always positive (increasing the mean genotypic value).
Concerning the economic weights for the LANDE-THOMPSON molecular selection index, the restrictive selection index of KEMPTHORNE and NORDSKOG (1959), and the SMITH (1936) selection index, economics weights were assigned following SMITH et al. (1981). Then, one set had coefficients of 1 or -1, and the other had the heritability of each trait multiplied by 1 or -1, depending on the trait. Therefore, for MFL, FFL, PHT, EHT, and HKF, the first set of coefficients was -1, -1, -1, -1, and 1, respectively, whereas the second set of coefficients was -hMFL2 ( -0.51), -hFFL2 (0.46),
-2
PHT
h (-0.38), -hEHT2 (-0.52), and hHKF2 (0.27); all coefficients of the molecular markers associated with the traits were equal to zero. All five traits were simultaneously selected under MESIM, the LANDE-THOMPSON, ESIM, and the SMITH selection index, whereas for the restrictive selection index of KEMPTHORNE and NORDSKOG and RESIM, the traits that were unchanged were MFL and PHT.
RESULTS AND DISCUSSION
The genotypic means under MESIM and LANDE-THOMPSON when selection is practiced on traits individually (not simultaneously on various traits) are shown in Table 1. Because genetic variability became exhausted, only two selection cycles were run. The MESIM-selected genotypes had better genotypic means than those selected under the LANDE-THOMPSON index for all five traits. To clarify the interpretation of the MESIM, consider, for example, the first selection cycle on the individual trait MFL. The estimated phenotypic, genotypic, and molecular score variances in the original population were
489 . 33 ˆ2 =
s , ˆ2 =18.156 g
σ , and ˆ2 =2.248 m
σ , respectively, from where
= 248 . 2 248 . 2 248 . 2 489 . 33 ˆ M
S ,
= 248 . 2 248 . 2 248 . 2 156 . 18 ˆ M
Σ , Qˆ =
1 49 . 0 0 51 . 0 , and = ′ Q
Qˆ ˆ
24 . 1 25 . 0 25 . 0 26 . 0 .
The first singular value and its associated singular vector are µˆ1 =1.14 and
[
0.2333 0.9724]
ˆ′ = MESIM
β , respectively. However, because MFL decreases, it is necessary to multiply the elements of βˆMESIM by -1 such that the selection index in the context of MESIM is YˆMESIM =−0.233MFL−0.9724mMFL, where MFL denotes the trait of interest, and
MFL
Table 1. Mean genotypic values under MESIM and LANDE-THOMPSON molecular selection indices when traits are selected individually until genetic variability is exhausted (cycle 2). The traits were male flowering (MFL), female flowering (FFL), plant height (PHT), ear height (EHT), and 100-kernel weight (HKF) for one and two selection cycles for simulated data using phenotypic, genotypic, and molecular score variance-covariance matrices. The signs and economic weights of the selection indices for each trait are shown in parentheses.
MESIM genotypic means LANDE-THOMPSON genotypic means
Selection MFL FFL PHT EHT HKF MFL FFL PHT EHT HKF
cycles (-) (-) (-) (-) (+) (-1) (-1) (-1) (-1) (1)
0 98.54 98.89 139.61 88.37 20.45 98.54 98.89 139.61 88.37 20.45 1 93.89 97.03 124.89 75.83 22.85 93.23 96.91 132.87 72.64 20.80 2 91.66 93.83 120.62 63.33 92.08 94.36 127.18 66.61
When selection is practiced on all five traits simultaneously, then weights -1, -1, -1, -1, and 1 for each trait are used; the heritability of the traits are also used as weights. The LANDE-THOMPSON molecular selection index is denoted as LANDE-THOMPSON1 when -1,-1,-1,-1, and 1 are used as weights, and when heritabilities are used as economic weights, it is denoted LANDE-THOMPSON2. Similarly, the standard SMITH selection index is denoted as SMITH 1 in the first case and SMITH 2 in the second case; and the KEMPTHORNE-NORDKOG restricted selection indices are denoted as KN1 and KN2, respectively.
LANDE-MESIM (-0.71 days) for maturity (Table 2). Comparing the genotypic means when individual traits are selected (Table 1) with those obtained when five traits are simultaneously selected (Tables 2), it is evident than the genotypic means are higher when only one trait is under selection. Correlations between traits play an important role in the correlated response of other traits.
Table 2. Mean genotypic values and gain per cycle of the 20 genotypes selected under MESIM,
LANDE-THOMPSON1 (economic weights are 1s and -1s) and LANDE-THOMPSON2 (economic weights are
heritability of the traits) molecular selection index for five traits selected simultaneously, male flowering
(MFL), female flowering (FFL), plant height (PHT), ear height (EHT), and 100-kernel weight (HKF) for
five selection cycles for simulated data using phenotypic, genotypic, and molecular score
variance-covariance matrices. The signs and economic weights of the selection indices for each trait are shown in
parentheses.
MESIM LANDE-THOMPSON1 LANDE-THOMPSON2
Selection MFL FFL PHT EH
T HKF MF
L FFL PHT EHT HKF MFL FFL PHT EHT HKF
cycle (-) (-) (-) (-) (+) (-1) (-1) (-1) (-1) (1) (-0.5)
(-0.46) (-0.38) (-0.5) (0.27)
0 98.5 98.9 139.6 88.4 20.4 98.5 98.9 139.6 88.4 20.4 98.5 98.9 139.6 88.4 20.4
1 97.0 98.4 123.5 74.3 21.3 98.7 99.5 130.5 80.7 20.8 98.0 98.7 127.1 76.1 21.3
2 96.5 99.1 118.7 70.9 21.3 97.0 98.4 123.6 71.3 20.6 96.9 98.2 129.1 74.3 19.6
3 96.1 96.5 119.2 64.8 21.6 96.0 97.9 122.5 66.6 21.5 95.7 97.0 121.8 68.5 20.6
4 95.9 95.8 117.4 60.8 22.7 95.3 98.4 119.2 64.1 21.6 95.0 97.2 120.4 70.7 21.9
5 94.4 95.6 114.9 59.4 23.0 94.4 96.6 117.6 59.9 21.2 94.8 96.4 119.9 67.9 22.1 Gain per
cycle
-0.71 -0.78 -4.04
-5.48 0.50 -0.91
-0.44 -4.15
-5.62 0.21 -0.83 -0.51 -3.59 -3.55 0.31
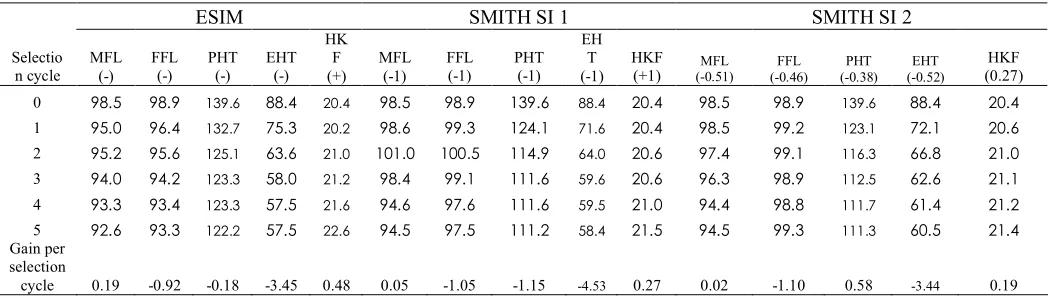
RESIM (0.48 grams) was greater than that obtained using KN1 RSI (0.27 grams) and KN2 RSI (0.19 grams). However, for FFL, the opposite was true, that is, KN1 RSI (-1.05 days) and KN2 RSI (-1.10 days) under both sets of economic weights were more effective than RESIM (-0.92 days) for maturity. The effective selection gain per cycle estimated as the linear regression of the mean genotypic trait value on the selection cycle is also shown in the last row of Tables 3 and 4.
Table 3. Mean genotypic values of the 20 genotypes selected under ESIM and Smith SI 1 and 2, for
five traits, male flowering (MFL), female flowering (FFL), plant height (PHT), ear height (EHT),
and 100-kernel weight (HKF), during five selection cycles for simulated data using phenotypic and
genotypic variance-covariance matrices. The gain per cycle is the regression coefficient of the mean
genotypic values regressed on the selection cycles. The signs and economic weights of the SIs for
each trait are shown in parentheses.
ESIM SMITH SI 1 SMITH SI 2
Selectio n cycle
MFL (-)
FFL (-)
PHT (-)
EHT (-)
HK F (+)
MFL (-1)
FFL (-1)
PHT (-1)
EH T (-1)
HKF (+1)
MFL (-0.51)
FFL (-0.46)
PHT (-0.38)
EHT (-0.52)
HKF (0.27)
0 98.5 98.9 139.6 88.4 20.4 98.5 98.9 139.6 88.4 20.4 98.5 98.9 139.6 88.4 20.4
1 95.0 96.4 132.7 75.3 20.2 98.6 99.3 124.1 71.6 20.4 98.5 99.2 123.1 72.1 20.6
2 95.2 95.6 125.1 63.6 21.0 101.0 100.5 114.9 64.0 20.6 97.4 99.1 116.3 66.8 21.0
3 94.0 94.2 123.3 58.0 21.2 98.4 99.1 111.6 59.6 20.6 96.3 98.9 112.5 62.6 21.1
4 93.3 93.4 123.3 57.5 21.6 94.6 97.6 111.6 59.5 21.0 94.4 98.8 111.7 61.4 21.2
5 92.6 93.3 122.2 57.5 22.6 94.5 97.5 111.2 58.4 21.5 94.5 99.3 111.3 60.5 21.4 Gain per
selection
Table 4. Mean genotypic values of the 20 genotypes selected under RESIM, KN1 SRI, and KN2
SRI, for traits female flowering (FFL), ear height (EHT), and 100-kernel weight (HKF) during five
selection cycles for simulated data using phenotypic and genotypic variance-covariance matrices.
The gain per cycle is the regression coefficient of the mean genotypic values regressed on the
selection cycles. The signs and economic weights of the SIs for each trait are shown in parentheses.
The restrictive traits are male flowering (MFL) and plant height (PHT).
RESIM KN1 SRI KN2 SRI
Selection cycle
MFL (-)
FFL (-)
PHT (-)
EHT (-)
HKF (+)
MFL (-1)
FFL (-1)
PHT (-1)
EHT (-1)
HKF (+1)
MFL (-0.51)
FFL (-0.46)
PHT (-0.38)
EHT (-0.52)
HKF (0.27)
0 98.5 98.9 139.6 88.4 20.4 98.5 98.9 139.6 88.4 20.4 98.5 98.9 139.6 88.4 20.4
1 97.4 96.5 141.3 84.1 20.2 97.4 96.3 141.2 84.2 20.2 97.7 96.33 140.4 82.8 20.0
2 97.7 94.8 143.6 80.2 20.6 99.4 95.6 143.5 80.3 20.5 98.8 95.2 145.1 81.6 20.5
3 97.2 94.0 141.2 76.4 21.7 98.2 94.7 139.8 74.4 21.1 97.6 94.0 143.1 75.9 20.1
4 98.4 94.5 140.7 76.7 22.4 97.4 93.9 137.7 70.5 21.4 97.7 93.7 145.2 75.5 21.1
5 99.2 93.9 139.9 71.1 22.1 98.9 93.3 135.2 67.8 21.4 98.7 93.1 141.9 71.58 21.1 Gain per
selection cycle 0.19 -0.92 -0.18 -3.45 0.48 0.05 -1.05 -1.15 -4.53 0.27 0.02 -1.10 0.58 -3.44 0.19
17 18 19 20 21 22 23 24
0 1 2 3 4 5
Cycle of selection
Gen
oty
pic
me
a
ns
of
100 kernel
wei
ght
(HKF)
(
gram
s)
MESIM ESIM RESIM Lande T1 Lande T2 Smith 1 Smith 2 KN1 KN2 MESIM
ESIM RESIM Fig. 1
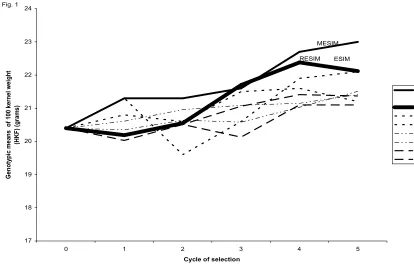
Fig. 1. Mean of the genotypic values of the selected genotypes under under MESIM,
LANDE-THOMPSON (Lande T1 and Lande T2) molecular selection indices, ESIM, SMITH selection
indices (Smith 1 and 2) RESIM, and KEMPTHORNE-NORDSKOG restricted selection indices (
KN1 and KN2 ) during five selection cycles of traits 100-kernel weight (HKF) (grams) using
simulated data. The simultaneously selected traits were male flowering (MFL), female flowering
(FFL), plant height (PHT), ear height (EHT), and 100-kernel weight (HKF). The weights used for
MFL, FFL, PHT, EHT, and HKF under the LANDE-THOMPSON molecular selection indices,
SMITH selection index, and KEMPTHORNE-NORDSKOG restricted selection index were -1, -1,
[image:39.612.125.539.88.357.2]88 90 92 94 96 98 100 102
0 1 2 3 4 5
Cycle of selection
G
e
n
otyp
ic
mean of female fl
owering
(F
FL) (Da
y
s)
MESIM ESIM RESIM Lande T1 Lande T2 Smith 1 Smith 2 KN1 KN2 Fig. 2
MESIM
RESIM
ESIM
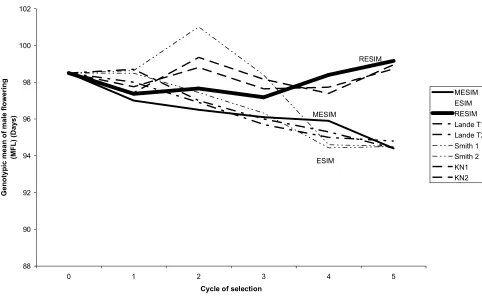
Fig. 2. Mean of the genotypic values of the selected genotypes under MESIM,
LANDE-THOMPSON (Lande T1 and lande T2) molecular selection indices ESIM, SMITH SI (Smith 1
and 2) RESIM, and KEMPTHORNE-NORDSKOG restricted selection index ( KN1 and KN2 ) for
five selection cycles of trait female flowering (FFL) (days) using simulated data. The
simultaneously selected traits were male flowering (MFL), female flowering (FFL), plant height
(PHT), ear height (EHT), and 100-kernel weight (HKF). The weights used for MFL, FFL, PHT,
EHT, and HKF under the LANDE-THOMPSON molecular selection indices, SMITH selection
index, and KEMPTHORNE-NORDSKOG restricted selection index were -1, -1, -1, -1, and 1,
[image:40.612.93.576.85.430.2]88 90 92 94 96 98 100 102
0 1 2 3 4 5
Cycle of selection
Genotypic mea
n
o
f male fl
o
wering
(MFL) (Days)
MESIM ESIM RESIM Lande T1 Lande T2 Smith 1 Smith 2 KN1 KN2 RESIM
MESIM
ESIM Fig. 3
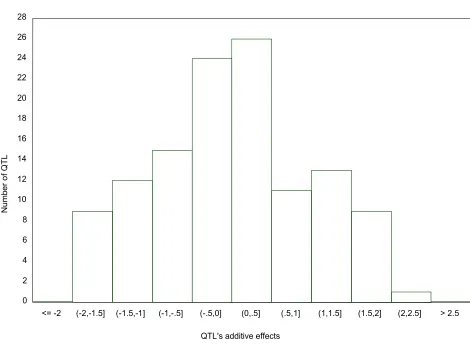
Fig. 3. Mean of the genotypic values of the selected genotypes under MESIM,
LANDE-THOMPSON (Lande T1 and Lande T2) molecular selection indices ESIM, SMITH SI (Smith 1 and
2) RESIM, and KEMPTHORNE-NORDSKOG restricted selection index ( KN1 and KN2 ) for five
selection cycles of trait female flowering (MFL) (days) using simulated data. The simultaneously
selected traits were male flowering (MFL), female flowering (FFL), plant height (PHT), ear height
(EHT), and 100-kernel weight (HKF). The weights used for MFL, FFL, PHT, EHT, and HKF under
the LANDE-THOMPSON molecular selection indices, SMITH selection index, and
KEMPTHORNE-NORDSKOG restricted selection index were -1, -1, -1, -1, and 1, respectively,
[image:41.612.90.572.158.462.2]It is worth noting that when the eigenvectors are obtained from the variance-covariance phenotypic and genotypic matrices, then MESIM, ESIM, and RESIM assign weights proportional to the heritability of the trait, that is, the higher the heritability, the more weight, and vice versa. As mentioned by CERON-ROJAS et al. (2006), a solution would be to use the phenotypic and genotypic correlation matrices. Another solution would be to use the inverse of Q (Q−1) and thus give more weight to traits with low heritability. The latter solution for constructing MESIM comes naturally from Eq. 7, since
0 β I Q− ) M =
( µ and be written as QβM =µβM , from where µ−1βM =Q−1βM. Then the equation to obtain the eigenvectors is Q− − −I β =0
M )
( 1 µ 1 , in which case Q−1=
M MS
Σ−1
− − − − − = − − I M S M Σ I 0 M S M Σ ) ( ) ( ) ( ) ( 1 1
; when only one trait and its molecular scores are
considered, then Q−1 =
− − − − 1 0 2 2 2 2 2 2 2 2 m g g m g m s s σ σ σ σ σ σ
, and when σm2 =0, Q−1=
0 0 0 1 2
h , from where it
is evident that traits with low heritability will have higher weights.
This research found that MESIM has three advantages over LANDE-THOMPSON 1 and 2: first, it can be used to solve practical problems faced by breeders attempting to select plants or animals for the next generation when no estimates of economic weights are available. Even if economic weights are available, in practice it is very unlikely that they would maximize the derivative of θ′MΣMβM with respect to βM and to θM (under the imposed restrictions). Furthermore, if two breeders are interested in improving, say, n traits, it is very unlikely that they would assign the same weights to them. Second, estimates of MESIM have known statistical sampling properties, but estimates for the LANDE-THOMPSON molecular selection index are unknown. Third, results from MESIM using simulated data show that realized genetic gains for various traits simultaneously are similar to, or higher than, those obtained by LANDE-THOMPSON (1990).
CONCLUSIONS
(CERÓN-ROJAS et al. 2006) when information on QTLs is incorporated through molecular markers. The sampling properties of ESIM (and therefore of MESIM) and its selection response are known, and its estimators showed desirable statistical properties such as consistency and asymptotic unbiasedness.
It should be pointed out that MESIM is more general than ESIM (CERÓN-ROJAS et al. 2006) because the basic underlying assumption made in ESIM, Σθ=β, is relaxed in MESIM. MESIM maximizes the selection response by maximizing the square of the correlation between YM and ZM, 2
M MZ Y
ρ , which is the same as maximizing
(
θ′MΣMβM)
2. This basic idea, used for developing a restrictive selection index (CERÓN-ROJAS et al. 2008), is valid for MESIM when no restrictions are imposed on any of the traits.Some advantages of MESIM over MSI should be pointed out: (1) the sampling properties of MESIM, RˆMESIM, are known and easy to evaluate; (2) the MESIM eigenvalue and eigenvector are estimated by the maximum likelihood method; and (3) a restrictive SI can be developed from MESIM when only some markers and/or traits are used. In summary, the results of this study indicate that MESIM is a generalization of ESIM when information on QTLs linked to molecular markers is incorporated.
between all traits-environments combinations, and markers; thus it implicitely introduces estimates of particular epistatic interactions into the seletion index. Further research on the used of MESIM in genome wide selection is required.
APPENDIX
Theoretical derivation of MESIM
The procedure shown below is a slight modification of that used by CERÓN-ROJAS et al. (2008 ) within the context of a restricted selection index method based on eigenanalysis (RESIM). In this case,
(
θ′MΣMβM)
2 must be maximized under the restrictions1 =
′MSMβM
β and θ′MΣMθM =1, i.e., we should maximize
Φ=
(
θ′MΣMβM)
2−µ(
β′MSMβM −1)
−ω(
θ′MΣMθM −1)
with respect to βM, θM, µ, and ω, where βM is the vector of MESIM coefficients, θM is the vector of economic weights, and µ and ω are Lagrange multipliers. In MESIM it is assumed that θM is not a vector of constants.
When Φ is derived with respect to βM, θM, µ, and ω, and the result is set to the null vector, it follows that
where Eqs. A.3 and A.4 denote the restrictions imposed for the maximization of
(
)
2M M MΣ β
θ′ with respect to βM and θM. Because the restrictions β′MSMβM =1 and 1
=
′MΣMθM
θ , when Eq. A.1 is multiplied by β′M and Eq. A.2 is multiplied by θ′M, both equations can be written as
(θ′MΣMβM)2−µ =0 (θ′MΣMβM)2−ω=0
Clearly,
(
θ′MΣMβM)
2 =ω = µ. Therefore, µ maximizes 2 M MZ Yρ under the restrictions 1
=
′MSMβM
β and θ′MΣMθM =1.
The following problem is to determine the vector βM, which allows constructing the selection index YM that has maximum correlation with ZM. Because
(
)
2M M MΣ β
θ′ =ω= µ, Eqs. A.1 and A.2 can be written as
µ ΣMθM −µSMβM =0 [A.5] µ ΣMβM −µΣMθM =0 [A.6] Multiplying Eq. A.5 by −1/2 −1
M
Σ
µ , we obtain that θ − Σ− S β =0 M M M M
1
µ , from where
M M M M Σ S β
θ = µ −1 is computed.
Substitute, in Eq. A.6, µΣ−M1SMβM for θM and get ΣMβM −µSMβM =0, from where Eq. 7 (see the text) is obtained
1 =
′MΣMθM
θ are the eigenvalues (µ) of the matrix Q and its eigenvector vector, βM, that allows constructing the index βMESIMp
MESIM
Y = ′ , that maximizes its correlation with m
θ g θ1′ + ′2 =
M
Z .
The authors are grateful to Jiankang Wang for his valuable assistant and help when running the simulation software QU-GENE. The authors thank the Associate Editor and two anonymous reviewers for their comments and suggestions, which significantly improved the quality of this paper. The authors are thankful to BIMBO-Mexico for partially funding this research.
LITERATURE CITED
ANDERSON, T. W., 2003 An Introduction to Multivariate Statistical Analysis. 3rd Ed. John Wiley and Sons, New Jersey.
ARUS, P., and J. MORENO-GONZALEZ, 1993 Marker-assisted selection, pp. 315-331 in Plant Breeding: Principles and Prospects. Hayward, M. D., N.O. Bosemark, and I. Romagosa (eds.). Chapman and Hall, University Press, Cambridge, Great Britain. BAKER, R. J., 1986 Selection Indices in Plant Breeding. CRC Press Inc., Boca Raton,
Florida.