University of Applied Science
Bachelor´s Thesis
Business Process Management and Process Mining
Author: Guillermo Gutiérrez Román
Director: Professor Dr. Bernd Stauss
February 22
nd, 2018
1. INTRODUCTION 3
2. BUSINESS PROCESS MANAGEMENT 3
2.1. BUSINESS PROCESS 3
2.2. WHAT IS BUSINESS PROCESS MANAGEMENT 5
2.3. DIFFERENT PERSPECTIVES OF BUSINESS PROCESS MANAGEMENT (BPM) 5
2.3.1. BPM IS A CORE INTERNAL CAPABILITY 5
2.3.2. BPM ADDRESSES THE DELIVERY OF VALUE TO CUSTOMER 6
2.3.3. BPM ADDRESSES END‐TO‐END WORK AND THE ORCHESTRATION OF ACTIVITIES ACROSS BUSINESS FUNCTIONS 6
2.3.4. BPM ADDRESSES WHAT,WHERE,WHEN,WHY AND HOW WORK IS DONE, AND WHO IS RESPONSIBLE FOR
PERFORMING IT 7
2.3.5. BPM MANAGES PROCESS IN A CLOSED‐LOOP CYCLE TO ENABLE CONTINUOUS IMPROVEMENT. 7
2.4. HISTORY AND DEVELOPMENT OF BUSINESS PROCESS MANAGEMENT ALONG THE TIME 8
2.5. STATE OF THE ART OF BUSINESS PROCESS MANAGEMENT 11
3. BUSINESS PROCESS MODELS 14
3.1. PETRI NETS 14
3.2. WORKFLOW NETS 15
3.3. SWIM LANES 16
3.4. UNIFIED MODELING LANGUAGE UML 16
3.5. IDEF 17
3.6. BUSINESS PROCESS MODEL &NOTATION BPMN 18
3.7. EVENT PROCESS CHAIN,EPC 19
4. PROCESS MINING 21
4.1. WHY PROCESS MINING IS USEFUL FOR BPM 21
4.2. WHAT IS PROCESS MINING 22
4.3. DATA SCIENCE AND PROCESS SCIENCE 23
4.4. HISTORY OF PM 25
4.5. PROCESS MINING CONCEPTS 27
4.6. TYPES OF PROCESS MINING 31
4.7. DISCOVERY TECHNIQUES,⍺-ALGORITHM 31
4.7.1. ⍺-ALGORITHM 32
4.7.2. ADVANCED TECHNIQUES 37
5. CONFORMANCE CHECKING 39
5.1. MAIN USES OF CONFORMANCE CHECKING:BUSINESS ALIGNMENT AND AUDITORY 40
5.2. TECHNIQUES 41
5.2.1. COMPARING FOOTPRINTS 41
5.2.2. TOKEN REPLAY 45
5.2.3. ALIGNMENTS 52
6. APPLICATION OF PROCESS MINING TECHNIQUES ON A DATA LOG GIVEN 57
6.1. PRESENTATION OF THE PROBLEM AND DATA 57
6.2. DATA PRE-TREATMENT 58
6.3. APPLICATION OF PROCESS MINING TECHNIQUES. 65
6.4. DISCUSSION OF THE RESULTS AND RECOMMENDATIONS. 76
7. CONCLUSION 76
1.
Introduction
This Bachelor´s Thesis has been written aiming to answer three questions:
• What is Business Process Management?
• What is Process Mining?
• How a Process Mining project is managed?
These two concepts are, maybe, the newest disciplines within the fields of Process Management and Data Science respectively nowadays.
Business Process Management is a broad discipline which surrounds knowledge from information technology, management sciences and industrial engineering, and during the last decade, has become a standard for managing and improving business processes. On the other hand, Process Mining is a discipline belonging to Data Science study field, it was born few years ago and provides, through different software solutions, the tools for discovering business processes, checking the conformance between the real process and the modelled, and enhancing the current business processes in order to get a better explanation of the real business processes´ behaviour.
Nevertheless, these two concepts are not independent one another since Process Mining is orientated to analyse and improve business process, making easier the main purpose of Business Process Management, creating value for the enterprises through the proper managing of their business processes.
This literature will provide a background of both disciplines, which is vital at time to get familiar with the current trends about management and data science.
In order to achieve this goal, the thesis is structured as follows:
Firstly, Business Process Management is introduced, its different perspectives, develop of the discipline along the time, as well as the enablers that allow making this discipline, a key instrument at time to manage the business processes.
Secondly, it will be introduced the concept of Process Mining in depth. The three types of process mining, Discovery, Conformance Checking and Enhancement will be discussed emphasising on Discovery and Conformance Checking, moreover, it will be explained the main techniques about both of them.
Last but not least, the thesis will conclude with the analysis of a real Event Log extracted from SAP where it will be tried to discover a business process.
2.
Business Process Management
2.1.
Business Process
Figure 1. Example of a business process. Source: [1]
In the example, it is shown the different activities, as well as the different stakeholders that intervene during a sales process.
Within the organizations, business processes are split into different categories: Operational or primary processes, supporting or secondary processes, and management processes.
Name Description Example
Operational processes
Operational processes represent the core business activities and value chain. They will create value for the costumer by producing products or services.
Take customer order Develop the products
Supporting processes
Supporting processes are vital for the company since they guarantee a proper performance of the operational processes. However, they do not provide value to the costumer directly.
Human resources Accounting
Management processes
Management processes cover all activities related with leading, setting goals, and organizing within the company.
Budgeting
Strategic planning Decision making
2.2.
What is Business Process Management
Business Process Management is a management discipline which presumes that enterprise´s organizational goals can be achieved through the definition, engineering, control and dedication to continuous improvement of business process [3]. The main targets BPM try to achieve are [4]:
Target to improve Definition
Business Agility
Capacity of an enterprise to front and adapt for changes in its environment through changing their integrated process.
Effectiveness Capability for achieving the strategic aims.
Efficiency Relation between the obtained results and
needed resources.
Table 2 Improvements reached with the application of BPM. Source: own elaboration based on: [3].
Although the definition of Business Process Management is a good start, Business Process Management includes many perspectives which must be explained for the comprehension of the concept in its fullness. [3]
2.3.
Different perspectives of Business Process Management (BPM)
2.3.1.
BPM is a Core Internal Capability
A successfully implementation of Business Process Management, should provide the organizations the capability to reach the strategic objectives through the adoption of and creation of three vital points.
Point Function Example
New process
The creation of processes which support the
management of business process.
The monitoring and control of business process execution. The continuous improvement of business processes over time in response of external changes.
Specific roles New roles and people who engaged in the management of business process.
Process Architects responsible for definition and design of process.
Process Analyst responsible for build, deployment, monitoring and optimization of business process.
Specialized technologies
Supporting and making easier the management of business process.
Design business process for deployment.
Execute business process in operations.
2.3.2.
BPM addresses the delivery of value to customer
Regardless of whether an organization is for-profit, not-for-profit, or a government entity, the main organization´s purpose is to deliver value to costumer, in form of products and services, either external to the organization customers or customers between functions within an enterprise.
Figure 2. Source: own elaboration based on [3]
Organizations successful in business process management instil and foster a culture of customer focus at the enterprise level, the functional level, and down through the role level.
Business Process Management is about optimizing the means by which this value is delivered.
2.3.3.
BPM
addresses end‐to‐end work and the orchestration of
activities across business functions
Business Process Management and Functional Management disciplines must cohabit and work together for the organization to remain competitively viable.
Organizations exist to deliver value to customers in terms of products
or services.
All organizational objectives should therefore trace to delivery of value
to customer.
Business processes are the vehicles by which products and services are created and delivered to customer.
Business Process Management establishes the means by which business processes are managed.
Discipline Description
Functional Management
Ensures execution of the functional disciplines required to produce the
organization’s products and services.
Business Process Management
Ensures work is coordinated across these functions, in order to deliver products and services in the most effective and efficient manner possible.
Table 4 Disciplines within organizations Source: own elaboration based on [3].
2.3.4.
BPM addresses What, Where, When, Why and How work is
done, and Who is responsible for performing it
A Business Process Management discipline must accommodate the means by which What work is done, How work is done, When, Where, Why, by Whom.
A well‐structured process definition will provide the right amount of visibility and detail to the various consumers of this information, potentially across all levels of the organization. That is why a process definition should be fit for purpose and fit for use.
Objective of
Information Description
Fit for Purpose
The process definition contains all necessary information to answer the Who, What, Where, When, Why, and How questions it is intended to address.
Fit for Use
The process definition is structured to represent this information in the most efficient and effective manner possible, considering the needs of the recipient.
Table 5 Amount of detail should be aligned with these objectives. Source: own elaboration based on [3].
2.3.5.
BPM manages process
in a closed‐loop cycle to enable
continuous improvement.
Organizations with mature BPM capabilities lead their processes through a closed-loop cycle that addresses the planning, design, implementation, execution, measurement, control, and continuous improvement of business processes.
Figure 3. PDCA cycle Source: own elaboration based on: [3]
Phase Objective
Plan Aligning business process context and internal process with the organization´s strategic objectives
Do Deployment of the process per the specifications developed in “Plan” phase and commit the process to
the operations.
Check Process performance is compared against performance expectations.
Act
Making determinations and react accordingly to
process data collected during the “Check” phase. This
phase allows maintenance of process integrity in spite of environmental changes and ensures continual improving to reach new performance goals over time.
Table 6 PDCA applied to BPM Source: own elaboration based on [3].
At this point, it is easy to notice that BPM is much more than a theoretical definition. Therefore, BPM is a complex discipline, which takes many years to adopt and implement, and requires several changes within the organization, such as the commitment from top-to-bottom organization, it means, from the executive leadership which defines and support the practice of BPM, to the functional managers who must collaborate with process owners on the design and execution of business processes, and the operations staff who must work in virtual team in order to ensure value delivery to the end customer. The creation of new roles and the support with the Information Technologies are also vital in order to achieve an effective implementation of BPM.
2.4.
History and development of Business Process Management along
the time
Plan
Do
It is true that BPM is a very recent concept, if organizations nowadays are able to manage, optimize, and adapt their business process with the efficiency they do, it is due to the contribution of many people and the evolution of the different management disciplines along the history. The table below shows what were the most important
Phase Time Focus Business Technology Tools/Enablers
Industrial Age 1750 - 1960s
-Specialization of Labour
-Task Productivity -Cost Reduction
-Functional Hierarchies -Command & Control -Assembly Line -Mechanization -Standardization -Record- keeping -Scientific Management -PDCA Improvement Cycle -Financial Modeling Information Age
1st Wave Process
improvement 70s-80s
-Quality Management -Continuous Flow -Task Efficiency
-Multi-Industry -Enterprises -Line of Business -Organization
-Mergers & Acquisitions
-Computerized Automation -Management -Information Systems -MRP -TQM -Statistical Process Control -Process Improvement Methods
2nd Wave Process
Reengineering 1990s
-Business via Internet -Business process reengineering -Business Innovation
-Flat Organization -End-to-end Processes -Value Propositions –
Speed to Market, Customer Intimacy, Operational Excellence
-Enterprise Architecture -ERP
-CRM
-Supply Chain Mgt
-Activity Based Costing -Six Sigma
-Buy vs. build -Process Re-design/ Reengineering Methods
3th Wave Business
Process Management 2000+
-Assessment,
Adaptability, & Agility -24X7 Global Business -Continual
Transformation
-Networked Organization
-Hyper Competition -Market Growth Driven -Process Effectiveness over Resource Efficiency -Organizational Effectiveness over Operational Efficiency -Enterprise Application Integration -Service Oriented Architecture -Performance Management software -BPM Systems -Balanced Scorecard -Self Service & Personalization -Outsourcing, Co-Sourcing, In-sourcing -BPM Methods
As far back as 1911, Frederick Winslow Taylor (1856-1915) introduced the basics of the management culture. The result of his work was a scientific point of view of the workflow and the improvement of process and workers based in analysis and results. The first wave covered the Just in Time philosophy adoption by American companies. The increasing use of the computers, allowed the statistical software development and related data gathering techniques that measured, gathered, and interpreted results. During the second wave appeared more efficient data managing software. On the other hand, organizations turned from corporate mission focus and brainstorming into
cross-functional teams, changing the “how” by “why”.
The third wave began in the mid 1990s and continues in the present as the “coming of
age” of process-focused business. Technology is shifting from being a process driver to a process enabler. The identity of the customer changed from markets to individuals with customized solutions. Just-in-time manufacturing of the first wave led to just-in-time supply chains of the third wave, with the accompanying need to understand processes across disparate enterprises.
2.5.
State of the art of Business Process Management
Nowadays BPM has become the paradigm of organization´s management all over the world. Thus, there is a big world around this new management discipline, what surround from universities that are already providing formation programmes in BPM to big companies which are adopting the standards of this philosophy as well as many BPM´s associations and consultant companies which try to lead organizations during the adoption of BPM. Some facts are below exposed in order to support the previous ideas. Worldwide known names in fields of Leadership, Management, Human Development and Organizational Development, have recognized that BPM brings to the companies the resources for a quick adaptation to the needs of customers, adoption the new IT, and competitive advance.
Name Career Quote
Michael Martin Hammer
American engineer, management author, and a former professor of computer science at the
Massachusetts Institute of
Technology (MIT), known as one of the founders of the management theory of Business process reengineering (BPR).
"BPM is the improvement of products and services using structured services optimization based on systematic design and management of business process". [6]
Robert Samuel Kaplan
American accounting academic, and Emeritus Professor of Leadership Development at the Harvard Business School.
"Executives must lead by adapting to dynamic, highly competitive
Peter Michael Senge
American systems scientist who is a senior lecturer at the MIT Sloan School of Management.
"If people do not share a common vision, and do not share common mental models about the business reality within which they operate, empowering people will only increase organizational stress and the burden of management to maintain coherence and direction”. [8]
Table 8 Some representative important characters who support BPM. Source: own elaboration based on: [6] [7] [8].
International organizations and universities try to develop and consolidate theories and offer formation programmes about BPM.
Name Location Services
Club BPM [9] Latin America and Spain
Spreading and promoting the BPM as the most profitable discipline that Spanish and Latin American organization could adopt.
Provide professional with its BPM: RAD (Rapid Analysis & Design) methodology in order to a faster implantation of BPM discipline.
Consulting during the BPM implantation.
Provide formation and certification in BPM discipline
Continuous researching in BPM evolution.
ABPMP [10] Global
Education and Certification in BPM competency model
Training providers, organizations and Educational Institutions that ABPMP International Board has approved to offer training in BPM knowledge areas.
BPM Institute
[11] United States of America
Formation and Certification in 6 different areas related with BPM: Agile Business Analysis
Business Architecture
Business Process Management Digital Decisioning & Analytics Operational Excellence
SOA
BPM Centre [12]
Eindhoven University of
Technology TU/e (Netherlands), and Queensland University of Technology QUT (Australia)
OMG BPMN
[13] Global
OMG is the responsible of the standardization of BPMN (Business Process Model & Notation), and support another modeling languages, such as UML (Undefined Modeling Language).
Table 9 Some BPM association around the worlds. Source: own elaboration based on [9] [10] [11] [12] [13].
IT Organizations are investing many resources for the development of BPM suites and supporting software.
Name Product
IBM IBM Business Process Manager [14]
SAP SAP NetWeaver Business Process
Management [15]
Oracle Oracle BPM Suite [16]
Aura Portal Aurora BPM Suite [17]
Camunda
Open source platform for BPM and workflow. [18]
It is possible to create:
• BPMN workflows.
• CMMN cases.
• DMN decisions.
Signavio Signavio Process Manager [19]
Table 10 Technology Expertise Organizations which provides BPM solutions. Source: own elaboration based on [14] [15] [16] [17] [18] [19].
Most international companies are adopting this management discipline in order to solve different organizational problems. There are some representative examples in the following table.
Enterprise Supplier Problem Results
Adidas [20] Bizagi
To deliver process
automation across various departments including supply chain, marketing, finance, retail and e-commerce.
Adidas connected 500 sales operations, 400 factories and multiple SAP and supplier systems to streamline over 5,000 purchase order changes per month, resulting in operational cost savings of 60%. [20]
Toyota Spain
[21] Aura Portal Toyota wanted to stablish the Environmental Management
Systems standard ISO 14001
in every concessionaire resulted in: 98% compliance the
standard, improvement of 70% in wasted time on intern auditions, improvement of 80% on intern communication flow, improvement of 88% on Analysis Capability Bayer Healthcare [22] ARIS Process Performance Manager
Bayer needed to monitor SAP timely data entry and
inventory accurately without having a lot of resources. The company was facing those challenges with its existing scorecard implementation based on SAP KPI.
After implantation, Bayer Healthcare
achieved: Daily reporting of business process performance, process analysis capabilities in the hands of managers, elimination of manual creation of SAP Scorecard, scalable application can be used for many other
processes, ability to analyse data source other than SAP
Table 11 Companies which have opted for implantation of BPM solutions. Source: own elaboration based on: [20]. [21] [22].
3.
Business Process Models
After introducing business process management philosophy, it is moment to talk about the different bias and languages to translate those business processes into a formal and intuitive sequence of activities, such that all stakeholders can easily understand, in other words, create a business process model.
There are many different languages to translate business processes into models. In this chapter, the most commonly used ones will be mentioned as well as the modelling languages needed for good understanding of the process mining techniques which will be shown at a later stage.
3.1.
Petri Nets
Table 12 Basic structures of Petri nets. Source: own elaboration.
As a result of the combination of the elements showed below, different types of splits
and joins, such as AND split/join, XOR split/join…are configured and thus, the petri net is built.
Figure 4. Petri Net. Source: [23]
Petri net is governed by firing rules, tokens, the black dots in figure above, can represent, people, items, documents, etc. The tokens can flow through the Petri net, and the state of a Petri net is determined by the distribution of their tokens. If a place contains at least one token that place is marked. In the figure above, P1, P3, and P4 are marked.
3.2.
Workflow Nets
Workflow nets are a sub-class of Petri nets. The main difference is that Workflow nets are characterized by a place where the process starts and a place where the process ends.
Name Description representation. Graphical
P P is a finite set of places.
T T is a finite set of transitions.
Figure 5. Workflow net. Source: own elaboration.
Workflow nets are particularly relevant in the context of BPM because it is easy to show the life-cycle of the instances in the process. Examples may be customer orders, job
applications… here the process model is initiated once for each case.
3.3.
Swim Lanes
Swim Lanes are not a modelling language itself, is rather a representative and useful notational addition, often incorporated into BPMN, EPC, UML, or simple flowcharting as a mean for defining the performer responsible for performing an activity.
Figure 6. Swim Lanes express different responsible. Source: [24]
3.4.
Unified Modeling Language UML
UML 2.5 (current version) is not complete and it is not completely visual. Given an UML diagram it is not possible to be sure to understand part of the process. Since some concepts in UML does not have a graphical representation at all.
There are two main big groups of diagrams:
• Structure diagrams: show staticstructure of the system and its parts on different abstraction and implementation levels and how those parts are related to each other. The elements in a structure diagram represent the meaningful concepts of a system, and may include abstract, real world and implementation concepts. [25]
• Behaviour diagrams: show the dynamic behavior of the objects in a system, which can be described as a series of changes to the system over time. [25] Within those two big groups, there are many other types of diagram, each one for a different purpose. But it does not belong to this literature.
Figure 7. Example of Document management process using UML 2.5. Source: [26].
For further information:
• http://www.uml.org
3.5.
IDEF
Integrated DEFinition is a family of modeling notation concepts. There are sixteen IDEF methodologies, nevertheless IDEF, for modeling business functions or systems, and IDEF3, for modeling business processes are the most used in BPM context.
Developed by US Air Force, it was widely used and available in many modeling tools for many years and is now in the public domain.
Star event Intermediate
event End event
Figure 8 Example of IDEF3 process diagram. Source: [27]
For further information:
• Draft Federal Information Processing Standards Publication 183.
3.6.
Business Process Model & Notation BPMN
Developed by Business Process Management Initiative (BPMI) and standardized by Object Management Group (OMG). Business Process Model and Notation is nowadays one of the most used languages to model business process. Since it is very intuitive and easy comprehensive for many audiences.
In BPMN 2.0 there are three basic types of notational elements:
• Task/Activities: task is the work unit, a work to do.
• Events: despite there are many types of event, a simple event express starting, ending, or middle happenings.
• Gateways: AND, OR, and XOR are the most used gateways, nonetheless, many other gateways based on different events are possible.
Element Symbol
Task
AND XOR OR Gateway
Table 13. Main elements in a BPMN model. Source: own elaboration based on: [28]
The following picture, Figure 9, shows an illustrative example of BPMN process model.
Figure 9 BPMN airline check-in, simple example. Source: [29]
Business Process Model and Notation is quite broader modelling language than here is explained, and contains many more elements.
For further information:
• http://www.bpmn.org
• http://www.omg.org
• http://www.bpmb.de/images/BPMN2_0_Poster_EN.pdf
3.7.
Event Process Chain, EPC
Event Process Chain is a widely used in Germany and many other countries in Europe, especially in multinational enterprises. It ranges from a very simple to very complex models, nevertheless in this literature will be only mentioned the basics.
AND OR XOR
Element Description Symbol
Activity
Describe an incidental task that typically consumes time and resources.
Event
Describe an occurred condition that cause a sequence of activities.
Logical
Operator in EPC AND, OR and XOR gateways are possible
Table 14 Main elements in EPC. Source: own elaboration based in: [30].
Figure 10. EPC example. Source: [31]
For further information:
• https://www.epc-standard.org/collaborate/Towards_EPC_standardization
• http://www.ariscommunity.com/
4.
Process Mining
4.1.
Why Process Mining is useful for BPM
organizations want to take advance of these data in order to find weak points and improve their own processes or generate advantage over the competence. This premise leads this literature to the next point, Process Mining.
The three types of process mining:
• Discovery: try to discover new business process through an event log
• Conformance: try to know whether the event log fits with the model proposed.
• Enhancement: propose and make improves in a business process model for a better explanation of the reality.
can be placed in the BPM lifecycle in the following way.
Figure 11. Discovery, conformance, and enhancement within the BPM lifecycle. Source: [32].
Process mining is becoming a vital support tool at the time to manage processes. Since now it makes very easy discover, check and improve business process.
Examples of how process mining may help organizations are, for example, the capacity of process mining for detecting bottlenecks and delays during the execution of the real processes.
On the other hand, process mining allows the application of the standards such as ISO 14000 (Environmental Management), ISO 9000 (Quality Management) and the analyse of the compliance, as well as a fast detection of deviations and misalignments in the real process.
4.2.
What is process mining
route of the real process, including, for example, the resources that execute the process or the time that take to complete an activity.
It is important to distinguish the difference between process mining and process monitoring, since process mining is a discipline that tries to turn information, hosted in the data generated by the events, into useful knowledge in order to improve, discover or check the conformance of the business processes. Whereas process monitoring is a real time analysis of the performance of the different processes, generally manufacturing processes. Process monitoring is conducted using checklists and guidelines. Those checklists are developed jointly with project staff. The same checklists and guidelines are used by field staff while implementing project activities.
The main purpose of the Process Mining is fill the gap and act as the bridge between data science and process science [33],p 25. Therefore, is vital to know what data science is and what is process science.
4.3.
Data Science and Process Science
Data science is a multidisciplinary discipline composed of many different sub-disciplines related with data analysis, and how to turn these data into value, in form of reports, diagnostics, predictions, and recommendations. The main disciplines that compose Data Science are presented on the table below.
Discipline Description
Statistics It is the origin of data science. It is typically split into descriptive and inferential statistics.
Algorithms They are vital in any approach analysing data. The larger is a data set, the more important is the algorithm.
Data Mining Is the analysis of data sets in order to find unsuspected relationships and to summarize the data in novel ways that are useful for the data owner.
Machine learning Try to develop computer programs that automatically improve with the experience.
Process mining
It seeks the confrontation between event data and process model, for example, by discovering models from event data, or checking whether a model is aligning with what happen in the real-life process.
Predictive analytics it consists in extracting information from data sets, in order to determine patterns and predict future outcomes and trends.
Databases They are used to store data. Must serve to two purposes, structuring data easily and providing scalability and reliable performance.
Visualization & visual
analytics The purpose of this discipline is to ease the interpretation of result after making an analyse. Business models &
marketing Try to turn data into value, including business value.
Behavioural/ social science
Behavioural science is the analysis of social behaviour, while social science studies the social systems and the
relationships among individuals within a society, both in order to influence people guiding the costumer to a product. Privacy, security, laws
and ethics In order to ensure the confidentially of the data and avoid the bad ethical conducts.
Table 15 Data science set of disciplines. Source: own elaboration based on [33],pp 12-17.
The term “process science” is used to group many disciplines which range from knowledge about information technology to knowledge about management science with the purpose of improving and running operational processes. Now it is showed the most important disciplines of this broad working field.
Discipline Description
Stochastics It provides a repertoire of techniques to analyse random processes. That is done in order to allow the model for analysis.
Optimization Techniques which aim to provide the best alternative from al large or even infinite set of alternatives. Operation
management & research
It deals with the design, control and management of products, processes, services and supply chains.
Business process management
As it has been shown, it is the discipline that combines approaches for the design, execution, control, measurement, and optimization of business processes.
Process mining Attending the quote in the introduction, it is also part from the process science. The focus is not in process modelling, but exploiting event data generated in the processes.
Business process improvement
It is an "umbrella term" for a set of different disciplines which aim at process improvement such as TQM, Six Sigma and Lean,
BPR…
Process automation & workflow
management
It focuses in the development of information system supporting operational business process from the routing to the distribution of work. By changing the configuration of the developed model, the real one is changed.
Formal methods & currency theory
based on theoretical computer science, in particular, logic calculi, formal languages automata theory, and program semantics.
In conclusion, data science (data-centred) disciplines tend to search for relatively simple patterns in large data sets, such as association rules, decision trees, cluster, etc. However, these patterns do not describe the end-to-end process.
On the other hand, process science approaches focus on end-to-end process but do not count with the event data. Process mining provides a bridge between both, data science and process science management allowing go one step further in the analysis of business process.
4.4.
History of PM
The data collection is not an innovative activity. Therefore, human beings have been collecting data in order to turn it into value information and knowledge since they acquired the ability to write. In the ancient Babylonia 3000 B.C. They used mud tables where it was collected the data about the farming production or the loans and exchanges they carried out, with the purpose of knowing whether their farms were getting better, or someone debt too much letters of a credit. Another example are Egyptians, they had a very good structured data sets of population and income. [34] Statistics, what can be considered as the mother of data mining, is not either a new invent surged from the new technologies. The history of the statistic can be resumed in five big stages as it is showed in the following table.
Stage Age Description
1. Census 3000 (B.C.)- 15th century
It is the first stage of statistics, this is not the statistic as people know nowadays, but at the moment that a politic authority is built, the efforts for knowing the amount of people and the wealth of the country begin, and start the first administrative works.
2. Scientific
method 15th C. - 17th C.
During these centuries figures such as Leonardo de Vinci, Nicolas Copernicus, Galileo, Neper, William Harvey, Sir Francis Bacon and René Descartes made important contributions to the scientific method, so when the international commerce appeared, there was already an applicable method for dealing with economic data.
3. Theory of
probabilities 17th C. - 18th
4.Theory of observation errors, least squares, and correlation. 19th C.
Between 1800 - 1820, Laplace and Gauss developed the theory of the observation errors and with the help of Legendre, they also developed the method of least square. In the last part of 19th century, Sir Francis Gaston introduced the method known as Correlation, in order to measure the relative influence of the factors over the variables.
5. Theoretical
statistics 20th C.
Statistic is considered as an independent science and becomes what people know currently as statistics, appeared the Bayesian methods, multivariant analysis methods, The Theory of Games, and the probabilistic models.
Table 17 History of Statistic. Source: own elaboration based on: [35], [36].
With the emergence of computers, and afterwards, the internet, the amount of data is getting bigger following an exponential function, is at this point, when emerge the need of new techniques and methods for analysing and getting useful information from the data. The data mining is not a new term, since the 60´s there were terms used by statisticians such as data fishing, data archaeology or even data mining with the purpose of finding correlations within the data without a previous hypothesis.
It is during the 80´s when the term Data Mining acquire its importance as a part of a bigger process called KDD, Knowledge Discovery in Databases (1889). Data mining is an opportunity for the organizations for dealing with massive volume of data, and analyse it in order to find useful information for the marketing projects. From 2000 on, the internet became a tool used for most of the people, so data mining techniques and methods evolved for trying to cover all the types of data, therefore, appearing techniques as OLAP (On-Line Analytic Process) or EDA (Exploratory Data Analysis) which surround multivariate exploratory techniques and neural networks.
In 2010, data mining is just a part of a larger set of disciplines known as data science, and it is at this point, when the analysis of data is not only important down the point of view of finding trends and trying to influence consumer to buy a product or service, but the organizations, want to know more about their processes, whether they are working in the correct way, uncover new processes from the data sets, or improve their own processes. Data mining splits in a new discipline called Process Mining, which emerge in order to solve all these points.
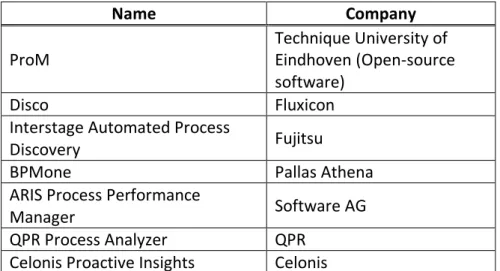
The term process mining is a relatively new. It was introduced in detail in the “Process
Mining Manifesto”[37], published in 2012(final version), written by 77 researchers and
Name Company
ProM Technique University of Eindhoven (Open-source software)
Disco Fluxicon
Interstage Automated Process
Discovery Fujitsu
BPMone Pallas Athena
ARIS Process Performance
Manager Software AG
QPR Process Analyzer QPR
Celonis Proactive Insights Celonis
Table 18 Some companies that offer their own Process Mining Suites. Source: own elaboration.
Nowadays process mining allows companies to take advance of that in order to improve and support their business processes in a quick changing and competitive environments.
4.5.
Process Mining concepts
Process mining is an emerging research discipline sat between data mining on the one hand, and process modelling and analysis on the other. Process mining provides a set of computational techniques and software, which allow organizations to extract information and create knowledge from it, by analysing End-to-End business process, more specifically, the event data generated by them. Event logs are the starting point of process mining techniques, they are stored in some Information System, for example an ERP such as SAP. The next figure illustrates an example of event log.
Every row in the Figure 12, corresponds to an event, the set of events that belong to the same case ID, conform a trace, in Figure 12, it is possible to observe, for example the trace for the case2 2(Create purchase requisition, create request for quotation
requester, analyse quotation…). An event has different properties (columns). There are three generic properties that must appear in every event log for being able to extract useful information from it:
Property Description Why is vital Figure 3
Case ID
A case identifier, is necessary to distinguish different executions of the same process. What precisely the case ID is depends on the domain of the process.
Case ID is necessary to distinguish the different executions of the same process.
The case ID represents a purchase order.
Activity
Represent process steps or status changes that were performed in the process.
Data must be detailed enough. Therefore, to guarantee that one can access to the whole history of a case, it is vital to add some identifier that express what steps was executed in each case.
The activity name refers to a Purchase activity
Timestamp
Timestamp is a time indicator that points the moment at each activity started and ended.
At least one
timestamp is needed, in order to bring the events in the right order. Timestamps are needed to identify delays between activities and bottlenecks.
There are two timestamps, one for the start of the activity, and one that indicates the end of that activity.
Table 19 The three vital properties in all event log. Source: own elaboration.
Figure 13. Example of business process model represented via BPMN2.0. Source: [39].
The business process in Figure 13 consists in the creation of an order for an item, it follows, in a logical sequence, how the activities are being executed, and how the process go through the different departments.
Process models should be balanced between four quality criteria: fitness, simplicity, precision, and generalization.
Property Objective
Fitness The ability to explain the observed behaviour.
Simplicity
Occam´s razor, the model should be as simple as possible.
Precision
Avoiding underfitting. If the model is too general it can explain the observed behaviour, but it will not be possible extract useful information.
Generalization Avoiding overfitting. If the model is too specific, may not fit with future events.
Table 20 Four properties of process models. Source: own elaboration.
Figure 14. Three ways to relate the model with the reality. Source: [40]
Relationship Input Output Description
Play-in Event log Process model A process model is built in base on an event log. It is very useful for discovering process mining.
Play-out Process model Event log
It is referred to the classical use of a model. Having a model, it is used for simulating new
Replay Both process model and event log
Extended model, reports, diagnostics…
The event log is replayed and contrasted with the process model. The objectives can be: to extend the model adding
frequencies in order to detect bottlenecks, to check the
conformance between the model and the reality, and predict new behaviours between others.
Table 21 Play-in, Play-out, and Replay explanation. Source: own elaboration.
It is important to notice that relationships between the models and the logs are directly linked to the three different types of process mining, since depending on the type of process mining it is being used, a different relation will be used as well. However, play-in, play-out, and replay just refer the way in which a model or event log can relate each other. Discovery, conformance, and enhancement techniques, are which provide the means for making it possible.
4.6.
Types of Process Mining
Process mining is used in order to support the take of decisions, implement improvements in the business processes or check whether the process is working or not, on the way it is supposed to do. There are three different types of process mining.
Type Purpose
Discovery
Producing models from an event log, without using any other a priori information. There are many techniques to generate process model from raw event data, for example ⍺ algorithm, which is able to discover a Petri net by identifying basic process patterns in the event log. Process discovery is often used as starting point for other types of analysis.
Conformance
Comparing an existing process model with an event log of the same process. The comparison shows where the real process deviates from the modelled process. Conformance checking can be used to check whether reality, as recorded in the log, conforms to the model and vice versa.
Enhancement
Taking an event log and process model and extend or improve the model using the observed events. This third type of process mining aims at changing or extending the a priori model.
Table 22 Types Of process mining. Source: own elaboration based on [41].
Once the Event log is obtained, discovery techniques try to discover a process, in the case of ⍺-algorithm, represented via Petri net, which fits with the behaviour observed on the event log. These techniques are play-in type and the most famous of them is the
⍺-algorithm.
4.7.1.
⍺
-algorithm
This algorithm, because of its simplicity, is a good point for introducing the topic of process discovery, however, this algorithm should not be seen as a very practical technique as an isolated algorithm, that is because it has some problems at time to deal with noise, short loops, and complex routes or event logs. Nevertheless, many of its ideas have been embeddedness in more complex and robust techniques.
The ⍺-algorithm scans the event log looking for some particular patterns. There are four log-based ordering relations that aim to capture important patterns in the log.
Pattern Characterisation Description
Direct succession x > y if xy is observed in log traces "…xy…".
Casualty x → y If in the traces "...xy…" is observed but not "...yx…".
Parallel x || y If both, "…xy…" and "…yx…" are observed.
Unrelated x # y if neither "…xy…" nor "…yx…" are observed.
Table 23 The four patterns in ⍺-algorithm. Source: own elaboration.
The typical pattern representations that can be found are the following:
Type Pattern Figure
Sequence a→b
XOR-join a→c, b→c, a#b
AND-split a→b, a→c, b||c
AND-join a→c, b→c, a||b
Figure 15. Basic process patterns. Source: [33], p 169.
There are two assumptions that should be consider.
• Perfect information, completeness.
• Absence of noise in the log.
In order to a better understanding it will be showed one simple example step by step. Considering the event log L1= [abcd, acbd, aed], the log-based ordering relations are:
> L1 [(a,b),(a,c),(a,e),(b,c),(b,d),(c,d),(c,b),(e,d)]
→ L1 [(a,b),(a,c),(a,e),(b,d),(c,d),(e,d)] || L1 [(b,c),(c,b)]
# L1 [(a,a),(a,d),(b,b),(b,e),(c,c),(c,e),(d,a),(d,d),(e,b),(e,c),(e,e)]
Table 24 Log based ordering relations. Source: own elaboration
Now the footprint can be built. The footprint is a matrix that shows the type of relation between the activities that compose the traces.
a b c d e
a # → → # →
b ← # || → # c ← || # → #
d # ← ← # ←
e ← # # → #
By analysing the footprint, a rough sketch is drawn following the next rules.
Ti, initial transition. In the table, there is no incoming
edges ( → ) in the column if its
transition. Ti= a
T0, final transition. in the table, there is no outcoming
edges ( ← ) in the column if its
transition. T0=d
Tn, rest of transitions.
Table 25 Initial transition Ti, final transition T0, and Tn transitions. Source: own elaboration
In the table, by using the symbols →, and || the following graph can be constructed.
Figure 17. Rough sketch. Source: [42].
Now with this graph the following table is built. In it, it is represented the maximal set A, B. It means, the different places it must be added to the Petri net, as well as the pattern that represent each pair {A, B}. In order to configure the table, it is important to follow the next rules:
• ∀a1, a2∈A:a1 # a2
• ∀b1, b2∈B:b1 # b2
• ∀a1∈A, ∀b1∈B:a1→b1
A B
p1 {a} {b,e}
p2 {a} {c,e}
p3 {b,e} {d}
p4 {c,e} {d}
Table 26 Patterns for the Petri net. Source: [42].
The result of fix the different patterns is the following Petri net.
Figure 18. Final Petri net. Source: [42]
Figure 19. ⍺-algorithm. Source: [33], p 171.
Step Explanation Example:L1= [abcd, acbd, aed]
1. It is checked which activities appear in the log TL. These will correspond to the transitions of the generated Petri-net.
T
L= {a,b,c,d,e}2. TI is the set of star activities.
T
I= {a}3. TO is the set of end activities.
T
O= {d}Steps 4 and 5 form the core of the ⍺-algorithm. It is aimed at constructing places named p(A,B), such that A is a set of input transitions (•p(A,B) = A) and B is the set of output transitions( p(A,B)• = B) of p(A,B).
All elements of A should have causal dependencies with all elements of B, i.e., for all (a,b) A x B: a⟶LB. Moreover, the elements of A should never follow one another, i.e., for all a1, a2 A:
a1#La2. Similar requirements for B.
4.
XL is the set of all such pairs that meet
the requirements just mentioned above.
X
({a},{b,e}),({a},{c,e}), L={
({a},{b}),({a},{c}), ({a},{e}),({b},{d}),({e},{d}),({c},{d}),({b,e},{d}),({c,e},{d})
}
5. YLmaximal pairs are removed, otherwise contains all maximal pairs, non-there would be too many places.
Y
L={
({a},{b,e}), ({a},{c,e}), ({b,e},{d}), ({c,e},{d})}
6.
PL contains every element (A, B) YL, these correspond to a place p(A,B)
connecting transitions A to transitions B.
PL also contains a unique source place iL
and unique sink place oL.
P
L={
p
({a},{b,e}), p
({a},{c,e}), p
({b,e},{d}), p
({c,e},{d}),
iL, oL}
7.
Here, the arcs of the WF-net are
generated. All start transitions in TI have
iL as an input place and all end transitions
TO have oL as output place. All places
p(A,B) have A as input nodes and B as output nodes.
FL=
{
(a,p
({a},{b,e})), (p
({a},{b,e}),
b) (p
({a},{b,e}),e), (a,p
({a},{c,e})), (p
({a},{c,e}), c), (p
({a},{c,e}),e), (b,p
({b,e},{d})), (e,p
({b,e},{d})), (c,p
({c,e}, {d})), (e,p
({c,e},{d})), (p
({b,e},{d}), d), (p
({c,e},{d}), d), (iL,a),(d,oL)
}
1. TL= {t T | L t },
2. TI= {t T | L t = first ()},
3. TO= {t T | L t = last ()},
4. XL= {(A, B) | A TL A B TL B a A b B a L b a1, a2 A a1 #L a2 b1, b2 B b1 #L b2},
5. YL = {(A, B) XL | (A´, B´) XL A A´ B B´ (A, B) = (A´, B´)},
6. PL = {p(A, B) | (A, B) YL} {iL , oL},
7. FL = {(a, p(A,B)) | (A, B) YL a A} { (p(A,B), b) | (A,B) YL b B} {(iL , t) | t TI} {(t, oL) | t TO},
8.
The result is a Petri net ⍺L = (PL, TL , FL)
that describes the behaviour seen in event log L.
Table 27 ⍺-algorithm step by step and example. Source: own elaboration based on [33], pp 171-174.
The -algorithm has some limitations that should be mentioned.
Limitation Example log -algorithm should do -algorithm does
Loops of
length 1. [ac,abc,abbc,abbbc]
Loops of
length 2. [abd,abcbd,abcbcbd]
Non-local
dependencies. [acd,bce]
Table 28 Limitations of -algorithm, examples. Source own elaboration based on [42].
⍺-algorithm was developed by Will van der Aalst et al in 2006, from then on, many variations has been developed, however, ⍺-algorithm must not be seen as a practical algorithm, since it was used to explore the theoretical limits of process discovery [33], p 239..
4.7.2.
Advanced techniques
⍺+-algorithm
⍺+-algorithm is the next step of the ⍺-algorithm, and it can deal with short loops (lengths
1 and 2), by adding two new log-based ordering relations.
• a △ b⟺a △ b⟺ there is a subsequence ...aba...aba... in the logs. • a ♢ b⟺a ♢ b⟺ there are sequences ...aba...aba... and ...bab...bab... and redefining the relations which caused the error.
• a→b⟺a>b∧(b≯a∨a ♢ b). This way we can correctly identify the follow relation
when there's a loop of length 2.
It solves two of the three main problems of the ⍺-algorithm. About non-local dependencies, it is not an isolated problem of the ⍺-algorithm, since is a problem shared by many of discovery mining techniques nowadays.
There are many discovery mining techniques, but for practical use, it is vital that noise and incompleteness are well-handled, and few discovery algorithms can do that. That is why, for this literature, just three has been chosen. Each algorithm will be described briefly in order to have an idea of how it works.
Heuristic mining
Heuristic mining algorithms are characterized by taking frequencies of events and sequences intoaccount when constructing a process model.
A good example of heuristic mining approach is:
1. A rough model of the process is created, for example, using the -algorithm. 2. The model is refined first, by analysing the frequency of each trace that appears
in the log, and after setting the minimum number of times that a trace must appear in the log to be considered determinant, the traces that do not appear enough are omitted, and if it does not compromise the rest of traces, that path from the model is erased.
3. The dependency between activities are quantified,
|𝑎 →𝐿 𝑏| =
{
|𝑎 >𝐿 𝑏| − |𝑏 >𝐿 𝑎|
|𝑎 >𝐿 𝑏| + |𝑏 >𝐿 𝑎| + 1 𝑖𝑓 𝑎 ≠ 𝑏 |𝑎 >𝐿 𝑎|
|𝑎 >𝐿 𝑎| + 1 𝑖𝑓 𝑎 = 𝑏
for example, through this equation, it is possible to uncover the fraction of times that one activity follows another and itself, what make possible to deal with loops of any length and add paths, that were not discovered by the -algorithm, improving the model.
The basic idea is that infrequent paths, should not be incorporated into the model. That makes the approach to the solution more robust than most other approaches.
This approach is very generic but there are other powerful heuristic approaches such as Fuzzy mining.
For further information:
• Heuristic mining: [33], pp 201-207.
• Fuzzy mining: [43]
Genetic Process Mining
Evolutionary approaches such as Genetic algorithms for process mining try to mimic the natural evolution. Such approaching is not deterministic and depend on randomization to find new solutions.
Step Description
Initialization
The initial population is created. The processes (individuals) generated may have little to do with the event log. While the activities are the same, the behaviour is completely different.
Selection
The fitness of each individual is computed. Fitness function determines the quality of each individual with the log. A simple example of fitness function can be the proportion of traces in the log that can be replayed in the model.
Reproduction
The selected parents, are used to create a new offspring. Here two genetic operators are used, crossover and mutation. First is applied the crossover, two parents (models) are taken and used for creating two new models. These models are added to the pool with the other child models. Then these child models are modified by different mutations. Again, fitness is computed and the best past to the next round (elitism) and produce new offspring.
Termination The evolution process terminates when a satisfactory solution is found. A determined fitness can be an example of the criteria for terminating the process.
Table 29 Four steps for Genetic Process Mining. Source: own elaboration based on [33], pp 207-209.
For further information: [33], pp 207-209.
Inductive Mining
Inductive process discovery techniques are based on well-known data mining technique, Decision Trees. The translation of the decision tree into the inductive process discovery techniques is a Process Tree. Inductive mining techniques include members that can handle infrequent behaviours and deal huge models and logs while ensuring formal correctness criteria. On the other hand, the result returned by these techniques can be easily turned into Petri-nets or BPMN models. Inductive mining is currently one of the leading process discovery approaches due to its flexibility, formal guarantees and scalability.
For further information: [33], pp 222-236.
5.
Conformance checking
Conformance checking relates events in the log with the activities in the process model and compare both. It is relevant for business alignment and auditory, since the log can be replayed in order to find deviations suggesting fraud or inefficient. Besides, conformance checking can be used for measuring the performance of the discovery techniques, and repairing models that are not aligned with the reality.
Figure 20. The main idea of Conformance Checking. Source: [33], p 244.
5.1.
Main uses of conformance checking: Business alignment and
auditory
There are many practical applications of conformance checking, nevertheless, the most known are: Business alignment and auditory.
Name Goal Motivation Process mining as support
Business Alignment
The goal is to make sure that the information system and the real business process are well alignment.
Most organizations use product software, these softwares are not developed for a specific
organization. A good example is SAP, which is based on so-called "best practices", i.e., typical scenarios and processes are implemented. Despite of such process are configurable, the particular needs of an organization may be not the same from what the software offers. On the other hand, processes may change faster that the information system, due to external influences.
Process mining can assist in improving the
alignment of information systems, business
processes, and the organization. By analysing the real
processes and diagnosing deviations and
Audit
Evaluating the organizations and their processes.
Ensure that the processes are executed respecting the boundaries set by managers, governments, and other
stakeholders. Specific rules may be enforced by law or companies’
policies. And the auditor should check whether these rules are followed or not. It is made by analysing a small set of samples of different processes.
Process mining allows to evaluate all events in a business process. And It can be done while the process is still running, providing new ways of auditing.
Table 30 Business Alignment and Auditory. Source: own elaboration based on: [33], pp 243-246.
Part of audits, are bound to check GRC, “Governance, Risk management and Compliance”. These terms surround the organizations’ capability to reliably achieve objectives, address uncertainty and act with integrity. It is important to highlight that process mining, in particular conformance checking, is a powerful tool for supervising the compliance of the standards and regulations both external and internal. Since conformance checking can be used to reveal deviations, defects, even near incidents. However, as mentioned, there are other uses for process mining, such as repairing models, which consist in, after applying conformance checking techniques, it is possible to make a diagnosis about the model and paths that are never taken can be removed from the model or, to the contrary, activities those often appear and are not in the model, can be added to the model.
After an introduction of the conformance checking and how it can help the companies to align their business process and improve the quality of the audits. Now it is moment to explain the main techniques to reach these targets.
5.2.
Techniques
The conformance checking techniques are mainly focused in one of the four quality criteria. Among fitness, precision, generalization, and simplicity, fitness is what is most related with conformance, that is why it will be introduced how fitness can be quantified.
5.2.1.
Comparing Footprints
𝑓𝑖𝑡𝑛𝑒𝑠𝑠(𝐿, 𝑁) = 1 −Ν𝑑𝑒𝑣 𝑁
Note that, Ndev, is the number of cells that do not match, whereas N is the total number
of cells on the matrix.
The following event log, Lfull, and models N1 and N2, will illustrate how does this
approaching work. Event log Lfull:
Frequency Reference Trace
455 𝞂1 (a,c,d,e,h)
191 𝞂2 (a,b,d,e,g)
177 𝞂3 (a,d,c,e,h)
144 𝞂4 (a,b,d,e,h)
111 𝞂5 (a,c,d,e,g)
82 𝞂6 (a,d,c,e,g)
56 𝞂7 (a,d,b,e,h)
47 𝞂8 (a,c,d,e,f,d,b,e,h)
38 𝞂9 (a,d,b,e,g)
33 𝞂10 (a,c,d,e,f,b,d,e,h)
14 𝞂11 (a,c,d,e,f,b,d,e,g)
11 𝞂12 (a,c,d,e,f,d,b,e,g)
9 𝞂13 (a,d,c,e,f,c,d,e,h)
8 𝞂14 (a,d,c,e,f,d,b,e,h)
5 𝞂15 (a,d,c,e,f,b,d,e,g)
3 𝞂16 (a,c,d,e,f,b,d,e,f,d,b,e,g)
2 𝞂17 (a,d,c,e,f,d,b,e,g)
2 𝞂18 (a,d,c,e,f,b,d,e,f,b,d,e,g)
1 𝞂19 (a,d,c,e,f,d,b,e,f,b,d,e,h)
1 𝞂20 (a,d,b,e,f,b,d,e,f,d,b,e,g)
1 𝞂21 (a,d,c,e,f,b,d,e,f,c,d,e,f,d,b,e,g)
Models N1 and N2:
Figure 21. Model N1. Source: [33], p 248.
Figure 22. Model N2. Source [33], p 248.
Therefore, the footprint matrixes for Lfull and N1 are:
Footprint of Lfull:
a b c d e f g h
a # → → → # # # #
b ← # # || → ← # #
c ← # # || → ← # #
d ← || || # → ← # #
e # ← ← ← # → → →
f # → → → ← # # #
g # # # # ← # # #
h # # # # ← # # #
Footprint of N1:
a b c d e f g h
a # → → → # # # #
b ← # # || → ← # #
c ← # # || → ← # #
d ← || || # → ← # #
e # ← ← ← # → → →
f # → → → ← # # #
g # # # # ← # # #
h # # # # ← # # #
Figure 24. Footprint of N1. Source: [33], p 264.
The fitness for this example is 1, due to the footprint of both, Lfull and N1 are the same.
Now it is the turn of N2:
Footprint of N2:
a b c d e f g h
a # → → # # # # #
b ← # # → # ← # #
c ← # # → # ← # #
d # ← ← # → # # #
e # # # ← # → → →
f # → → # ← # # #
g # # # # ← # # #
h # # # # ← # # #
Figure 25. Footprint of N2. Source [33], p 264.
Therefore, there are some cells that do not match:
a b c d e f g h
a →:#
b ||: → →:#
c ||:→ →:#
d ←:# ||:← ||:← ←:#
e ←:# ←:#
f →:#
g
h
Figure 26. Differences between Lfull and N2. Source: [33], p 264.
The cells in red in the Figure 26, are the ones that do not match, note that for example,
this movement is not possible. Now, it is easy to compute the fitness by applying the previous equation. Thus, the conformance based on the footprints is 1 −1264= 0.8125 Conformance analysis based on footprints is only useful if the log is complete, it means that all activities that can follow one another do so at least once in the log. Because of
usually the log is not complete this approaching won’t be chosen for the experimental
part of this literature.
5.2.2.
Token replay
Token replay approach, based on [33], pp 246-267, consists in, having an event log and a Petri-net model, the event log is replayed trace by trace. By doing it, it is possible to uncover deviations between the model and the reality. The basic idea of token replay is the following one. Over the model a token is generated, it will be consumed and again generated by executing activity by activity of each trace moving through the places of the model. When one activity is not possible to be executed in the order that the trace indicates, or that activity does not exists in the model, one fictitious token will be created in order to finish the succession of activities in that trace, whereas the real token will stay remaining. After doing it with the whole log, the number of tokens that have been created, consumed, generated, and remaining, are quantified, making possible to calculate the fitness.
Finally, there are four accumulative parameters that must be taken into account in order to calculate the fitness.
Name Abbreviation Explanation
Produced
tokens p When the environment produces tokens in the places, then a token is "produced".
Consumed
tokens c When the environment consumes tokens in the transitions, then a token is "consumed".
Missing
tokens m
When one of the transitions cannot be triggered in the model and it is necessary to add a token in some place for completing the replaying of the trace. Then a missing token is added.
Remaining
tokens r
When a token remains in a place and is not consumed after replaying the trace. Then a token is remaining.
Table 32. Token replay fitness parameters. Source: own elaboration.
After replaying a trace, fitness of the trace replayed in the model N, follows the equation:
𝑓𝑖𝑡𝑛𝑒𝑠𝑠(𝜎, 𝑁) =1 2(1 −
𝑚 𝑐) +
1 2(1 −
Therefore, they will be shown a couple of example, in order to illustrate how does token replay approach work.
Supposing the Event log Lfull introduced before and the models N1 also introduced above
alongside the new model N3: Model N3:
Figure 27. N3. Source: own elaboration based: [33], p 248.
![Table 8 Some representative important characters who support BPM. Source: own elaboration based on: [6] [7] [8]](https://thumb-us.123doks.com/thumbv2/123dok_es/6038971.171720/12.892.134.799.104.303/table-representative-important-characters-support-source-elaboration-based.webp)
![Table 9 Some BPM association around the worlds. Source: own elaboration based on [9] [10] [11] [12] [13]](https://thumb-us.123doks.com/thumbv2/123dok_es/6038971.171720/13.892.128.830.105.239/table-bpm-association-worlds-source-elaboration-based.webp)
![Table 11 Companies which have opted for implantation of BPM solutions. Source: own elaboration based on: [20]](https://thumb-us.123doks.com/thumbv2/123dok_es/6038971.171720/14.892.133.855.107.662/table-companies-opted-implantation-solutions-source-elaboration-based.webp)
![Table 13. Main elements in a BPMN model. Source: own elaboration based on: [28]](https://thumb-us.123doks.com/thumbv2/123dok_es/6038971.171720/19.892.126.822.106.233/table-main-elements-bpmn-model-source-elaboration-based.webp)
![Table 14 Main elements in EPC. Source: own elaboration based in: [30].](https://thumb-us.123doks.com/thumbv2/123dok_es/6038971.171720/20.892.128.769.101.755/table-main-elements-epc-source-elaboration-based.webp)
![Figure 11. Discovery, conformance, and enhancement within the BPM lifecycle. Source: [32]](https://thumb-us.123doks.com/thumbv2/123dok_es/6038971.171720/22.892.133.752.331.750/figure-discovery-conformance-enhancement-bpm-lifecycle-source.webp)
![Table 15 Data science set of disciplines. Source: own elaboration based on [33],pp 12-17](https://thumb-us.123doks.com/thumbv2/123dok_es/6038971.171720/24.892.122.796.103.352/table-data-science-set-disciplines-source-elaboration-based.webp)