Characterization of University Drop-Out at UNRN Using
Data Mining. A Study Case
Sonia Formia 1, Laura Lanzarini 2 and Waldo Hasperué 2,3 1
Applied Computer Science Laboratory – LIA Bachelor's Degree in Systems, UNRN - Atlantic Coast Delegation
2
Institute of Research in Computer Science – LIDI School of Computer Science. UNLP 3
CONICET scholarship
[email protected], {laural, whasperue}@lidi.info.unlp.edu.ar
Abstract. At the National University of Río Negro (UNRN), and its Atlantic Coast Delegation in particular, it is an increasing concern for the courses corresponding to the Bachelor's Degree in Systems, the drop-out and crumbling rates observed in the first four years of the Institution. This paper describes the process of identifying the most relevant features of the problem through which, using Data Mining (DM) techniques, a college drop-out model can be obtained for the academic unit mentioned above. In order to identify the most relevant features, after processing the data we will analyze attribute projections for the expected classes or responses. The results of its application to the student data from the courses of the UNRN have been satisfactory, which allows making some recommendations aimed at reducing the percentage of students who drop put from their courses.
Keywords: Attribute Selection. Attribute Projection. Data Mining. University Drop-Out.
1 Introduction
The organization being studied is the National University of Río Negro, which was founded in 2008 and started its graduate programs in 2009. There are currently a total of 60 graduate programs. From the very beginning, both the authorities and the educators working in the various programs have been concerned about the high drop-out and crumbling rate observed, despite the short life of the Institution. The main purpose is being able to determine potential academic failure situations in advance so as to apply measures aimed at minimizing the problem.
On the road to achieving the ultimate goal, predicting drop-out, other goals may be found that contribute non-trivial, useful information for the decision-making process, such as describing or characterizing UNRN students by means of profiles that help guide the implementation of measures at those levels where they can have the greatest positive effect.
environments aimed at facilitating the application of DM techniques in educational contexts have been developed [8].
This paper is part of what is known as the Knowledge Discovery in Databases (KDD) process, whose purpose is the automatic discovery of patterns present in available information without specifying any hypotheses beforehand. Its application requires the identification, based on the problem to be solved, of the information on which work is going to be done, as well as the desired type of model to be obtained. The latter strongly affects the technique to be used.
The available information is obtained from the SIU-Guarani system of the UNRN. That is, for each student there is a significant number of features pertaining to their personal, academic and work situations. Selecting the appropriate features from this data set to build a model can be a challenge. There is a proportional relation between the number of attributes to be used and the complexity of the model to be obtained. For these reasons, the early discovery of the most relevant attributes is desirable in order to simplify the model and reduce the time required to obtain it.
This paper is organized as follows: Section 2 describes the pre-processing stage carried out on the original data, Section 3 details how these were considered, Section 4 details other strategies previously used to solve this problem, Section 5 describes the attribute selection process based on projections, Section 6 presents a model based on the selected attributes, and Section 7 presents the conclusions drawn.
2 Preparing UNRN Data
Before applying a specific DM technique, the data had to be verified to avoid inconsistencies. This stage was guided by the data preparation methodologies surveyed in the literature and previous experience in the field.
Those attributes with an excessive number of missing data were deleted, any outlying values were cleaned, constant and redundant attributes were removed, and generalization was used to transform high-cardinality attributes. Non-generalizable attributes were deleted, the cardinality of some attributes was reduced by using more general categories, new attributes were built by means of summarization operations, attributes were discretized based on algorithm requirements, and range normalizations were performed. Finally, a state attribute was defined that differentiates between students who have dropped out (after one year with no academic activity) and those who are regular students.
3 Approach
As a first measure, to understand the data available and describe the domain of the problem, it was decided that the target set of students being studied, i.e., the records corresponding to those students who dropped out, would be characterized. This would allow selecting the most relevant features for drop-outs. Among the descriptive tasks provided by data mining, clustering is one of the most frequently used; its purpose is obtaining groups or sets within the examples, so that the elements assigned to the same group are similar [10].
In our study case, the information available includes demographic, economic, social, family, and academic data of the students. By means of the k-means clustering algorithm, drop-outs were segmented into groups. The tests carried out showed the true dimension of the problem. The large number of attributes involved did not allow finding a set of descriptive clusters for the input data.
At this point, DM tools had to be used to guide the selection of a subset of features (attributes) that are relevant for the problem.
4 Previous Work
The authors in [19] used the input data set formed by drop-outs and transformed the feature space by means of two completely different processes: one of the wrapper type and another one of the filter type.
Wrapper processes classify the attributes selected based on the performance of the model that can be built from them [11]. There are various ways to do this. The authors in [19] used a selection process of the Selection Forward type. This technique starts the feature search procedure by assessing all subsets of attributes formed by a single attribute, then finds the best subset of two attributes, then a subset of three attributes, and so forth until the best subset of features is found. To validate the sets of features, the performance of a given learning model is considered. In this case, the k-means method was used to group the available information. The use of an inductive algorithm is what makes this method a wrapper-type process.
The second selection method that was implemented is focused in the genetic selection of the features [12]. The genetic algorithm carries out a heuristic search that minimizes the natural evolution process. For the assessment, it uses the CFS (Correlation-based Features Selection) method, which creates a filter based on the performance measured for the set of features. It assessed the value of a subset of attributes considering the predictive ability of each feature together with the redundancy degree among them, and giving preference to subsets of attributes that are highly correlated with the class but whose inter-correlation is low [13].
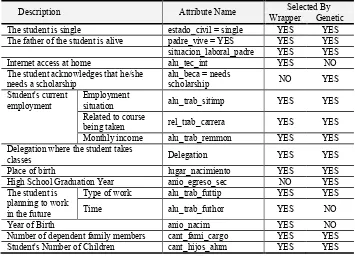
Once both methods were implemented on the input data, it could be seen that they both yielded similar subsets of attributes (see Table 1).
Table 1. List of attributes selected by the wrapper and genetic methods
Description Attribute Name Selected By
Wrapper Genetic
The student is single estado_civil = single YES YES
The father of the student is alive padre_vive = YES YES YES situacion_laboral_padre YES YES
Internet access at home alu_tec_int YES NO
The student acknowledges that he/she needs a scholarship
alu_beca = needs
scholarship NO YES
Student's current employment
Employment
situation alu_trab_sitimp YES YES
Related to course
being taken rel_trab_carrera YES YES
Monthly income alu_trab_remmon YES YES
Delegation where the student takes
classes Delegation YES YES
Place of birth lugar_nacimiento YES YES
High School Graduation Year anio_egreso_sec NO YES
The student is planning to work in the future
Type of work alu_trab_futtip YES YES
Time alu_trab_futhor YES NO
Year of Birth anio_nacim YES NO
Number of dependent family members cant_fami_cargo YES YES Student's Number of Children cant_hijos_alum YES YES
In order to check the validity of the attributes selected by the methods described, all drop-out student records were re-grouped based on the attributes selected by the wrapper method and supported by the other algorithms presented. The groups resulting after this run are compared with those obtained with the previous one, and it was observed that less than 10% of the students had been assigned to a different group, indicating that the clustering criterion remains the same despite the use of a smaller set of features.
Then, the same clustering algorithm was applied to non drop-outs and a similar segmentation was obtained for the main attributes to that of drop-outs, which supports the use of the selected attributes in predictive drop-out algorithms.
5 SOAP: Selection of Attributes by Projection
This section describes how to select the most representative attributes using the SOAP (Selection of Attributes by Projection) method [15]. Unlike those used in the previous section, this is a filter that measures attributes and establishes a deterministic ranking to reduce computation time.
For attribute selection, a measure is used that is based on a single value: NLC (Number of Label Changes), relating each attribute with the label used for classification. The value of NLC is calculated by projecting the examples on the axis that corresponds to this attribute (i.e., by sorting all examples by the attribute in question), and then the axis is run from its origin up to the highest attribute value and the number of label changes that occur is counted:
SOAP Algorithm.
Input: E–data set (m examples, n attributes) Output: R–attribute ranking
R {}
for i = 1 to n do Sort E by attribute Xi NLCi CountChanges(E; Xi) end for
R (attribute ranking based on NLC)
Function CountChanges(E; Xi)
Input: E–data set (m examples, n attributes), Xi–attribute to process
Output: Changes–Number of label changes R {} Changes 0 for j = 1 to m do
if xj;i ε Multiple_Sorted_Sequence
Changes Changes + SeeChangesForSameValue() else
if lab(ej) <> lab(ej+1) then Changes Changes + 1
end if end if end for
return(Changes)
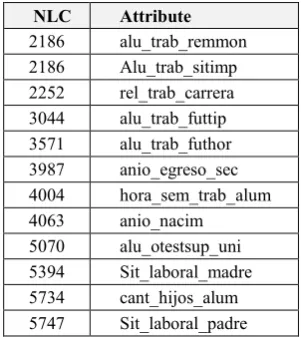
Table 2. First attributes in the ranking as per SOAP
NLC Attribute 2186 alu_trab_remmon 2186 Alu_trab_sitimp 2252 rel_trab_carrera 3044 alu_trab_futtip 3571 alu_trab_futhor 3987 anio_egreso_sec 4004 hora_sem_trab_alum 4063 anio_nacim
5070 alu_otestsup_uni 5394 Sit_laboral_madre 5734 cant_hijos_alum 5747 Sit_laboral_padre
5.1 Application of the SOAP Algorithm to the Study Case
The algorithm described above was implemented and applied to the study case. Only those records corresponding to students who dropped out from the program were considered, and were previously grouped by k-means to assign different labels to them. As in the processes described in the previous section, 5 groups were used (k=5). The results of applying the SOAP algorithm to drop-out student data, segmented into five groups, yield a full attribute ranking, where each attribute receives an NLC value. Top ranking values (lower NLC values, i.e., attributes that project a lower number of label changes) are shown in Table 2, sorted by NLC value.
If the attributes appearing at the top of the ranking are observed, it can be seen that those attributes that are related to student employment are predominant, together with those that describe student age and family responsibilities. These attributes were in general present in all attribute lists obtained with the feature selection algorithms that were implemented first (Table 1).
It can then be concluded that the most relevant features mainly include attributes pertaining to student age, work load, and family responsibilities.
Table 3: Performance of the tree built with the selected attributes (Table 2) using the C4.5 method and considering a confidence threshold of 0.25 and a minimum number of 2 elements per leaf.
Accuracy:69.84% True Drop-out True Taking courses Class precision
Pred Drop-out 5174 2047 71.65%
Pred Taking courses 1388 2414 63.49%
Class Recall 78.85% 54.11%
6 Predictive Drop-Out Model
Tests were carried out with algorithm C4.5 [14] using the top nine attributes in the
SOAP ranking (Table 2), except for “anio_egreso_sec,” which corresponds to the year the student graduated from high school. This is because the attribute “anio_nacim,”
representing the year the student was born, is already included, and both attributes are closely related to each other. Table 3 shows the performance of the model obtained.
It can be seen that the length of the list of attributes used is 56.25% of the list of attributes in Table 1 (9/16 = 0.5625). The attributes that were selected allow building a model that can successfully predict 71.65% of drop-out cases. The success rate is lower when predicting if the student is still taking courses.
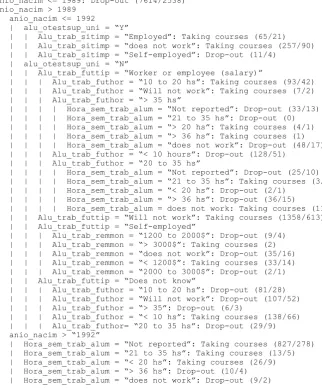
Figure 2 shows a pruned version of the resulting tree considering a minimum number of 10 elements per leaf.
7
Conclusions
This paper presents the application of a feature selection method based on projections that can operate on nominal and numeric attributes in a supervised manner. From the ranking it establishes for attributes, a cut-off point can be determined to identify those that are the most representative. In this case, its application allowed reducing the original list (Table 1) by more than 40% (the first 9 attributes in Table 2).
Table 2 shows that the most relevant attributes are those pertaining to student employment status, both regarding current employment and future employment plans. As preliminary product, clear guidelines can be obtained to guide the measures to be implemented to reduce student drop out rates at the UNRN: it is clear that student employment variables have a significant effect on their likelihood to continue with their studies, so any actions that specifically target this issue, such as a larger number of scholarships granted, could be a road to follow.
anio_nacim <= 1989: Drop-out (7614/2538) anio_nacim > 1989
| anio_nacim <= 1992
| | alu_otestsup_uni = “Y”
| | | Alu_trab_sitimp = “Employed”: Taking courses (65/21)
| | | Alu_trab_sitimp = “does not work”: Taking courses (257/90)
| | | Alu_trab_sitimp = “Self-employed”: Drop-out (11/4)
| | alu_otestsup_uni = “N”
| | | Alu_trab_futtip = “Worker or employee (salary)”
| | | | Alu_trab_futhor = “10 to 20 hs”: Taking courses (93/42)
| | | | Alu_trab_futhor = “Will not work”: Taking courses (7/2)
| | | | Alu_trab_futhor = “> 35 hs”
| | | | | Hora_sem_trab_alum = “Not reported”: Drop-out (33/13)
| | | | | Hora_sem_trab_alum = “21 to 35 hs”: Drop-out (0)
| | | | | Hora_sem_trab_alum = “> 20 hs”: Taking courses (4/1)
| | | | | Hora_sem_trab_alum = “> 36 hs”: Taking courses (1)
| | | | | Hora_sem_trab_alum = “does not work”: Drop-out (48/17)
| | | | Alu_trab_futhor = “< 10 hours”: Drop-out (128/51)
| | | | Alu_trab_futhor = “20 to 35 hs”
| | | | | Hora_sem_trab_alum = “Not reported”: Drop-out (25/10)
| | | | | Hora_sem_trab_alum = “21 to 35 hs”: Taking courses (3/1)
| | | | | Hora_sem_trab_alum = “< 20 hs”: Drop-out (2/1)
| | | | | Hora_sem_trab_alum = “> 36 hs”: Drop-out (36/15)
| | | | | Hora_sem_trab_alum = does not work: Taking courses (11/3)
| | | Alu_trab_futtip = “Will not work”: Taking courses (1358/613)
| | | Alu_trab_futtip = “Self-employed”
| | | | Alu_trab_remmon = “1200 to 2000$”: Drop-out (9/4)
| | | | Alu_trab_remmon = “> 3000$”: Taking courses (2)
| | | | Alu_trab_remmon = “does not work”: Drop-out (35/16)
| | | | Alu_trab_remmon = “< 1200$”: Taking courses (33/14)
| | | | Alu_trab_remmon = “2000 to 3000$”: Drop-out (2/1)
| | | Alu_trab_futtip = “Does not know”
| | | | Alu_trab_futhor = “10 to 20 hs”: Drop-out (81/28)
| | | | Alu_trab_futhor = “Will not work”: Drop-out (107/52)
| | | | Alu_trab_futhor = “> 35”: Drop-out (6/3)
| | | | Alu_trab_futhor = “< 10 hs”: Taking courses (138/66)
| | | | Alu_trab_futhor= “20 to 35 hs”: Drop-out (29/9)
| anio_nacim > “1992”
| | Hora_sem_trab_alum = “Not reported”: Taking courses (827/278)
| | Hora_sem_trab_alum = “21 to 35 hs”: Taking courses (13/5)
| | Hora_sem_trab_alum = “< 20 hs”: Taking courses (26/9)
| | Hora_sem_trab_alum = “> 36 hs”: Drop-out (10/4)
| | Hora_sem_trab_alum = “does not work”: Drop-out (9/2)
References
1. La Red Martínez, D. L., Acosta, J. C., Cutro, L. A., Uribe, V. E., and Rambo, A. R. (2009). Data warehouse y data mining aplicados al estudio del rendimiento académico y de perfiles de alumnos. In XII Workshop de Investigadores en Ciencias de la Computación – CACIC 2010, pages 162–166.
2. Luo, Q. (2008). Advancing knowledge discovery and data mining. In Knowledge Discovery and Data Mining, 2008. WKDD 2008. First International Workshop on. 3. Alcover, R., Benlloch, J., Blesa, P., Calduch, M. A., Celma, M., Ferri, C., Hernández Orallo, J., Iniesta, L.,Más, J., Ramírez Quintana, M. J., Robles, A., Valiente, J. M., Vicent, M. J., and Zúnica, L. R. (2007). Análisis del rendimiento académico en los estudios de informática de la universidad politécnica de valencia aplicando técnicas de minería de datos. Technical report, Universidad Politécnica de Valencia.
4. La Red Martínez, D. L., Acosta, J. C., Cutro, L. A., Uribe, V. E., and Rambo, A. R. (2009). Data warehouse y data mining aplicados al estudio del rendimiento académico y de perfiles de alumnos. In XII Workshop de Investigadores en Ciencias de la Computación – CACIC 2010, pages 162–166.
5. Luo, Q. (2008). Advancing knowledge discovery and data mining. In Knowledge Discovery and Data Mining, 2008. WKDD 2008. First International Workshop on. 6. Alcover, R., Benlloch, J., Blesa, P., Calduch, M. A., Celma, M., Ferri, C., Hernández Orallo, J., Iniesta, L.,Más, J., Ramírez Quintana, M. J., Robles, A., Valiente, J. M., Vicent, M. J., and Zúnica, L. R. (2007). Análisis del rendimiento académico en los estudios de informática de la universidad politécnica de valencia aplicando técnicas de minería de datos. Technical report, Universidad Politécnica de Valencia.
7. Valero, S. and Salvador, A. (2009). Predicción de la deserción escolar usando técnicas de minería de datos. In Simposio Internacional en Sistemas Telemáticos y Organizaciones Inteligentes SITOI 2009, pages 332–340.
8. Rodallegas, E., Torres, A., Gaona, B., Gastelloú, E., Lezama, R., and Valero, S. (2010). Modelo predictivo para la determinación de causas de reprobación mediante minería de datos. In II Conferencia Conjunta Iberoamericana sobre Tecnologías para el aprendizaje – CcITA 2010, pages 48–55.
9. Valero, S., Salvador, A., and García, M. (2010). Minería de datos: predicción de la deserción escolar mediante el algoritmo de árboles de decisión y el algoritmo de los k vecinos más cercanos. In II Conferencia Conjunta Iberoamericana sobre Tecnologías para el aprendizaje – CcITA 2010, pages 33–39.
10.Wang, J., Lu, Z., Wu, W., and Li, Y. (2012). The application of data mining technology based on teaching information. In Computer Science Education (ICCSE), 2012 7th International Conference on, pages 652 –657.
Technology - New Generations, ITNG ’12, pages 783–789, Washington, DC, USA. IEEE Computer Society.
12.Hernández Orallo, J., Ramírez Quintana, M., and Ferri Ramírez, C. (2004). Introducción a la Minería de Datos. Ed. Pearson.
13.Witten, I. H. and Frank, E. (2011). Data Mining: Practical Machine Learning.Tools and Techniques. The Morgan Kaufmann Series in Data Management Systems. Morgan Kaufmann Publishers, San Francisco, CA, 3th edition.
14.Kohavi, R. and John, G. H. (1997). Wrappers for feature subset selection. Artif. Intell., 97(1-2):273–324.
15.Goldberg, D. E. (1989). Genetic Algorithms in Search, Optimization and Machine Learning. Addison-Wesley Longman Publishing Co., Inc., Boston, MA, USA, 1st ed.
16.Hall, M. A. (1999). Correlation-based Feature Selection for Machine Learning. PhD thesis, University of Waikato, Hamilton, New Zealand.
17.Quinlan, R. (1993). C4.5: Programs for Machine Learning. Morgan Kaufmann Publishers, San Mateo, CA.
18.Sanchez, Roberto Ruiz. Heurísticas de selección de atributos para datos de gran dimensionalidad. Doctoral Thesis, University of Seville.
![forthecollaborationbetweenthesesmartsystems,wheredifferentstakeholderswillexploitthe SustainableCitiesandSmartGrids,whereitispossibletodeployubiquitoussensornetworksfor sustainability,andcityplanning[ ].ThegrowingbodyofknowledgeregardingICTallowsustopropo](data:image/gif;base64,R0lGODlhAQABAIAAAP///wAAACH5BAEAAAAALAAAAAABAAEAAAICRAEAOw==)