An analysis of two-phase flows in conditions relevant to microgravity
Texto completo
Figure


Documento similar
THE EFFECT OF AIR–LUBRICATION ON SHIP FRICTION RESISTANCE 32 scale ship to predict the distribution of the air bubble void fraction on the hull surface, which
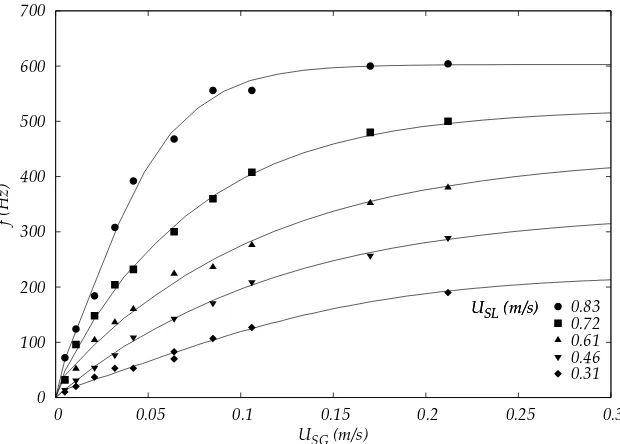
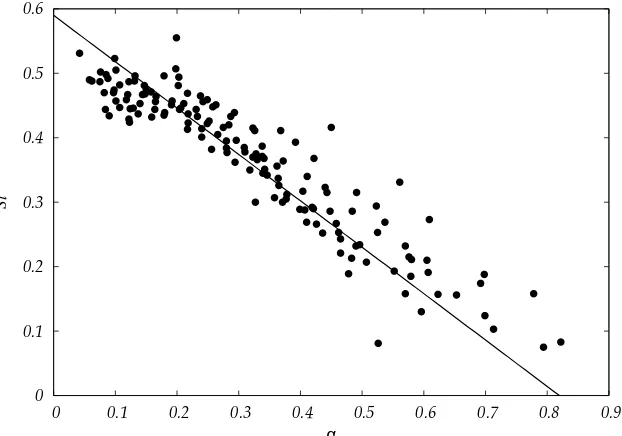
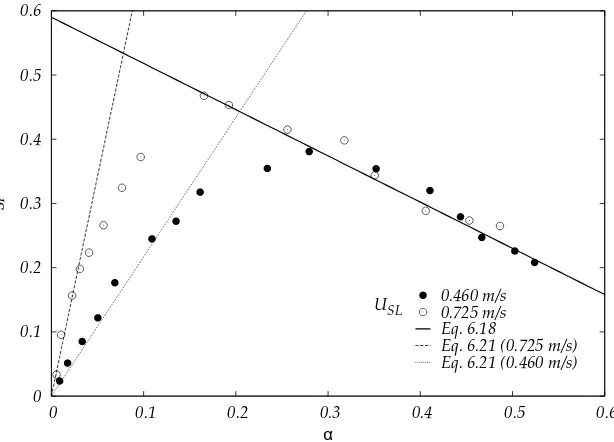
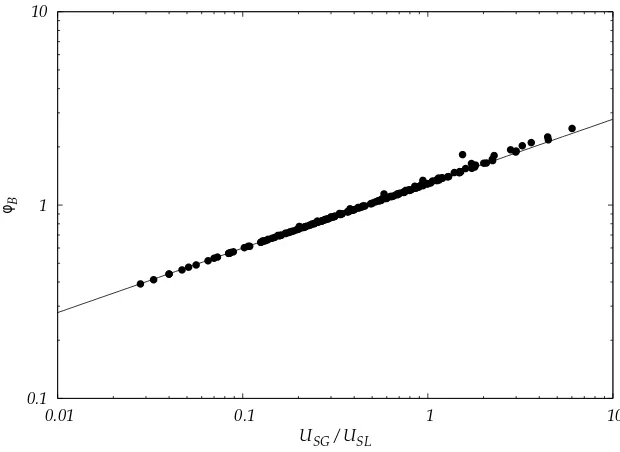
Void fraction rates, free surface undulation pattern, phase-change detection frequency, mean velocities near the bot- tom, and Sauter mean bubble diameter have been analyzed in
The recent financial crisis, with its origins in the collapse of the sub-prime mortgage boom and house price bubble in the USA, is a shown to have been a striking example
The expansionary monetary policy measures have had a negative impact on net interest margins both via the reduction in interest rates and –less powerfully- the flattening of the
Figure 3.21 Formation of the shock at the center of the bubble 59 Figure 3.22 Bubble implosion. Appearance of the RT instabilities. b) Element A and its neighbors B and C 68 Figure
Small differ- ences between the mean pore size measured by both methods are expected since in the bubble point method the mean pore diameter corresponds to a flow of a value of half
A naive expectation would have been that the pinch-off of a bubble in water is governed by the same scaling laws as the "inverse" case of a drop of water pinching off in
We simulate the spectrum versus the bubble radius for the four semiconducting group VI TMDs, MoS 2 , WSe 2 , WS 2 and MoSe 2 , and find an overall Fock-Darwin spectrum of bubble
