AN ESTIMATION OF THE PATTERN OF DIFFUSION OF
MOBILE PHONES: THE CASE OF COLOMBIA
Luis Fernando Gamboa Jesús Otero
SERIE DO C UM ENTO S DE TRA BA JO
No . 5 5
An estimation of the pattern of di¤usion of
mobile phones: The case of Colombia
Luis Fernando Gamboa
yFacultad de Economía
Universidad del Rosario
Bogotá, Colombia
Jesús Otero
zFacultad de Economía
Universidad del Rosario
Bogotá, Colombia
November 2008
Abstract
In this paper we …nd that the di¤usion pattern of mobile telephony in Colombia can be best characterised as following a Logistic curve. Although in recent years the rate of growth of mobile phone subscribers has started to slow down, we …nd evidence that there is still room for further expansion as the saturation level is expected to be reached in …ve years time. The estimated saturation level is consistent with some individuals possessing more than one mobile device.
JEL Classi…cation: C53; L96; O30.
Keywords: Technology di¤usion; Mobile telecommunications; Gompertz curve; Logistic curve; Colombia.
We would like to thank Luis Eduardo Fajardo, Luis Hernando Gutiérrez, Ana María Iregui and Andrés Zambrano for useful comments and suggestions on an earlier version of the paper. The usual disclaimer applies.
1
Introduction
In a little over a decade, the mobile telephony industry has exhibited an impressive
growth throughout the world, with developed (or high-income) countries expanding not as rapidly as less developed (or non-high-income) countries. Banerjee and Ros
(2004), for example, indicate that between 1995 and 2001 mobile subscribers grew
at much lower (compound annual growth) rates in regions of the world such as
Canada / USA (25.1%), Japan / South Korea / Hong Kong / Singapore (40.8%)
and OECD European countries (53.3%), than in Rest of Americas (67.4%), Rest
of Asia (72.5%) and Africa (84.7%). These di¤erential growth rates re‡ect the fact
that developing countries adopted mobile telephony later, and so bene…ted from the
experiences of developed countries which had adopted the new technology earlier.
According to Banerjee and Ros (2004), the markedly di¤erent growth path observed across countries has been driven either by economic or technological substitution.
That is, in countries where both …xed (or wireline) and mobile network services are
of acceptable quality, prices appear to provide the signalling mechanism that guides
substitution. By contrast, in countries where access to …xed telephony has been
limited or the service is of poor quality, consumers have found in mobile services a
good substitute for …xed network services regardless of the relatively high price of
the former.1
There are several studies concerning the growth pattern of mobile telephony
markets, and most of them are linked to the di¤usion theory. Illustrative examples of country-case studies are Barros and Caddima (2000), Botelho and Costa Pinto
(2004) and Carvalho (2006) for Portugal; Michalakelis, Voroutas, and Sphicopoulos
(2008) for Greece; Singh (2008) for India; Doganoglu and Grzybowski (2007) for
Germany. Examples of comparative studies for several countries are Jang, Dai, and
Sung (2005) for OECD countries and Taiwan; and Gruber and Verboven (2001) for
the 15 members states of the European Union. Massini (2004) distinguishes between
1It is also worth mentioning that mobile telephony devices can now be used for many purposes
short-run and long-run e¤ects in the di¤usion process of mobile phones in Italy and
the United Kingdom and …nds that handset prices, tari¤s and consumption
expen-ditures a¤ect di¤usion speed and saturation levels, while Grajek and Kretschmer
(2008) examine the dynamics of usage intensity in 41 countries using quarterly data
over a period of 6 years. A salient common feature of these studies is that the sam-ple size available for estimation purposes is small; in most cases it is lower than 20
(quarterly or yearly) observations. This, of course, is explained by the fact that the
mobile telecommunications sector is a recent technological development.
The studies cited above typically examine the penetration of mobile phones by
means of the estimation of S-shaped growth curves, such as the Logistic and the
Gompertz curves, and present estimates of the speed of di¤usion and saturation
level (or maximum size) of the market. The usefulness of S-shaped curves relies
on the fact that they depict the life cycle of a new product entering a market:
growth starts o¤ slowly, then accelerates, and …nally slows down again until the
saturation level is reached.2 To rationalise the derivation of the Logistic curve one
must postulate a di¤erential equation where the relative growth rate of a product
decreases monotonically with time, while in the case of the Gompertz curve the
relative growth rate decreases in an exponential fashion; see Winsor (1932) and the
references therein.
The purpose of this paper is to complement the body of literature that examines
the pattern of di¤usion of mobile telecommunications, by considering the case of
a Latin American country such as Colombia. We believe that the study of the
Colombian case is interesting for several reasons: First, Colombia is a country where mobile telephony has complemented …xed telephony due to technological rather than
economic reasons. Indeed, the country’s diverse geography has historically limited
the coverage and access of the …xed telephony network, especially in rural and remote
areas of the country. Moreover, in urban areas quality of service in …xed telephony
was mixed, and waiting times for new phone lines were long. Second, some private
leasing contracts became an obstacle for the di¤usion of …xed telephony, because
in many cases it was strictly forbidden for tenants to install phone lines in the
properties they leased, in order to prevent them from leaving unpaid telephone
bills when moving to another property. Last, but not least, Colombia witnessed
the emergence of informal street markets where some individuals resell minutes in mobile phones which, along with the large share of subscribers in the prepayment
category, may help explain the low usage of mobile devices in comparison to other
Latin American countries.3
Following the introduction of mobile telephony in Colombia during the second
half of 1994, and like in many other developing countries, the sector experienced an
initial phenomenal expansion with annual growth rates of more than 100%.
Nowa-days, approximately 86% of the subscribers are in prepayment, an attractive
pay-ment method for individuals who are neither interested nor …nancially eligible to
acquire a …xed price plan. Despite the phenomenal initial growth rates, during the last couple of years or so the annual growth rates of mobile subscribers have started
to slow down to around 15%. Thus, one may be tempted to conclude that the mobile
telephony sector in Colombia will soon reach its saturation level. However, this is
a question that can only be answered by estimating an S-shaped growth curve for
the number of mobile phone subscribers, and providing out-of-sample forecasts with
their associated measures of forecast uncertainty. The analysis of mobile telephony
di¤usion has not been a topic of extensive research neither for Colombia, nor for any
other Latin American country. A recent exception is Mariscal (2007), who analyses
the pattern of expansion that the mobile telephony sector has experienced in Mex-ico in the context of the Latin American region; the estimation of S-shaped growth
curves is not considered in Mariscal’s paper though.
Our paper di¤ers in two important aspects from existing literature on the
dif-fusion of mobile telephony. First, we apply the testing procedure developed by
Franses (1994b) and Franses (1998) to decide between the two functional forms that
3See Gutiérrez and Gamboa (2008) for a detailed description of the current state of the mobile
are most frequently used in the literature, namely the Gompertz and the Logistic
curves. The related literature cited above does not apply any formal statistical
procedure to select between these two functional forms. Second, we present an
eval-uation of the out-of-sample forecasting performance of the estimated model, which
allows us to predict the estimated time when the saturation level is likely to be reached. The forecasting exercise used here also provides measures of forecast
un-certainty by means of the calculation of forecast intervals, which are in turn based
on the implementation of a parametric bootstrap.
The paper is organised as follows. Section 2 o¤ers an overview of the di¤usion
of the mobile telecommunication sector in Colombia. Section 3 presents a brief
description of the time series models typically used for analysing situations that
arise when a new product is entering a market. Section 4 describes the data and
summarises the main results of the empirical analysis. Section 5 concludes.
2
The di¤usion of mobile phones in Colombia: An
overview
The legal framework of the telecommunications sector in Colombia has been guided
by the Ministry of Communications, a policy making institution created through
Law 923 of 1953. The ministry has been in charge of traditional forms of
commu-nication such as telegraphs, …xed telephony (local and long distance calls), postal
services and, more recently, mobile telephony. In 1994, the Colombian Congress
issued Law 142 which established the guidelines that would rule public utilities (including telecommunications), and created the industry regulator, that in the
par-ticular case of the telecommunications service is known as Comision de Regulación
de Telecomunicaciones (CRT). Before the introduction of Law 142, the structure of
the communications sector in Colombia was characterized by the existence of a long
distance provider (Telecom) as well as local state companies, that enjoyed statutory
monopolies on all aspects of network operation. This structure turned out to be
was poor, and prices were high. During the early 1990s, the country entered the
privatisation trend that had been occurring in other places, and this required the
establishment of a new legal framework to promote competition. This period of time
coincided with the arrival of mobile telephony to the country during the second half
of 1994.4
In December 1991, the Ministry of Communications issued Decree 2824 which
laid the foundations for the operation of the mobile telephony sector in the country.
This Decree established that the sector would operate within a context of
competi-tion between companies in private ownership and companies in public-private
owner-ship, where the latter would result from alliances between Telecom, local telephony
operators and domestic and foreign partners. In 1993, the Colombian Congress,
through Law 37, issued a series of regulations with the purpose of adjudicating
li-censes to operators interested in o¤ering mobile telephony services. This Law divided
the country into three di¤erent regions, namely Atlantic, Eastern and Western. Fur-ther, it ruled that two companies would operate in each region, one of which would
be in public-private ownership (Network A) while the other one could be entirely
in private ownership (Network B). The spectrum was de…ned between 800 and 900
Mhz. under the advanced mobile phone service (AMPS) technology. As a result of
this scheme, Celcaribe (Network A) and Celumovil Costa (Network B) started to
operate in the Atlantic region; Comcel (Network A) and Celumovil (Network B) in
the Eastern region; and Occel (Network A) and Cocelco (Network B) in the Western
region; see e.g. Comision de Regulación de Telecomunicaciones (2002).
Under this market con…guration the number of mobile phone subscribers in-creased from about 250,000 in 1995 to almost 2 million in 1999. Most of the rapid
growth took place in the Eastern region where the city of Bogota, which is not only
the capital of the country but also the most populated city with approximately 6
million inhabitants, is located. The rapid growth can be explained by the existence
of the "Calling Party Pays" system, and the introduction of the modality of
pre-4Other Latin American countries such as Argentina, Chile, Perú and Venezuela RB entered the
payment, among other factors. However, according to Comision de Regulación de
Telecomunicaciones (2002) the level of penetration appeared modest when compared
to other Latin American countries such as Argentina and Chile.
Between 2000 and 2003, a series of acquisitions took place in the market. First,
Comcel gained control of Occel, and Celumovil gained control of Cocelco. Then, America Movil from Mexico acquired Comcel and Bellsouth from the United States
acquired Celumovil. Comcel is the only mobile operator that has not changed its
commercial name since the introduction of mobile telephony in Colombia. These
acquisitions led to a duopoly with Comcel and Bellsouth as the only operators. At
the end of 2003, following the introduction of the Personal Communication Services
(PCS), a third operator known as Ola entered the market.5 Ola was owned by
two important local telephony companies, namely Empresa de Teléfonos de Bogotá
(ETB) and Empresas Públicas de Medellin (EPM), and Millicom from Luxembourg.
Ola implemented an aggressive strategy of market penetration based on the o¤ering of lower prices, and in 2006 ETB and EPM decided to leave the alliance and sell
their company shares to Millicom, who gained full control of the company and
changed the brandname from Ola to Tigo. Subsequently, Bellsouth was acquired
by the Telefónica group of Spain, which continued operations under the brandname
Movistar.
The market shares of mobile telephony …rms have shown an unstable pattern.
Indeed, from 1995 to the end of 2000 the Her…ndhal-Hirshman Index (HHI) of
mar-ket concentration remains relatively stable at a level of around 0.5, which may be
alternatively interpreted as two …rms with similar market power. In 2001 the in-creased market share of Comcel is re‡ected in an upward movement of the HHI,
that is subsequently reverted in 2004 following the entrance of the third operator.
Once Ola entered the market, prices went down and this attracted many new users.
After a brief period of time some new users moved to another operator, since Ola
5PCS is a wider legal concept than mobile including concepts such as voice, data, and broad
experienced severe network capacity limitations.6 Currently, the mobile
telecommu-nications sector in Colombia is characterised by a dominant operator (Comcel) with
approximately 63% of the subscribers, followed by Movistar with a market share of
22%, and Tigo with the remaining 15%.
Table 1 shows that during the last years the composition of the telecommuni-cations sector in Colombia has witnessed a marked change due to the presence of
mobile telephony. Indeed, while the share of local and long distance calls in the total
sales of the telecommunications sector declined from almost 80% to 33% between
1996 and 2007, the corresponding share of mobile calls in total sales increased from
11% to approximately 41% during the same period. The increased relative
impor-tance of mobile telecommunications can be viewed as a result of the technological
substitution process which we referred to in the previous section, and the emergence
of a subsequent falling price di¤erential with respect to …xed telephony. By the end
of 2003 mobile penetration equated mainlines penetration.
Figures 1a. to 1c. plot the evolution of some sector indicators. Figure 1a.
shows that the average revenue per user (ARPU) has exhibited a downward trend
since the introduction of mobile phones, which appears consistent with the behaviour
observed in other countries; see e.g. Hausman (2002), McCloughan and Lyons (2006)
and Mariscal (2007). Industry regulators argued that a downward trend in ARPU
re‡ects a more competitive market. For example, during the last …ve years business
practices by the two main service providers in Latin America, i.e. Telefónica and
America Movil, have led to lowering prices with the aim of attracting new customers.
Figure 1b. shows that the average number of minutes per user exhibits a U-pattern. The time period during which the indicator increases coincides with the introduction
of prepayment pricing structures, and the appearance of informal street markets
where some individuals resale minutes in mobile phones.7 Figure 1c. graphs the
6The data used to calculate the HHI are not reported here, but are available from the authors
upon request.
7These informal street markets can be thought of as playing the role that public phones used to
evolution of the number of mobile phone subscribers. Between 2004 and 2008Q2 the
number of mobile phone subscribers increased from 10 to 38 million approximately.
It is worth mentioning that during the last couple of years or so the number of
subscribers has started to grow more slowly.
3
Time-series models for market penetration
One of the most frequently used functional forms to characterise situations that
arise when a new product is entering a market is the so called S-curve. Unlike
standard linear, quadratic or polynomial trend models, an S-shaped curve allows
one to model the key feature of a marketing time series: the fact that the series
converges to a maximum level; in other words, the series is bounded both below and above. The idea underlying an S-curve is that penetration into a market is typically
slow at …rst, then follows a period of rapid acceleration through the adoption of
the new product by the majority (also known in the literature as "critical mass",
see e.g. Fildes and Kumar (2002) and Michalakelis, Voroutas, and Sphicopoulos
(2008)), and …nally the growth rate slows down again so that the level of sales of
the new product converges to some saturation level. Early uses of S-curves include
applications in biology (growth of organisms), demography (population growth) and
economics (economic growth); see the references cited in Winsor (1932).
Mathematically, there are many di¤erent equations that can be used to represent an S-shaped curve. Perhaps the two most common equations are the Gompertz
(1825) growth curve, given by
yt = exp [ exp ( t)]; (1)
and the Logistic growth curve, given by
yt=
1 + exp ( t): (2)
In these equations is a positive parameter that indicates the saturation level of
is a linear time trend (t = 1; :::; T). Both the Gompertz and Logistic curves involve
the estimation of three parameters, and range between a lower asymptote of 0 and
an upper asymptote of . For both the Gompertz and logistic curves the point of
in‡ection occurs at time t = log( ), and the corresponding ordinate at the point
of in‡ection is yt = exp in the Gompertz curve, and yt = 2 in the Logistic curve.
The mathematical properties of the Gompertz and Logistic curves are summarised
in Winsor (1932); see also e.g. Franses (1998).
The parameters in equations (1) and (2) must be estimated using non-linear
least squares (NLS), after providing suitably chosen starting values, since the two
curves are non-linear in the parameters of interest. The estimated parameters can
be then used to obtain out-of-sample forecasts of the variable yt, and forecast
in-tervals can be estimated using a parametric bootstrap, as recommended in Franses
(1994a). To implement the bootstrap procedure suppose we have T1 observations
for estimation, and that forecasts are required for T2 periods ahead. Suppose
fur-ther that the estimated regression equation variance is ^2. The bootstrap procedure
involves generating (T1+T2) observations for "t N 0;^2 , and then generating
the bootstrap values of yt, denoted as yt, which in the case of the Gompertz curve
are given by:
yt = ^ exph ^ exp ( ^t)i+"t; (3)
and in the case of the Logistic curve are given by:
yt = ^
1 + ^ exp ( ^t) +"t; (4)
where ^, ^ and ^ are the NLS estimates of , and , respectively. Next, equation
(1), or (2), is re-estimated using the …rst T1 observations of yt, and forecasts are
generated for the remainingT2 observations. The procedure described previously is
repeated B times, obtaining B forecasts for each horizon. Finally, one can
calcu-late the mean of the B forecasts for each horizon and, for example, a 95 per cent
con…dence interval for the forecasts can be obtained by …nding the 2.5 and 97.5
percentiles in the list of B forecasts for each horizon8.
4
Data and empirical analysis
We consider a data set consisting of the number of mobile phone subscribers in
Colombia. It is worth mentioning that the number of subscribers is not the same as the number of mobile telephony users for four main reasons. First, Colombia is
perhaps one of the few countries in the world that is characterised by the operation
of an informal street market where some individuals (who typically own one or two
mobile devices for each service operator) resell minutes. Second, individuals may
posses mobile devices for personal and business purposes, where the latter is paid by
their employer. Third, a common business practice is that when customers intend
to upgrade their mobile devices, service operators assign a new mobile device with
its corresponding subscriber identify module (SIM) card, and o¤er the option of
maintaining the older device in the modality of prepayment. Fourth, operators, in an attempt to increase their market share, have started to o¤er service plans that
involve giving two SIM cards (that is, two di¤erent phone numbers) to new users.
For all these reasons, a subscriber is not an individual but an "account" with a
mobile telephony provider.
The data are quarterly (end-of-period) and runs from 1995Q4 to 2008Q2, for a
total ofT = 51observations. The data were collected from worksheets produced by
the Ministry of Communications of Colombia. As in Franses (1994a), the available
raw observations are smoothed by running a regression of the number of subscribers
at time t on an intercept, the number of subscribers at timet 1, and on the new
subscriptions at time t, and by taking the …tted values of such a regression as the
smoothed series.
The …rst stage of our empirical analysis involves selecting between the two most
often applied functional form speci…cations, namely the Gompertz curve and the
Logistic curve. In order to do this, we follow Franses (1994b) and Franses (1998),
who develops a simple testing procedure to select between the two speci…cations.
The starting point of the test is the fact that the Gompertz curve given in equation
(1) can be rewritten as:
log ( log (yt)) = + t; (5)
where yt is the time series of interest, log denotes the natural logarithm, is the
…rst di¤erence operator, and and are non-linear functions of the parameters
and . In turn, the Logistic curve given in equation (2) can be rewritten as:
log ( log (yt)) = + 1t+ 2t2+ 3t3+ 4t4::: : (6)
Given that equation (5) is nested in equation (6), the testing procedure put
forward by Franses (1998) involves estimating by ordinary least squares the auxiliary
regression (6), and testing the null hypothesis that the estimated coe¢cients 2,
3, 4, ::: are statistically di¤erent from zero. If these coe¢cients turn out to be
statistically di¤erent from zero then a Logistic speci…cation should be estimated;
otherwise, an speci…cation based on the Gompertz curve should be preferred. It is
worth noticing that since in practice values of log (yt) may well be negative, then
it would not be possible to apply the second logarithmic transformation in the
left-hand side of equations (5) and (6). To overcome this, Franses (1994b) suggests that
one might either replace such observations by interpolated values or alternatively
treat them as missing values.
The results of estimating the auxiliary regression (6) for various degrees of the polynomial time trend suggest that the Logistic speci…cation should be used. Indeed,
our results indicate that whent2andt3are included in (6), theF statistic for the the
joint signi…cance of 2 and 3 is 7.736 (p-value 0.001). Similarly, when the auxiliary
regression (6) includes t2, t3 and t4 the corresponding F statistic for the the joint
signi…cance of 2, 3 and 4 is 5.070 (p-value 0.004).9
NLS estimation of the Logistic speci…cation yields the following results, where
Heteroscedasticity and Autocorrelation consistent (HAC) standard errors appear
9As an additional excercise, it was also tried to estimated the Gompertz speci…cation. However,
underneath each estimated coe¢cient in parentheses:
yt=
44:660 (3:037)
1 + 2253:132
(1259:438) exp 0(0::184017)t
; ^ = 1:452
R2 = 0:985 :
The results were obtained using the econometric software RATS 6.0, and
con-vergence was achieved after 9 iterations.10 As can be seen, the estimated coe¢cients
have the expected positive sign and are statistically signi…cant at the 5 per cent
signi…cance level (based on one-tailed tests). The ^ coe¢cient implies an estimated
saturation level of about 44.6 million subscribers. Given that the Colombian
popu-lation is around 43 million inhabitants, the saturation level is consistent with
indi-viduals having more than one mobile device. Singh (2008) observes that developing
countries typically exhibit higher saturation levels than develop ones, due to limited
access to …xed telephony networks. Thus, there is no need for individuals to possess
a …xed line in order to have a mobile phone. Our estimate of the point of in‡ection
is at time t = log(22530:184:132) 42, that is approximately in 2006Q1.
Figure 2 plots the actual values for the number of mobile phone subscribers, the forecasts for 20 quarters ahead (from 2008Q3 onwards), and the 95% con…dence
intervals for the forecasts, as produced by the previous Logistic speci…cation. The
lower and upper critical points of the forecasting interval were calculated applying
the bootstrap approach, usingB = 1;000bootstrap replications. The out-of-sample
point forecasts suggest that the saturation level is almost reached in 2013Q2, that is
in approximately 5 years time. In other words, despite the impressive development
of the mobile communications sector in the country, there still appears to be room
for expansion, at least for the next …ve years. As Gutiérrez and Gamboa (2008)
report, mobile penetration is still low among people in the lower percentiles of the income distribution.
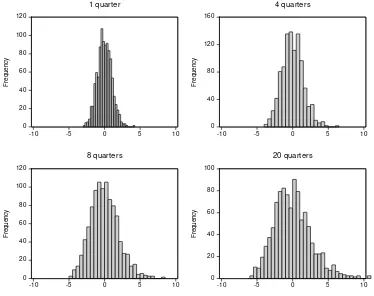
To assess the dependence of forecast uncertainty on the forecast horizon, Figure
3 plots the histograms of the forecast errors at forecast horizons of 1 quarter, 4
quarters, 8 quarters and 20 quarters ahead. As the forecast horizon increases, the
dispersion of the forecast errors becomes larger implying that forecast uncertainty
is time-dependent.
5
Concluding remarks
This paper examines the di¤usion pattern of mobile telephony in Colombia. Our
em-pirical modelling approach starts o¤ by choosing between the two functional forms
that are most frequently used in the literature, namely the Gompertz and the
Logis-tic curves. This involves the use of a formal statisLogis-tical procedure that is available in
the literature. Our …ndings indicate that the di¤usion pattern of mobile telephony
in Colombia can be best characterised as following a Logistic speci…cation. We …nd
evidence that despite the fact that the growth rate of mobile phone subscriptions
has been slowing down in recent years, there is still room for further expansion, as
the saturation level is expected to be reached in …ve years time. The estimated saturation level is consistent with some individuals possessing more than one mobile
References
Banerjee, A. and A. J. Ros (2004). Patterns in global …xed and mobile
telecom-munications development: A cluster analysis. Telecommunications Policy 28,
107–132.
Barros, P. P. and N. Caddima (2000). The impact of mobile phone di¤usion on
the …xed-link network. C.E.P.R. Discussion Paper No. 2598.
Botelho, A. and L. Costa Pinto (2004). The di¤usion of cellular phones in
Portu-gal. Telecommunications Policy 28, 427–437.
Carvalho, A. (2006). Di¤usion of mobile phones in Portugal: Unexpected
suc-cess? Presented at the Innovation Pressure International ProACT Conference
Rethinking Competitiveness, Policy and Society in a Globalised Economy.
Tampere, Finland.
Clements, M. P. (2005). Evaluating Econometric Forecasts of Economic and
Fi-nancial Variables. Houndmills: Palgrave Macmillan.
Comision de Regulación de Telecomunicaciones (2002). El sector de las telecomu-nicaciones en Colombia 1998-2001. Available in www.crt.gov.co.
Doganoglu, T. and L. Grzybowski (2007). Estimating network e¤ects in mobile
telephony in Germany. Information Economics and Policy 19, 65–79.
Fildes, R. and V. Kumar (2002). Telecommunications demand forecasting: A
review. International Journal of Forecasting 18, 489–522.
Franses, P. H. (1994a). Fitting a Gompertz curve. Journal of the Operational
Research Society 45, 109–113.
Franses, P. H. (1994b). A method to select between Gompertz and logistic trend
curves. Technological Forecasting and Social Change 46, 45–49.
Franses, P. H. (1998).Time Series Models for Business and Economic Forecasting.
Gamboa, L. F. and L. H. Gutierrez (2008). Use of informal mobile telephony in low
income households in Colombia. Documentos de Trabajo No.45. Universidad
del Rosario, Colombia.
Geroski, P. A. (1999). Models of technological di¤usion.Research Policy 29, 603–
625.
Gompertz, B. (1825). On the nature of the function expressive of the law of human
mortality, and on a new mode of determining the value of life contingencies.
Philosophical Transactions of the Royal Society of London 115, 513–583.
Grajek, M. and T. Kretschmer (2008). Usage and di¤usion of cellular telephony,
1998-2004. International Journal of Industrial Organization, forthcoming.
Gruber, H. and F. Verboven (2001). The di¤usion of mobile telecommunications
services in the European Union. European Economic Review 45, 577–588.
Gutiérrez, L. H. and L. F. Gamboa (2008). An approximation to the digital divide
among low income people in Colombia, Mexico and Peru: Two composite
indexes. Documentos de Trabajo 39. Facultad de Economia. Universidad del
Rosario (Colombia).
Hausman, J. (2002). Mobile telephone. In M. E. Cave, S. Majumdar, and I.
Vogel-sang (Eds.), Handbook of Telecommunications Economics, pp. 563–604.
Ams-terdam: North Holland.
Jang, S.-L., S.-C. Dai, and S. Sung (2005). The pattern and externality e¤ect of
di¤usion of mobile telecommunications: The case of the OECD and Taiwan.
Information Economics and Policy 17, 133–148.
Mariscal, J. (2007). Mobile communications in Mexico in the Latin American
context.Information Technologies and International Development 3, 41–55.
Massini, S. (2004). The di¤usion of mobile telephony in Italy and UK : An
em-pirical investigation. Economics of Innovation and New technology Vol 13,
McCloughan, P. and S. Lyons (2006). Accounting for ARPU : New evidence from
international panel data. Telecommunications Policy 30, 521–532.
Michalakelis, C., D. Voroutas, and T. Sphicopoulos (2008). Di¤usion models of
mobile telephony in Greece. Telecommunications Policy 32, 234–245.
Rogers, E. M. (2003). Di¤usion of Innovations. New York.: Free Press.
Singh, S. K. (2008). The di¤usion of mobile phones in India.Telecommunications
Policy 32, 642–651.
Winsor, C. (1932). The Gompertz curve as a growth curve. Proceedings of the
Table 1. Structure of the communications sector in Colombia (% total sales)
Item 1996 1998 2000 2002 2004 2006 2007
Local calls 36.1 30.1 39.7 40.0 34.0 27.7 26.3
Long distancey 43.3 28.5 25.3 16.2 11.6 7.4 6.2
Mobile 11.0 26.9 16.9 16.9 22.8 40.0 40.9
Othersz 9.6 14.5 18.1 26.7 31.5 24.9 26.6
y Includes both national and international calls.
z Includes Internet, radio, TV, Trunking, among others.
0 4,000 8,000 12,000 16,000
1996 1998 2000 2002 2004 2006 1a. Average revenue per user
200 300 400 500 600 700 800
1996 1998 2000 2002 2004 2006 1b. Average minutes per user
0 10 20 30 40
[image:20.595.178.417.127.333.2]1996 1998 2000 2002 2004 2006 1c. Mobile phone subscribers
0 10 20 30 40 50
[image:21.595.121.471.143.418.2]96 98 00 02 04 06 08 10 12
0 20 40 60 80 100 120
-10 -5 0 5 10
F re q u e n c y 1 quarter 0 40 80 120 160
-10 -5 0 5 10
F re q u e n c y 4 quarters 0 20 40 60 80 100 120
-10 -5 0 5 10
F re q u e n c y 8 quarters 0 20 40 60 80 100
-10 -5 0 5 10
[image:22.595.113.487.135.431.2]F re q u e n c y 20 quarters