SERIE DO C UMENTO S DE TRABAJO
No . 40 (ve rsió n c o rre g ida )
Ene ro 2009
FERTILITY AND SCHOOLING: HOW THIS RELATIONSHIP
CHANGED BETWEEN 1995 AND 2005 IN COLOMBIA
Nohora Forero
Fertility and Schooling: How this relation changed
between 1995 and 2005 in Colombia
Nohora Forero Ramírez*.
nyforero@urosario.edu.co
Universidad del Rosario Bogotá - Colombia
Luis Fernando Gamboa**
lfgamboa@urosario.edu.co
Universidad del Rosario Bogotá - Colombia
Abstract
We test the existence of changes in the relationship between fertility and schooling in Colombia for women from 30 to 40 years old between 1995 and 2005. For our purpose, we use Poisson Regression Models. Our database is the Demographic and Health Survey from 1995 and 2005. We find a reduction in the fertility during this period and an increase in the educative level of the population. According to our results the total number of children a woman has, keeps an inverse relationship with her educative level, which may be explained by the effects of education on the knowledge of birth control methods. We also find that the effect of having finished an educative level in 2005 is higher than in 1995. Besides, we also find that there are significant rural-urban differences in the determinants on fertility for Colombia’s women in the last decade.
Resumen
En este trabajo se pretende evaluar la existencia de cambios en la relación entre fecundidad y escolaridad en Colombia para mujeres de 30 a 40 años de edad entre 1995 y 2005. Para tal efecto se utilizan modelos de Poisson sobre la Encuesta Nacional de Demografía y Salud 1995 y 2005. Se encuentra una reducción en la fecundidad durante el periodo y su relación inversa con la escolaridad, que puede ser explicada por el efecto de la educación sobre otras variables como el incremento en el conocimiento sobre los programas de control natal. Se encuentra además que el efecto de culminar un nivel educativo sobre la fecundidad es mayor en 2005 que en 1995. De otro lado, se encuentra que las diferencias entre zonas urbanas y rurales son significativas en la explicación de la fecundidad en Colombia durante la última década.
Keywords: Fertility, Schooling, Colombia, Poisson Regression Model, Protogenetic Interval.
JEL: I22, J13, C25
* Researcher Assistant, Economics Department, Rosario University.
** Professor, Economics Department, Rosario University. Correspondence: Luis Fernando Gamboa. Calle 14
1. Introduction
During the last past decades there have been several efforts to understand
the link between fertility and schooling. It is widely accepted and frequently
observed the negative correlation across households between parent's education and
completed fertility in the empirical literature on human fertility behaviour. Some
authors as Sander (1992), study the effect of women’s schooling on fertility and
analyzes the possibility of treating women’s schooling as an exogenous determinant
of fertility in the United States. As Sander cites, some of the explanations for this
effect are: first, women’s schooling increasing the value of time in market work for
opportunity cost of allocating time to child rearing; second, women’s schooling
increases the effects of the public programs of contraception and, finally, its
influence on the preferences for children (See Becker, 1991; Michael, 1973; Cleland
and Wilson, 1987 and Easterlin, 1989 for details). More recently, many empirical
works show that fertility has decreased and schooling goes in the inverse direction.
Shultz (1997) shows that in low income countries as Latin American, the total
fertility rate varied from 5.87 to 2.81 between 1950 and 2000. During the same time,
infant mortality changed from 126 to 37 in the region. Nevertheless, this is similar in
different countries around the world.
In developed countries, according to United Nations (2001), fertility is below
replacement level. In fact, “for the more developed regions as a whole, total fertility
is expected to decline from 1.57 children per woman in 1995-2000 to 1.5 children
per woman in 2005-2010 (...) and to rise to 1.92 in 2045-2050”. In the case of less
developed regions, we observe high levels of heterogeneity in fertility rates.
According to United Nations (2001) less developed regions include extreme cases
such as China (with low fertility rates) and countries like Niger or Afghanistan, with
higher fertility rates. On average, fertility rates in less developed regions are above
replacement levels (3.1 children per woman in 1995-2000) and are expected to fall to
2.17 children per woman for the period 2045-2050. Finally, the total fertility rate for
the 48 least developed countries in 1995-2000 is 5.74 children per woman and this
In summary, these data may suggest a negative relationship between fertility
rates and level of income among different countries and a general reduction in
fertility rates for countries with different levels of development. There are different
channels in which fertility and schooling are related. Some of them are not direct
but through other variables. Cochrane (1979) says fertility is determined by the
biological supply of children, by the demand for children in marriage and by the
regulation of fertility. The effect of education on fertility could be ambiguous. On
the one hand, more education is associated to a higher probability of conceiving due
to better health in women. But, on the other hand, increases in education require
spend more time studying which reduces the years of exposure to pregnancy and it
also could explain marriages at older ages.
From the demand of children’s point of view, another way education and
fertility could be related is by means of productivity and income. According to the
human capital theory, more education is associated with more productivity and
income. This increasing in productivity, as Hicks and Martinez (1985) affirm,
enhances the cost in time needed to bring children up and reduces the desired
quantity of children. In this sense, education decreases the desired family size
because of the perceived benefits and cost of children. From this perspective,
opportunity cost for women with high education levels is higher than the cost for
women with no education. Besides, education also lets people to regulate fertility by
means of the knowledge of contraception methods and it can also reduce
unexpected pregnancy events.
Nevertheless, the education could also have a positive effect on the demand
of children: Hicks and Martinez (1985) suggest that since higher levels of education
achieved are related to better levels of income, and taking into account that children
are normal goods, the effect of education could be an increase on the number of
children. Although both effects act in the opposite direction, we could reasonably
expect the total effect to be negative which is the fact literature has widely
documented.
As it can be seen, all these effects come from the fact that education is a
process in which the people get literacy, skills, productivity, socialization and higher
people and their preferences. Then, there are many ways in which politicians can
alter fertility rates in the population.
There are several empirical works on the relationship between fertility and
schooling as Cochrane (1979), Ainsworth et al. (1996), Shultz (1998), Okonkwo and
Terry (2008), Handa (2000), and Josipovic (2007) among others. For some
sub-Saharan countries, Ainsworth et al. (1996) find that one additional year of education
generates a reduction of 0.06 to 0.13 in the number of children per woman. In a
similar way, Schultz (1998) estimates the reduction in around 13% (0.5 children per
woman) using a cross-country panel data. For Nigeria, Okonkwo and Terry (2008)
estimate that the impact of one additional year of women’s education on fertility is a
reduction of approximately 11 to 19% for women under 25.
Handa (2000), finds that not only education but also income has a negative
influence on fertility in Jamaica. In fact, the estimations for income and education
birth elasticities are -0.15 and -0.45 which show a higher impact of education on
women’s fertility rates. In this case the evidence does not support the idea of Hicks
and Martinez (1985) who state that we could expect children to be normal goods.
Besides, the impact of education seems to operate through the increase in the value
of time, instead of its effect on preferences. For some Arab countries, Al-Qudsi
(2000) finds that income and education birth elasticities are 0.03 and -0.06 which
would indicate that for the sample used, children are normal goods and that the
effect on education remains negative and higher in magnitude, as other studies have
documented. Josipovic (2007) also finds a negative relationship between education
and fertility for the case of Slovenia, although according to his findings fertility rates
in this country are still in high levels for some groups of people with high levels of
education. This work explains another mechanism through which education relates
to fertility: the protogenetic interval (PGI) or the age of women at the time of the
first childbirth. We could expect that higher educative levels delay the PGI and
hence, we could expect women to have fewer children.
In the Latin-American context, Florez and Soto (2007) describe fertility
patterns among high (Haití and Guatemala) medium (Bolivia and Dominic
Republic) and low fertility (Perú and Colombia) countries. They find a higher
meanwhile in countries such as Bolivia they note a raise in educative differentials.
As a result, they conclude that contraceptive programs have been relatively
successful in these countries.
From the economic approach, fertility choice is based on several models.
From the microeconomic perspective we find a time budget constraint that
endogenize the allocation of time between market labour supply and nonmarket,
because for women some of their labour market activities cannot be readily
combined with child care and do not generate income as others do. From the
human capital point of view, demographic and economic behaviour depends on the
household stocks of human and physical capital. In this sense, past investments are
focused in seeking a better standard of living. Finally, labour market training,
marriage and children, are immerse in the life-cycle which are different between men
and women. After pregnancy periods women gain a licence that let them to care of
children, but it is not the case of men (although in Colombia the ‘Ley María’ lets the
father to take off 5 working days).
In this document we want to study how much the relationship between
fertility and education has changed in Colombia from 1995 to 2005 for women from
30 to 40 years old by means of count data models. We choose this age range,
because it is common among women to have finished studies previous to 30 years
old. We think our work is important for two reasons. First, it is an application for a
developing country where exists a very specific socioeconomic situation: in the
middle of the period analyzed (1999), a deep economic recession took place,
although there have been important advances in education enrollment rates. Indeed,
in the case of primary and secondary education this indicator has increased from
79% in 2001 to 88% in 2005. For higher education this indicator increased from
14.9% in 1995 to 24.6% in 2005. Besides, Colombia has serious problems of
violence, poverty and income concentration.
Second, there are no other works that assess changes in the relationship
between fertility and schooling in Colombia and it is important to know population
dynamics related to fertility and its determinants, since it is a key factor explaining
population growth in the long run and, hence, the evolution of population at age of
For our purpose, we use count data models especially designed for the study
discrete and positive variables. This kind of models (Poisson Regression Models
and Negative Binomial Models) let us to analyze cases where the dependent variable
is discrete and it takes few values. The document is divided as follows: the next
section shows the socioeconomic situation of the country and some summary
descriptive statistics and then, in the third section we explain our methodology and
in the fourth we show our findings. Finally, we present some conclusions.
2. Background
At the beginning of the XX century, Colombia had about 5 million of
inhabitants and 90 percent lived in rural areas. Today, Colombia is a country with a
population of 45 million people in 2005 in which most of the 90 percent of the
population live in less than the five percent of its territory. The population’s growth
rate before the sixties was above the 3 percent per year and since then, there has
been a decrease in that rate. During most of the XX century Colombia there was a
centralistic political system but the regional development generated different
conditions into the regions. The geographic conditions have splitted the country
into regions as: Atlantic, Pacific, Central, Western and Bogotá. These regions have
different cultural, economic, and topographic conditions, among others. While
Atlantic region is characterized by being a plain territory in front of the Caribbean
Sea, Central region is very mountainous where are located the two biggest and most
populated cities of the country (Bogotá and Medellín). However for statistical
reasons and for its own conditions, Bogotá is analyzed as a particular region.
The geographic distribution of the population has been influenced for many
reasons. One of them is the result of the economic activity. Colombia had in the
production of coffee one of the most important source of its income. As a result,
most of the people lived near to the production of this good1. Other possible
explanation emerges from the political disorders from the end of the forties. In the
same line, Colombia witnessed a demographic transition from rural to urban areas:
while in 1951 30% of the population lived in the cities, that value has reached a level
1
of approximately 70% in recent years. Some facts are influencing these migrations:
economic progress, the absence of services as health and education in small towns,
public health contraception programs and, in the last two decades, the increase in
the violence conditions in the rural areas.
From a demographic point of view, Colombia has a continuous decrease in
the fertility rate, but most of this reduction was at the end of the sixties and the
seventies. During this period, fertility rates varied considerably. It could be a
consequence of several facts such as urbanization process, the reduction in illiteracy
rates and the creation of programs specially designed for natal purposes. Some
findings from Elkins (1973) show that differences in fertility were notorious among
groups from distinct educative levels. Between 1960 and 1964, the population with
high education had a fertility rate of 6.2, two children less than women with a basic
or no education (8.27). At the end of sixties, that difference increased because of the
higher reduction in the urban fertility in comparison with the rural situation. As a
consequence, after this decade fertility rate decreased continuously. Some
governmental programs in posterior years (1970-1974, 1974-1978, 1978-1982,
1982-1986) included aspects that affected demographic variables such as the extension of
the familiar contraception programs and the reduction in the child morbidity and
mortality.
Population differences among these regions are notorious. Wills (1976)
describes regional differences in fertility and she found that socioeconomic
conditions in households are very distinct among regions and she also argues that
the ideal family size is affected by feeding and living costs and the marginal benefit
of the infant work, especially in rural areas. Most of the reduction was in the Central
region, and others as Atlantic have a number of children above the national average.
Besides fertility differences, we also found differentials related to levels of education
among women: from the Demographic survey it was found that in 1976 21% of
Atlantic’s women did not have education versus 6.8% in Bogotá. In 2005, these
values are 4.8% and 1.3% respectively.
Some calculations made in 1986 show that during this period there were a
differential of two children between women from urban and rural areas. It also
especially in women with higher education and then, other women groups followed
this trend.
Low income teenagers start sexual relations and have children before their
counterparts in the top of the income distribution. Total fertility changed from 3.2
to 1.65 between 1986 and 2005 in Colombia. Most of this change is a consequence
of the considerable reduction in the fertility among high income people.
Various demographic surveys tell us that in less than three decades, people in
urban areas increased in more than 10% and that there are no differences by gender.
It is also found a reduction in the proportion of women in the 15-24 age range
between 1976 and 2005. This is an expected result taking into account the reduction
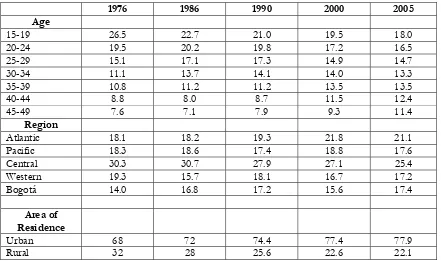
in fertility rates in previous years (see Table 1).
[image:9.595.79.520.352.613.2]
Table 1. Distribution of Women in Colombia, 1976-2005
1976 1986 1990 2000 2005 Age
15-19 26.5 22.7 21.0 19.5 18.0
20-24 19.5 20.2 19.8 17.2 16.5
25-29 15.1 17.1 17.3 14.9 14.7
30-34 11.1 13.7 14.1 14.0 13.3
35-39 10.8 11.2 11.2 13.5 13.5
40-44 8.8 8.0 8.7 11.5 12.4
45-49 7.6 7.1 7.9 9.3 11.4
Region
Atlantic 18.1 18.2 19.3 21.8 21.1
Pacific 18.3 18.6 17.4 18.8 17.6
Central 30.3 30.7 27.9 27.1 25.4
Western 19.3 15.7 18.1 16.7 17.2
Bogotá 14.0 16.8 17.2 15.6 17.4
Area of Residence
Urban 68 72 74.4 77.4 77.9
Rural 32 28 25.6 22.6 22.1
Source. DHS Macro International. Various years.
Since 1970, there has been a slow reduction in poverty (incidence and
severity), but the concentration of income is still at undesirable levels. The lowest
20% of the people only has a share of 3% of income. At the same time, local majors
have focused their efforts in education and health provision and it has increased
In the middle of the nineties Colombia had some economic problems as high
inflation rate, a decreasing in the growth rate, among others. But the increase in the
forced migration as a consequence of the pressing of the subversive armed groups is
one of the most important characteristic of Colombian history in the last twelve
years. This situation has its own effects on the fertility choice in women. Camacho
(2007) estimates the impact of terrorist attacks in Colombia on the health of babies
that were born between 1998 and 2003. The results suggest that these types of
violence have a negative and significant impact on child health (i.e. on birth weight
and preterm deliveries).
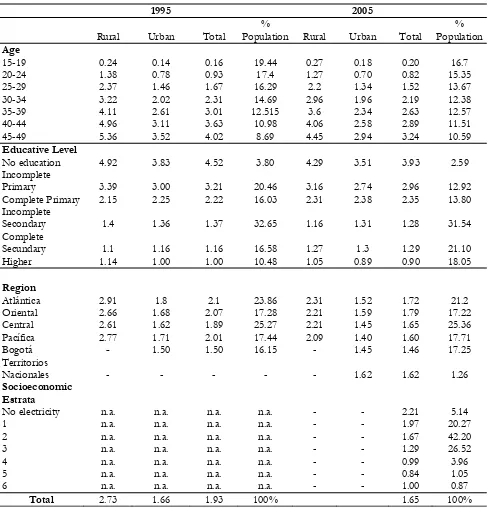
Nevertheless, the reduction in fertility rates can be observed even for shorter
periods, as the one we are interested to focus on. Between 1995 and 2005 we can
also affirm that the number of children per women in Colombia has decreased
(Table 2). As it can be seen, both in 1995 and 2005, women in rural areas have more
children than urban but the difference between those is still important. Note that
women above 40 years have more than 5 children on average. If we take jointly
schooling and place of residence, the differences among people from rural to urban
areas with no education are higher than people with high education. From the
regional point of view, Atlantic and Central are the regions with the highest number
of children during this decade, and this number is higher in urban areas.
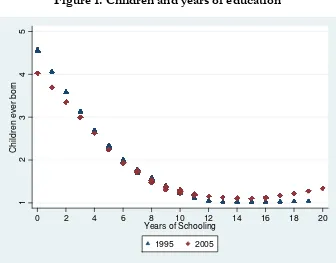
When we take into account the relationship between the number of children
and schooling, the results are very interesting. Moreover, as Figure 1 shows for the
Colombian case, on average there is an inverse relationship between years of
schooling and the number of children a woman has. The figure shows that the
relationship is monotonic for 1995, but it is not the case for 2005. In this last case,
the relationship is negative until 16 years of education and after this level, the
relationship changes. One possible reason can be found in the opportunity cost of
education and the increase in the available services for child care that let the women
to work and study. Although in both years there is evidence that let us affirm that
the more educated a woman is, fewer children she has, in 2005 we observe that this
is true up to 16 years of schooling. Specifically in 2005, the fact of having achieved
more than 16 years of education has a positive relationship with the presence of
higher educative levels decide to postpone having children, so their PGI starts later
in comparison to women with less education achievement. In this sense, once a
woman has reached a specific educative level, she decides to have children. As a
consequence of the delay in the decision of becoming a mother, we could expect
those women to have a lower total fertility rate (i.e. the total number of children at
[image:11.595.55.543.227.735.2]the end of the fertile age).
Table 2. Mean of children ever born
1995 2005
Rural Urban Total
%
Population Rural Urban Total
% Population Age
15-19 0.24 0.14 0.16 19.44 0.27 0.18 0.20 16.7
20-24 1.38 0.78 0.93 17.4 1.27 0.70 0.82 15.35
25-29 2.37 1.46 1.67 16.29 2.2 1.34 1.52 13.67
30-34 3.22 2.02 2.31 14.69 2.96 1.96 2.19 12.38
35-39 4.11 2.61 3.01 12.515 3.6 2.34 2.63 12.57
40-44 4.96 3.11 3.63 10.98 4.06 2.58 2.89 11.51
45-49 5.36 3.52 4.02 8.69 4.45 2.94 3.24 10.59
Educative Level
No education 4.92 3.83 4.52 3.80 4.29 3.51 3.93 2.59
Incomplete
Primary 3.39 3.00 3.21 20.46 3.16 2.74 2.96 12.92
Complete Primary 2.15 2.25 2.22 16.03 2.31 2.38 2.35 13.80
Incomplete
Secondary 1.4 1.36 1.37 32.65 1.16 1.31 1.28 31.54
Complete
Secundary 1.1 1.16 1.16 16.58 1.27 1.3 1.29 21.10
Higher 1.14 1.00 1.00 10.48 1.05 0.89 0.90 18.05
Region
Atlántica 2.91 1.8 2.1 23.86 2.31 1.52 1.72 21.2
Oriental 2.66 1.68 2.07 17.28 2.21 1.59 1.79 17.22
Central 2.61 1.62 1.89 25.27 2.21 1.45 1.65 25.36
Pacífica 2.77 1.71 2.01 17.44 2.09 1.40 1.60 17.71
Bogotá - 1.50 1.50 16.15 - 1.45 1.46 17.25
Territorios
- - - 1.62 1.62 1.26
Nacionales Socioeconomic Estrata
No electricity n.a. n.a. n.a. n.a. - - 2.21 5.14
1 n.a. n.a. n.a. n.a. - - 1.97 20.27
2 n.a. n.a. n.a. n.a. - - 1.67 42.20
3 n.a. n.a. n.a. n.a. - - 1.29 26.52
4 n.a. n.a. n.a. n.a. - - 0.99 3.96
5 n.a. n.a. n.a. n.a. - - 0.84 1.05
6 n.a. n.a. n.a. n.a. - - 1.00 0.87
Total 2.73 1.66 1.93 100% 1.65 100%
Figure 1. Children and years of education
1
2
3
4
5
C
hi
ld
ren
e
v
er
bo
rn
0 2 4 6 8 10 12 14 16 18 20
Years of Schooling
1995 2005
Source : DHS- Macro International.
3. The model
As we mentioned above, our purpose is assessing the existence of changes in
the relationship between fertility and schooling during a period of ten years (1995 –
2005) in women from 30 to 40 years old. We choose this age range because we are
interested in women that just finished their schooling. Our data comes from the
Demographic and Health Survey (DHS) carry out by Profamilia for the case of
Colombia. DHS includes information about socioeconomic status, fertility and
migration choices, anthropometry and food habits, among other characteristics.
This survey is available for years 1995, 2000 and 2005, but we only analyze two of
them in order to capture demographic and schooling changes over a decade.
Our dependent variable is the number of children ever born. We use Poisson
few values. Linear models as Ordinary Least squares (OLS) have shortcomings from
those estimators in which we get negative values. PRM assumes that mean and
variance are the same, as the Poisson distribution function. As the mean (variance)
increases, the probability of zero count decreases. Then it is possible there are more
zeros than those predicted by the Poisson distribution. PRM has problems in the
presence of overdispersion. Despite of the existence of other methodologies, PRM
has some virtues as attribute a positive probability to the outcome ‘zero’, it allows
inferences on particular outcomes and it also accounts for the heterokedasticity and
skewed distributions associated with non-negative variables. For more details of this
methodology see Cameron and Trivedi (2005) and Winkelman (2008).
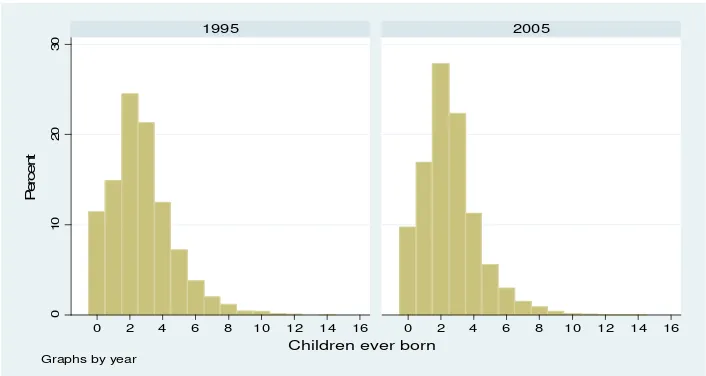
The distribution of the dependent variable for each year is shown in Figure 2.
During this decade, the proportion of women with two and three children increased
as a consequence of a reduction in women with no children and women with more
than three. This effect is more notorious if we only take into account children that
were born during this period.
From the survey, we exclude those cases in which women has two or more
children at the same time (twins, non-identical twins and so on). As explanatory
variables we include schooling, gender, age, area of residence and a proxy of wealth.
Our schooling variable is included in two ways: as a categorical variable that tells us
the level of education, and a discrete variable of years of schooling. Table 3
summarizes and defines our variables. Some of them are included for controlling
additional effects. Although we could expect some other variables to determine
fertility levels, the source of data used does not include them. For instance, religion
is a factor widely used in fertility literature to explain the number of children a
woman has (Hicks and Martinez, 1988; Al-Qudsi, 1998). Nevertheless, the
Figure 2. Distribution of the number of Children in 1995 and 2005.
0
10
20
30
0 2 4 6 8 10 12 14 16 0 2 4 6 8 10 12 14 16
1995 2005
Pe
rc
e
n
t
Children ever born
Graphs by year
Source: DHS- 95, DHS-05
Table 4 summarizes some complementary information about the sample
used in the estimations. As it can be seen, the age of the first and the last child does
not change during the period, so it seems to be no significant effects of the increase
in schooling years (which presents a small but significant change) on the PGI, at
least for the sample used. It is important to take into account that since we only
refer to women between 30 and 40 years old, the age at the last child may be
underestimated, since for this group of women there is still a period of fertile time.
Besides, this would mean that those women only have approximately six years of
fertile activity. Instead, we could think about this period as the interval of time
between the first and the last child the woman has at the moment of the survey,
with the possibility that she decides to have more kids. The number of children also
has an increase between the period analyzed. From this statistics we can also say that
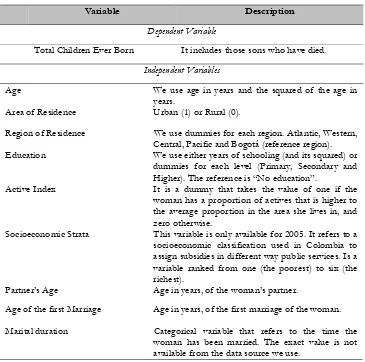
Table 3. Definition of Variables used
Variable Description
Dependent Variable
Total Children Ever Born It includes those sons who have died.
Independent Variables
Age We use age in years and the squared of the age in
years.
Area of Residence Urban (1) or Rural (0).
Region of Residence We use dummies for each region. Atlantic, Western, Central, Pacific and Bogotá (reference region). Education We use either years of schooling (and its squared) or
dummies for each level (Primary, Secondary and Higher). The reference is “No education”.
Active Index It is a dummy that takes the value of one if the woman has a proportion of actives that is higher to the average proportion in the area she lives in, and zero otherwise.
Socioeconomic Strata This variable is only available for 2005. It refers to a socioeconomic classification used in Colombia to assign subsidies in different way public services. Is a variable ranked from one (the poorest) to six (the richest).
Partner’s Age Age in years, of the woman’s partner.
Age of the first Marriage Age in years, of the first marriage of the woman.
Marital duration Categorical variable that refers to the time the woman has been married. The exact value is not available from the data source we use.
Table 4. Summary Statistics
1995 2005
Number of children 2.65 2.39
(1.88) 1.66
Age at the first son 22.08 21.89 (4.53) (4.45)
Age at the last son 28.59 28.19
(4.65) (4.75)
Years of Schooling 7.41 8.41
(4.34) (4.42)
Observations 3223 11005
% Urban people 74.30% 77.19%
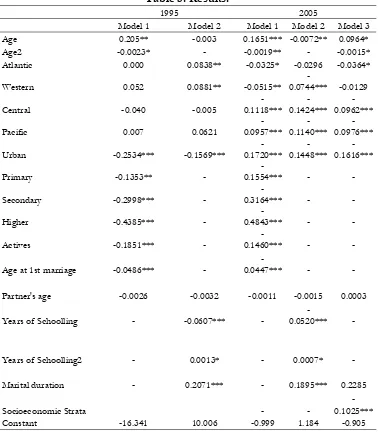
[image:15.595.181.417.507.695.2]4. Results
Table 5 summarizes the results of the estimated models. The first model
includes dummy variables for educative levels and the second specification includes
the years of schooling. Since the information about socioeconomic strata is only
available for 2005, the third specification –which incorporates this variable–, is
[image:16.595.86.464.218.651.2]estimated only for 2005.
Table 5. Results.
1995 2005
Model 1 Model 2 Model 1 Model 2 Model 3
Age 0.205** -0.003 0.1651*** -0.0072** 0.0964*
Age2 -0.0023* - -0.0019** - -0.0015*
Atlantic 0.000 0.0838** -0.0325* -0.0296 -0.0364*
Western 0.052 0.0881** -0.0515**
-0.0744*** -0.0129
Central -0.040 -0.005
-0.1118*** -0.1424*** -0.0962***
Pacific 0.007 0.0621
-0.0957*** -0.1140*** -0.0976***
Urban -0.2534*** -0.1569***
-0.1720*** -0.1448*** -0.1616***
Primary -0.1353** -
-0.1554*** - -
Secondary -0.2998*** -
-0.3164*** - -
Higher -0.4385*** -
-0.4843*** - -
Actives -0.1851*** -
-0.1460*** - -
Age at 1st marriage -0.0486*** -
-0.0447*** - -
Partner's age -0.0026 -0.0032 -0.0011 -0.0015 0.0003
Years of Schoolling - -0.0607*** -
-0.0520*** -
Years of Schoolling2 - 0.0013* - 0.0007* -
Marital duration - 0.2071*** - 0.1895*** 0.2285
Socioeconomic Strata - -
-0.1025***
Constant -16.341 10.006 -0.999 1.184 -0.905
*p<0.05; ** p<0.01; *** p<0.001 Source: DHS- 95, DHS-05
As it can be seen, in 1995 we find that women’s age has a positive but
decreasing relationship with the number of children ever born. Moreover, we can
affirm that the effect is statistically significant. This relationship probably reflects the
because of their preferences related to accumulation of human capital through years
of schooling at this stage. Nevertheless, women’s partner’s age does not seem to
have a significant effect on the number of children ever born.
The results for 1995 show that region seems to have no significant impact on
the number of children a woman has, while for 2005 we could affirm that women
who live in Bogotá -controlling for the rest of variables- tend to have more kids.
Since in Bogotá we find a higher proportion of more educated women (80% of the
sample in Bogotá, has secondary or higher education level), we could state that this
result may be the consequence of the migration of big families to Colombia’s capital
city. In general, these are families of the lowest level of income in which it is
common to see higher number of children per woman.
Nevertheless, the area where the woman lives is an important determinant of
fertility: as descriptive statistics had shown, the statistical results also indicate that
living in urban zones has a negative association with the number of children a
woman has. According to the semielasticities obtained, living in urban areas
decreases the expected number of kids by 18.45% in 1995, and by 15.35% in 2005.2
In Colombia this is an expected result since educative levels are lower in rural areas;
besides, family income is lower in these areas and, especially in these zones children
might be seen as a production factor since jobs are usually more intensive in the use
of labor, than in more populated areas. In addition, for the sample analyzed, age at
first marriage is lower in rural areas than in urban ones (both in 1995 and 2005)
which explains that the PGI may start earlier for women living in rural areas. The
effect of age at first marriage could be related to the PGI: we could expect that
women who get married when they are very young, have more children with respect
to women who get married later. The percent change obtained, indicates that for
every additional year the woman postpones her marriage, the number of children
ever born decreases by 4.7% (1995) or 4.4% (2005). Therefore, the results confirm
that the later a woman gets married, the fewer children she has.
In fact, this could be associated to education, since more educated women
tend to get married later. In this sense, education could affect the number of
children through its impact on marriage decisions. Equally important, marital
duration is positively correlated with the total children ever born, which could be
explained taking into account two facts: on the one hand, that the longer a marriage
lasts, reflects more stability and makes it a proper environment to bring children up;
on the other hand, higher durations of marriages may reflect the fact of having
gotten married earlier (since the sample used only includes women between 30 and
40), which could also be associated to the PGI.
According to the results, socioeconomic variables related to education -either
dummy variables for different levels of education or years of schooling- seem to be
significant determinants of fertility in Colombia. In comparison to women with the
lowest level of education, more educated women appear to have fewer children.
Moreover, the biggest marginal effect (among the dummy variables that refer to
different levels of education), is the impact of higher education. The elasticities
obtained show results in the same direction: in 1995 having a primary, secondary or
higher education degree, reduces the expected number of kids by 12.7%, 25.9% and
35.5%, with respect to the fact of having no education. These values in the case of
2005 are 14.4%, 27.1% and 38.4% respectively. Hence, the effect of having finished
an educative level in 2005 is higher than in 1995. Besides, the results related to the
impact of years of schooling, reflect the relationship of these two variables –
education and number of kids-, shown in Figure 1: by using marginal effects
(instead off the summary statistics), we found a negative but increasing effect of
years of schooling.
The variable associated to the relative socioeconomic position of the woman
(Actives) indicates both in 1995 and 2005 that a higher socioeconomic position tends
to be linked to the fact of having fewer children and its effect is statistically
significant. Finally, the effect of Socioeconomic estrata shows that a higher
socioeconomic position has an inverse relationship with the number of children a
woman has, and its effect is significant.
5. Conclusions
The inverse relationship between fertility and schooling is widely accepted
income-. Our findings show that women in Colombia increased their schooling and
one of its effects is the reduction in the number of the children they have. The
effect of education on fertility is higher in 2005 than in 1995 and some possible
explanation for that can be related to the messages coming from the mass media
and the public health programs. In this work, we estimate how the relation between
these two variables has changed in the last decade, for the case of Colombia. We
find that there are no stronger regional effects but the place of residence (urban or
rural) has distinct results.
According to the results of the PRM, education and fertility are negatively
associated in Colombia. In fact, the number of years of schooling has a negative but
increasing effect on the number of children a woman has, for the sample analyzed
(women between 30 and 40 years old). In other words, higher educative levels
reduce the number of kids, in comparison to not having any level of education. This
could be a consequence of the advances in enrollment rates that have taken place in
recent years. Besides, we should take into account the potential externalities
education has on other variables related to fertility rates. Thus, education affects
fertility decisions through different channels and public policies that look for natal
controls on population may have in education an important tool.
From a policy point of view, it is important to highlight the differences into
rural and urban women. We found that although urban-rural differences in the
average number of kids per woman has narrowed in recent years, the zone where
the woman lives is still an important determinant of the number of children ever
born. This could be explained by the differences related to level of income, years of
education and even cultural differences. Moreover, due to geographical conditions,
many of the contraceptive programs are concentrated only in urban areas. However,
internal migration still continues in Colombia for reasons as violence, absence of
opportunities among others, and this fact reduce the efficiency of programs
designed for fertility and contraception. In this sense, policy-makers should
differentiate the decisions related with fertility goals, between urban and rural areas.
References
Ainsworth M., Beegle, K., Nyamete, A. (1996). The impact of women's schooling on fertility and contraceptive use: a study of fourteen sub-Saharan African countries. World Bank Economic Review 10 (1), 85–122.
Becker, G.S. (1991). A treatise on the family (Harvard University Press, Cambridge, MA).
Camacho, A. (2007). Stress and birth outcomes: evidence from terrorist attacks in Colombia. Universidad de los Andes. Documento CEDE 2007-18. September. Bogotá
Cameron A. and P.Trivedi. (2005). Microeconometrics: Methods and Applications. New York. Cambridge University Press
Cleland, J. and C. Wilson (1987). Demand theories of the fertility transition: An iconoclastic view, Population Studies 41, S-30.
Cochrane, S.H. (1979). Fertility and education. What Do we Really Know? World Bank Staff Occasional Papers. The World Bank
Easterlin, R.A. (1989). Fertility, in: J. Eatwell et al. Social economics (W.W. Norton, New York).
Elkins, H. (1973). Cambio de Fecundidad. En La Fecundidad en Colombia. Heredia R & Prada E eds. ASCOFAME, Bogotá
Florez C. E. and V. E. Soto (2007). La fecundidad y el acceso a los servicios de salud reproductiva en el contexto de la movilidad social en América latina y el caribe Documentos Cede Agosto No. 16.
Handa, S. (2000). The Impact of Education, Income, and Mortality on Fertility in Jamaica. World Development, Elsevier, vol. 28(1), pages 173-186.
Hicks and Martinez (1985). Las Determinantes de la fecundidad dentro del matrimonio en España, Reis, 195-212.
Josipovic, D. (2007). Education and Fertility: Do educated parents have fewer children? Anthropological notebooks, 13, 35-50.
Michael, R. (1973). Education and the derived demand for children. Journal of Political Economy 81, S128-S164.
Okonkwo, U. and Terry, B. (2008). Does female schooling reduce fertility? Evidence from Nigeria. Journal of Development Economics.
Sander W. (1992). The effect of women’s schooling on fertility. Economics Letters 40 (1992) 229-233 North-Holland.
Schultz, T. P., ed (1998) “Demand for Children in Low Income Countries” Handbook of Population and Family Economics volume 1A eds. Mark Rosenzweig and Oded Stark Amsterdam, The Netherlands Elsevier Press United Nations (2001). World Population Prospects. The 2000 Revision. Highlights,
WP 165. Population Division
Wills, M. (1976). Diferencias regionales de la Fecundidad en Colombia. ASCOFAME. Bogotá.