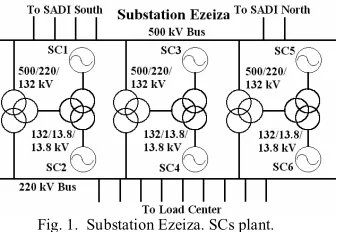
Synchronous compensators . Models verified by test of automatic voltage regulator, reactive power control and voltage joint control
Texto completo
Figure
Documento similar
methodologies are also shown in the figure: the centralized PID control of Xiong [7], a multiloop PI controller based on Lee’s method [28], and a simplified decoupling using the
The battery containing MEM-Br complexing agent shows a higher cell voltage during the charging and lower cell voltage during discharging.. This occurs due to the higher resistance
Figure 5 shows an extended block diagram by including wind power generation frequency control (∆P WFs ) and demand-side contribution to PFC and SFC considered in Area 1 (∆P DS SFC
Labels to show the simulation data (speed and position block) ... Configuration parameters of the motor and driver subsystem ... Simulation of DC motor operation. Closed control
To control and ensure the compensation of the EVSE reactive power consumption, the EBox communicates with a grid analyzer to know the reactive power value and send the
From this station, two different connections are made to the laboratory. One of them starts from the high voltage area of the transformer station and provides a power of around 100
By setting appropriate compensation current references from the sensed load currents in control circuit loop of DG link, the active, reactive, and harmonic load current components
Figure 3 shows the complete measurement system diagram. As shown there, the power meters convert the radiofrequency power collected at the coaxial probes into a DC voltage. A personal
