! " # $% " $% &
' ## (
! !
"
# $%& $'&
! (
) *
+
)
,
! , -.. !/ 0 12.. !/ 30
) ( * +'
/ + 4 ( % ( % +
5 "" ,-.. / / * *0 #
!
"#$ $ #% $ & :
. # 1 2
% ' (
(
) 7
) +%%% 288 6998 :6; +%0
26<=25699= :>; !
( '? %?
$ &
@/
+ )
2 $4/ &
) 3
, $A/&
( !
$/B& !
! ,
( C
+ * $C+*& +
$/ &
$BD& $/B&5
, (1)
# ) $A/&
* 5
(
! )
> $+*B& ) $>&
(2)
(
'
2 $/+&
,
! -.. !/ 0 $ ( 6 E
8& 2.. !/ 30 ( > - +
30
[image:3.612.91.562.293.709.2]+ '
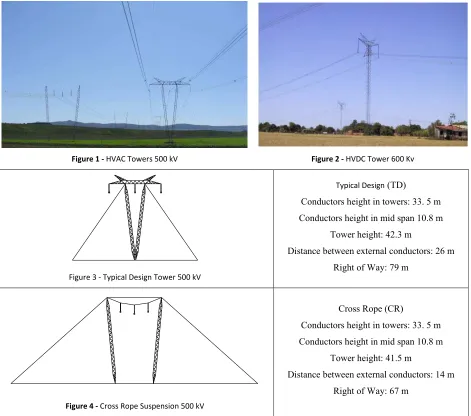
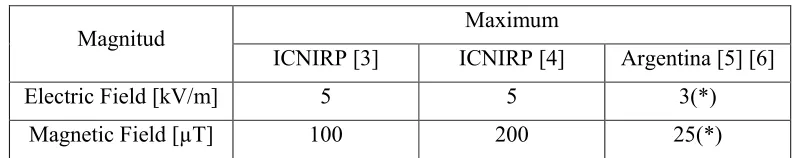
Figure 1 - HVAC Towers 500 kV Figure 2 - HVDC Tower 600 Kv
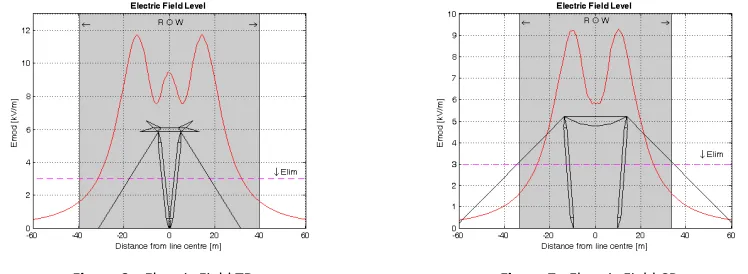
Figure 3 - Typical Design Tower 500 kV
Typical Design$ 3&
0 5 EE
-0 6. =
5 8> E
3 5 >2
? F 5 <9
Figure 4 - Cross Rope Suspension 500 kV
0 ? $0?&
0 5 EE
-0 6. =
5 86
-3 5 68
Figure 5 - HVDC CC 600 kV
@/30
0 5 E< 8
0 5 6. =
5 82 .
3 5 6- 8
(
68.. 6>.. 4F ( @/30
68..
+ !
! +
!
4 % 5
6 5 7% 2 $ 5
)
6 +0G+?B :E; :8;
! :-; :2;
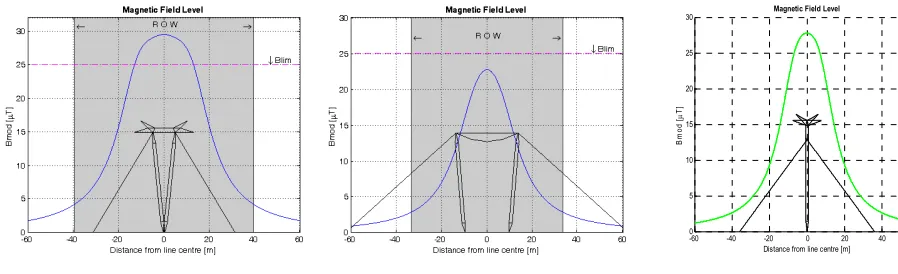
Table I – Maximum levels of electric and magnetic fields.
4 4
+0G+?B :E; +0G+?B :8; :-; :2;
% ( :!/" ; - - E$H&
4 ( :I ; 6.. >.. >-$H&
$H& ? F $?#F&
6 ' 5 ? @ +0G+?B :<;7 8.. . -( +0G+?B
/ % $8
? *% <<"699= :E; %
[image:4.612.106.512.464.543.2]8 5
/
B
#
5 )
(
'
9 %
( 2 3 ( < 0?
( @/30 !
+0G+?B
[image:5.612.118.492.388.525.2]% 0?
Figure 6 – Electric Field TD Figure 7 - Electric Field CR
#
( = 3 ( 9 0? (
) " * $
Figure 8 - MagneticField TD Figure 96 – MagneticField CR Figure 70 - MagneticField HVDC
4 0?
?
( 2.. !/ 30
+0G+?B
/ % $8
)
/ 5 * !
+ $/B&
5 !
7 !
7 !
) +
!
+ #/ 5 0
$4/ &
( 66 )
2
a) Neighbouring observers b) Initial visibility (VA)
c) Sharpness Correction (VA x PL) d) Visibility from residential areas (VA x PL x VP)
% .. * J
% :/
+ 0/5 + !
#
) $A/&
( 6E K ( 68
)
)
Figure 13 - Landscape units identified Figure 14 - Quality of Landscape map of landscape units.
' 5 D
0 $4/ & ) $A/&
(
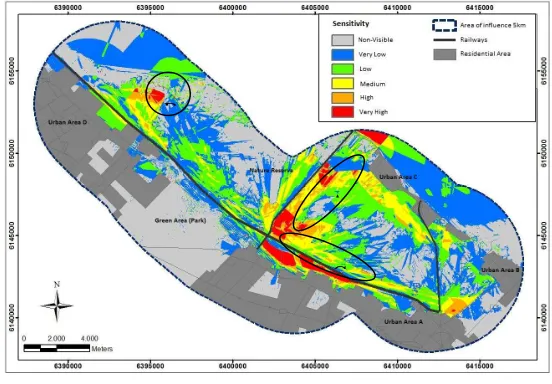
6-* "( +, #Landscape sensibility Map.
/ 5 + '
( 62 '
[image:8.612.96.532.97.248.2] [image:8.612.169.445.355.547.2]= * "( - #Visual Impact for line route 1 and 2.
! (
3 6
C
F ) 7
7 !
7
?
! 5
/ + % 4 (
3 44
4
@ % 4
4
0? *
4 4
D % 4
0
@/30 D D
@ G %
; %
(
0?
+
+0G+?B 30
30
! +
) )
( ! ,
F ,
*! <(
:6; +%%% * 288 4 6998 $?>..=& +%%% * B 4 B
( ) % 4 ( ( 0 B D
:>; +%0 26<=25699= 4 )
* )
:E; C D % / % 4
% ( $ E.. C@ & +0G+?B 699=
:8; C D % / % 4 ( $6 @
6.. L@ & +0G+?B >.6.
:-; ? M *% <<"9= * N % N G M $ & ' N #
GO >= =-9 6P * M
:2; ? M %G?% .-82"6999 % G ? % $ &
' N # GO >9 6E- 6<
:<; C D % * 4 ( +0G+?B >..9
:=; 0+C?Q ' E=E * 3 B +