The impact of economic inmigration on labour opportunities of native born workers : the Spanish case
33
0
0
Texto completo
(2) The impact of economic immigration on labour opportunities of native born workers: The spanish case. WORKING PAPERS The Institute of Social and Economic Análisis (Servilab) edits Working Papers, where are included advances and results of some research projects done as part of the research done by the Institute’s staff and other researchers in colaboration with the Institute. Those Working papers are available in : http://www.servilab.org/iuaes_sp/publicaciones.htm. ISSN:. 1139-6148. LATEST WORKING PAPERS WP-2/05 SECTORIAL STRUCTURE, QUALIFICATION CHARACTERISTICS AND PATTERNS OF LABOUR MOBILITY. Carlos Iglesias Fernández y Raquel LLorente Heras. WP-3/05 GROWTH AND PRODUCTIVE DYNAMISM OF BUSINESS SERVICES: EU15, SPAIN AND THE REGION OF MADRID. Antonio García Tabuenca y Fernando Coral Polanco. WP-4/05 OWNERSHIP AS A DETERMINING FACTOR IN THE EVOLUTION OF EFFICIENCY Nuria Fernández Conejero. WP-5/05 LAS DIFERENCIAS REGIONALES EN EL BIENESTAR: UN ANÁLISIS DESDE LA PERSPECTIVA DEL OCIO Patricia Gabaldón Quiñones, Elena Mañas Alcón y Rubén Garrido Yserte. WP-1/06 ¿SE ESTAN DESLOCALIZANDO LOS SERVICIOS EXTRANJEROS EN ESPAÑA? Marta Muñoz Guarasa. WP-2/06 EL IMPACTO DE LAS TIC EN LAS FAMILIAS Federico Pablo Martí, Elena Mañas Alcón y Juan Ramón Cuadrado Roura WP-3/06 HOW HAS EUROPEAN MONETARY POLICY CHANGED SINCE THE CREATION OF THE ECB? ESTIMATION OF A TAYLOR RULE FOR THE EMU (19912005) Maria Jesús Arroyo, Román Mínguez y Jorge Uxó. WP-4/06 CONSUMO DE SERVICIOS Y CICLO VITAL: UN ANÁLISIS DE LOS HOGARES ESPAÑOLES CON DATOS DE CORTE TRANSVERSAL Jose A. Camacho Callesta y Manuel Hernández Peinado. Institute of Social and Economic Analysis Plaza de la Victoria, 1. 28802. Alcalá de Henares. Madrid - Telf. (34)918895703 Fax (34)91889 8646 E-mail: servilab@uah.es WEB: www.servilab.org. Institute of Social and Economic Analysis Working paper 05/2006 , 33 pages, ISSN: 1139-6148. 2.
(3) The impact of economic immigration on labour opportunities of native born workers: The spanish case. THE IMPACT OF ECONOMIC IMMIGRATION ON LABOUR OPPORTUNITIES OF NATIVE-BORN WORKERS: THE 1 SPANISH CASE ABSTRACT: The reception of immigrants is one of the most important events currently occurring in the Spanish labour market, not only due to its magnitude, but also due to the potential effect it could have on employment. This article aims to assess the impact of the arrival of an immigrant workforce upon the labour opportunities of native-born workers and also to provide empirical evidence to interpret the results obtained. In order to do so, we will use data provided by the Spanish Labor Force Survey (EPA) during the 1997-2004 period, firstly comparing the position held by native- and foreign-born workers in the labour market, and then, evaluating the effect exerted by the changes registered in the immigration rate from different approaches regarding the labour opportunities of nativeborn workers. The results obtained highlight the fact that both groups are notably different regarding their labour positions. Moreover, a negative result, although not very substantial, arises from the comparison between the immigration rate and the employment and unemployment rates; however, the numbers are higher if we restrict the analysis to less-qualified groups. KEYWORDS: Economic Immigration, Labour Opportunities, Skill Groups, EPA, Spain. JEL Codes: J21, J11.. RESUMEN: La recepción de inmigrantes es, tanto por su magnitud como por los potenciales efectos laborales que puede inducir, uno de los hechos más relevantes que actualmente están teniendo lugar en nuestro mercado de trabajo. Este artículo tiene como objetivo determinar los efectos inducidos por la llegada de mano de obra inmigrante sobre las oportunidades laborales de los trabajadores nacionales, aportando además indicios empíricos con los que interpretar los resultados que se obtienen. Para ello, utilizando los datos aportados por la Encuesta de Población Activa (EPA) para el periodo 1997-2004, primero se compara la posición detentada por los trabajadores nacionales e inmigrantes en el mercado de trabajo, para posteriormente estimar el efecto ejercido por la variación de la tasa de inmigración sobre distintas aproximaciones de las oportunidades laborales de los trabajadores nacionales. Los resultados obtenidos subrayan el hecho de que ambos colectivos se diferencian notablemente en cuanto a su ubicación laboral. Además, se concluye un efecto negativo, aunque de escasa magnitud, entre la tasa de inmigrantes y las tasas de empleo y desempleo, que sin embargo aumenta al restringir el análisis para los colectivos menos cualificados. PALABRAS CLAVES: Inmigración Ocupacional, EPA, España.. Económica,. Oportunidades. laborales,. Estructura. AUTHORS: CARLOS IGLESIAS FERNÁNDEZ, University of Alcalá and Institute for Economic and Social Analysis – SERVILAB.(carlos.iglesias@uah.es) RAQUEL LLORENTE HERAS, Institute for Economic and Social Analysis– SERVILAB. (raquel.llorente@uah.es) 1 This article is based on some of the main results obtained in the research Immigration and Labour Market: Analysis of some fundamental issues. We are grateful to Foundation BBVA for financial support.. Institute of Social and Economic Analysis Working paper 05/2006 , 33 pages, ISSN: 1139-6148. 3.
(4) The impact of economic immigration on labour opportunities of native born workers: The spanish case. INDICE 1. Introduction........................................................................... 5 2. Main Trends regarding Immigration in Spain............................... 9 3. Data ....................................................................................13 4. Empirical approach and main results ........................................17 4.1 The Labour Position of Native and Foreign-Born Workers in the Spanish Labour Market.....................................................17 4.2 Immigration and Labour Opportunities of Native-Born Workers. ....................................................................................20 5. Concluding remarks ...............................................................25 6. References ...........................................................................28. Institute of Social and Economic Analysis Working paper 05/2006 , 33 pages, ISSN: 1139-6148. 4.
(5) The impact of economic immigration on labour opportunities of native born workers: The spanish case. 1. INTRODUCTION. I. mmigration is one of the most significant events currently occurring in Spain, not only due to its magnitude, but also to the potential labour effects induced.. Regarding the first approach, and although these processes are relatively recent2, the admission of immigrants is already of a remarkable intensity. According to the Spanish Labor Force Survey (EPA), 3,487.9 thousand foreigners were living in Spain in the third quarter of 2005. As shown in the Census of population, in 20013 there were a total of 1.572 thousand foreigners in Spain. And finally, in accordance with the figures held by the Spanish Home Office, 2,597 thousand foreigners were living in Spain with a residency card in September 2005. An interesting aspect is that, between 1996 and September, 2005, the number of foreigners with a residency card grew 382 percent, going from around 538 thousand people to the aforementioned two and a half million. With regard to the impact caused, the economic analysis of immigration (Abowd and Freeman, 1991; Borjas, Freeman and Katz, 1996; Hazari and Sgro, 2001; Stark, 1991, among other general references) points out that the impacts and consequences of immigration processes on the labour markets of host countries are outstanding and complex. Such processes can affect either supply or demand of employment, market performance (wage formation and labour mobility), and their outcomes (lack of some supply segments and/or unemployment). Considering the diversity of effects established in the specialised literature, one of the issues arousing most interest within the economic analysis of immigration has been the study of the impact of these processes on labour conditions of native-born workers. Numerous economic studies have focused on this problem (Borjas, 1994 and 1999; Friedberg and Hunt, 1995, among others). The theoretical framework from which this issue is tackled seems, at first sight, to be simple. From a Neoclassical perspective, and according to the arguments of a simple supply-demand model, immigration implies an increase of labour offer, therefore: a) If wages are flexible, the arrival of immigrants would be translated into a reduction in the wages of native-born workers. 2. Spain is still considered as a new immigration country in specialised literature. See OCDE (2001) for further information in this regard. 3 According to the last revision of the Municipal Register, this figure amounted to 3,730.67 million immigrants on January 1, 2005, which means 8.5 percent of total people registered.. Institute of Social and Economic Analysis Working paper 05/2006 , 33 pages, ISSN: 1139-6148. 5.
(6) The impact of economic immigration on labour opportunities of native born workers: The spanish case. Nationals could also lose jobs due to the fact that the new equilibrium wages established by the market would now be under its reservation wage, so some native-born workers would rather become inactived than accept the new wage. b) If the labour market is characterised by rigid wages, the consequence of the supply shock caused by the arrival of immigrants would be an increase in the unemployment rates (a reduction of employment rates) of native-born workers. An aspect related to the aforementioned question is the calculation of the so-called “excess immigration” (Borjas, 1995). The arrival of immigrants reduces the workers’ wage income, but increases that of employers. Therefore, this benefit could surpass the loss registered in the welfare of workers, generating a global economic surplus for the recipient country associated with immigration flows. Furthermore, lower wages, resulted from the displacement caused in the labour supply by the flow of immigration, would imply lower production costs and lower sale prices of the products. Finally, an increase in product demand, the level of production and lastly labour demand, would be expected. This last effect would compensate, at least partially, for the losses caused by the previous effects on the native-born population. The above-mentioned potential results must be dealt with in greater detail in order to consider whether immigrant workers could substitute or complement native-born workers. In the first case, the arrival of immigrants could imply a reduction of wage levels or the employment rates of the native labour force. On the contrary, in the second case, a higher presence of immigrant labour supply could encourage the national workforce, increasing wages and employment levels. Another possibility is that national and immigrant workers are independent, holding different jobs with no effect on each other. As regards to the previous matter and aside from the Neoclassical thought, we must also stress the existence of alternative theoretical approaches, which try to explain why it is not likely that immigrants will compete with nationals for the same jobs. According to the Queuing Theory (Thurow and Lucas, 1972; Thurow, 1976), native- and foreign-born workers will not compete for the same jobs (they will not be substitutive), which would explain the fact that immigration flows only have a slight effect on the labour circumstances of native workers. In line with this model, workers are listed based on the relationship between their potential productivity and their wage rates, so that companies will first contract those with the best positions in the queue. Nationals and immigrants should be situated in similar positions in the contracting queue so that they can compete for the same jobs. However, immigrant workers seem to be at the end of the. Institute of Social and Economic Analysis Working paper 05/2006 , 33 pages, ISSN: 1139-6148. 6.
(7) The impact of economic immigration on labour opportunities of native born workers: The spanish case. queue, and therefore they will be assigned to different jobs from those held by native-born workers. Alternatively, although similarly, according to the dual labour market theory (Doeringer and Piore, 1971), national and immigrant workers would neither compete for the same positions due to the fact that the former are positioned in the primary sector, and the latter in the secondary sector. Mainly, immigrants would compete with less-qualified national workers, who are also included in the secondary sector. On the contrary, immigrants could favour the employment of native-born workers of the primary sector because these kinds of positions require the complementarity of secondary employment. The previous arguments lead to the statement that changes observed regarding labour conditions of native-born workers depend on the fact that there is a substitutive relationship between national and immigrant labour supply. This clearly means that the composition of immigration is as important as its volume, especially in terms of labour qualifications. Nevertheless, the empirical evidence available with respect to the measurement of the effects of immigrants on labour opportunities of native-born workers is not very sound, and moderate effects are concluded. Regarding this, we can mention the works carried out by Altonji and Cards (1991), Schoeni (1997), Friedberg (2001) and Angrist and Krugler (2003). The reason for these poor results could have a methodological cause. The way in which the verification is tackled implies the application of the focus on “spatial correlations”. According to these, the correlation between wages and/or the employment rate with the fraction of immigrants included in the labour supply of a local or regional labour market is calculated. However, this focus has some problems: It could be that immigrants do not get distributed at random among the different markets, but in those with the best results, which biases the value of the correlation downwards; moreover, the native job offer could act according to the statement “voting with your feet”, so, admitting that the production factors are mobile, the response of the native labour force before the arrival of immigrants is to move to other markets not penetrated by immigration. Therefore, the correlation does not reflect fully the impact of immigration (Borjas, 1999, 2003). A methodological alternative to the previous approach is carried out in Borjas (2003), where spatial correlations are replaced by correlations between different groups of workers, defined according to their qualification level (skill groups). All in all, the approach consists of correlating an indicator of labour opportunities for nationals with the presence of immigrant labour supply, for equivalent workers’ groups (national and immigrant) in terms of qualifications, where the strategy is to differentiate the national and immigrant labour force into defined groups, so that individuals can not move between them. This eliminates the problem of spatial correlations.. Institute of Social and Economic Analysis Working paper 05/2006 , 33 pages, ISSN: 1139-6148. 7.
(8) The impact of economic immigration on labour opportunities of native born workers: The spanish case. Within the framework of the previous arguments, the aim of this study is to establish the effect brought about by the immigrant labour force over the labour conditions of native-born workers. With this purpose, and on the basis of the explanatory importance given to the labour qualifications, we will firstly analyse the labour jobs (activity sectors and occupations) of immigrants and nationals in order to conclude whether there are indications that both groups compete or not for similar labour locations. Taking this result as a basis, we will try to quantify the effect of immigration on the employment rates of national workers, for which we will follow the methodology described by Borjas (2003). In our opinion, the issue tackled and the work carried out for its analysis is justified by and significant for the following reasons: a) The growing quantitative importance of immigration in Spain. b) The still sparse economic analyses performed in this regard in Spain (Carrasco, 2002; Carrasco, Jimeno and Ortega, 2004; Dolado, 2002; Dolado, Jimeno and Duce, 1997; Izquierdo, 2003, Cuadrado, Iglesias and Llorente, 2005). c) The peculiar features defining not only the Spanish labour market, but also the institutions and the implemented immigration policy. The information used comes from the EPA, an alternative to those most frequently supporting this type of analyses with respect to the Spanish case (Census of Population and administrative data for work permits from the register of Spanish Ministry of Employment and Social Affairs). We are aware that, given its sample nature, the EPA confronts important problems regarding the attempt to quantify the immigrant population living in Spain4. However, this is an interesting information source when we want to understand the structure of immigrant population according to a wide range of variables, such as those included in the survey of this statistical source. This feature made us use this database because the variables included allow the application of the methodology suggested by Borjas (where the classification, as the one we determine, is based on educational and labour experience criteria) to the Spanish case. This one is more accurate and complete than that indicated by the alternative methodologies5. The rest of the article is organised as follows: Paragraph 2 describes the main guidelines of immigration in Spain; paragraph 3 establishes the data and the approach of the analyses used; in paragraph 4, the 4 Tackled through the change of methodology carried out as of 2005. 5 In this sense, Carrasco, Jimeno y Ortega (2004), whose work applies the nearest methodology, use the variables of age, sex and activity sector when they use the data regarding work permits issued by the Ministry of Employment and Social Affairs; and the qualification level, labour experience and sex when the data used are those from the Population Census.. Institute of Social and Economic Analysis Working paper 05/2006 , 33 pages, ISSN: 1139-6148. 8.
(9) The impact of economic immigration on labour opportunities of native born workers: The spanish case. empirical strategy applied and the results obtained are explained; and finally, the main results are compiled and interpreted in paragraph 5.. 2. MAIN TRENDS REGARDING IMMIGRATION IN SPAIN6.. T. he admission of immigrants to Spain has become a process which has reached an important magnitude in a short period of time (figure 1). According to the data provided by the Spanish Home Office7, around 2.6 million immigrants with a residency card were living in Spain at the end of September, 2005. Comparing this figure with that of 1991, we can conclude the high intensity characterising this process, as the size of this group of population has been multiplied by six in 16 years. The growth of the immigrant population registered an increase in its annual rates in 1997 and 2000 as a consequence of the regularisation processes undertaken, which strengthened its intensity since the previous year. Figure 1. Evolution of immigrant population with a residency card living in Spain. 3.000.000 2.500.000 2.000.000 1.500.000 1.000.000 500.000 0 1991 1992 1993 1994 1995 1996 1997 1998 1999 2000 2001 2002 2003 2004 2005. Source: Immigration Yearbook. Spanish Home Office.. 6 All data correspond to December 31 except for the case of 2005, which refers to September 30. 7 Obviously referring just to a part of the immigrant population, to those with a residency card. However, these are the most recent data out of those provided by the different statistical sources available.. Institute of Social and Economic Analysis Working paper 05/2006 , 33 pages, ISSN: 1139-6148. 9.
(10) The impact of economic immigration on labour opportunities of native born workers: The spanish case. The type of immigrants living in Spain has also changed considerably (figure 2). Since the year 2000, the immigrant population registered in the general scheme (coming from non-community countries) is more numerous than those from the European Union countries (community scheme). Moreover, this behaviour is increasing over time, so the gap between both groups is becoming more pronounced. More precisely, as at September 30, 2005, the resident immigrants corresponding to the community scheme amounted to approximately 755 thousand, while those assigned to the general scheme already added up to 1,841 million people. Thus, a very considerable modification in the countries of origin of the immigrants has taken place. FIGURE 2. Evolution of immigrant population with a residency card living in Spain by schemes.. 2.000.000 1.800.000 1.600.000 1.400.000. Common Scheme. 1.200.000. General Scheme. 1.000.000 800.000 600.000 400.000 200.000. ). 20 05 (*. 20 04. 20 03. 20 02. 20 01. 20 00. 19 99. 19 98. 19 97. 19 96. 19 95. 19 94. 19 93. 19 92. 19 91. 0. Source: Immigration Yearbook. Spanish Home Office.. Institute of Social and Economic Analysis Working paper 05/2006 , 33 pages, ISSN: 1139-6148. 10.
(11) The impact of economic immigration on labour opportunities of native born workers: The spanish case. FIGURE 3. Composition of the immigrant population with a residency card living in Spain by continent of origin. Percentage over the total.. 40,00. 35,71. 35,00 30,00 25,00. 23,91 21,28. 20,00 11,93. 15,00 10,00. 6,43. 5,00. 0,05. 0,65. 0,04. 0,00 European Union. Rest of Europe. Africa. Iberoamerica Noth of America. Australian Continent. Oceanía. Without nationality or without information. Source: Immigration Yearbook. Spanish Home Office.. FIGURE 4. Composition of the immigrant population with a residency card living in Spain by country of origin. Percentage over the total.. Bolivia The Ukraine Dominican Republica France Bulgaria Portugal Germany Peru Argentina Chinese Italy United Kingdom Romania Colombia Ecuador Morocco. 20,0 18,2 18,0 16,0 14,0 12,8 12,0 10,0 7,4 8,0 6,7 5,6 6,0 4,0 3,23,13,13,02,72,2 2,0 2,0 1,91,8 1,7 2,0 0,0. Source: Immigration Yearbook. Spanish Home Office.. Institute of Social and Economic Analysis Working paper 05/2006 , 33 pages, ISSN: 1139-6148. 11.
(12) The impact of economic immigration on labour opportunities of native born workers: The spanish case. FIGURE 5. Composition of the immigrant population with a residency card living in Spain by Autonomous Region of residence. Percentage over the total. 25,0. 22,2 19,8. 20,0 15,0. 12,3. 12,0. 10,0. 4,7 6,0 5,0. 3,1 0,8. 0,9. 2,0. 1,4. 2,1. 0,9. 0,1 0,2 0,2 Without information. Melilla. Ceuta. La Rioja. Basque Country. Navarrese. Murcia. Madrid. Galicia. Estremadura. Valencian Community. Catalonia. Castilla y León. Castilla-La Mancha. Cantabria. The Canary Islands. Balearic. Asturias. Aragón. Andalucía. 0,0. 4,7. 3,1 2,9 0,7. Source: Immigration Yearbook. Spanish Home Office.. According to the most recent data available at the time of writing this article, Latin America was the highest continent of origin among the immigrants with residency permits in Spain (almost 36 percent). The second position was held by the African continent (24 percent), while the European Community was the origin of just 21 percent of the immigrants (figure 3). With a higher break-down, figure 4 shows those countries with a weighting above 1.5 percent as regards to the origin of the immigrants. Morocco is the origin of almost 20 percent of the immigrants, and Ecuador has a weighting clearly above the 10 percent. The distribution of immigrants (with a residency card) regarding the country of origin shows a high concentration. Only five countries (Morocco, Ecuador, Colombia, Romania and the United Kingdom) register 50 percent of the total immigrant population. And finally, the immigrant population living in Spain is not distributed homogeneously within the national territory. Quite the opposite, it is noticeably concentrated in those regions with the highest economic welfare. This way, only two Regions (Madrid and Catalonia) register 42 percent of the immigrants. If we add the Valencian Community, we reach 54 percent of the immigrant population.. Institute of Social and Economic Analysis Working paper 05/2006 , 33 pages, ISSN: 1139-6148. 12.
(13) The impact of economic immigration on labour opportunities of native born workers: The spanish case. 3. DATA. T. he data used in our analysis is taken from the EPA and relates to the second quarters of the years between 1997 and 2004. The EPA is a survey providing comprehensive information (basic labour populations, labour qualifications, labour conditions, etc.) regarding the human element of the economic activity, and is the source of reference for studying the Spanish labour market. The EPA includes three variables for measuring the immigrant population: The PAINA1 variable refers to the country of birth of the person surveyed if different from Spain; the NAC1 variable determines whether the nationality of the person surveyed is Spanish, foreign or of dual nationality; and finally, the EXTNA1 refers to the country that the foreign nationality of the person surveyed is connected to. We have used the criterion “country of nationality” rather than the alternative “country of birth” because we think it is more correct not to consider those people living in Spain and having Spanish nationality as immigrants, even though they were born in a different country. Henceforth, all those people with a different nationality to the Spanish one are considered as immigrants. On the basis of this first issue, the difference between “economic immigration” and “non-economic immigration” is shown, although only the former is the subject of study due to economic reasons and includes countries where the income rate or economic development level is lower than the host country (Carrasco, 1998). Following these guidelines, we have excluded from the resident population those people whose country of origin has a Human Development Rate higher than the Spanish one (Germany, Austria, Belgium, Denmark, Finland, France, Ireland, Island, Luxembourg, Norway, the Netherlands, the United Kingdom, Sweden, Switzerland, Canada, the United States, Japan and Australia). With the aim of developing a coherent definition, we have complemented the previous exclusions with the rest of European countries, in order to obviate the paradox (in our opinion) that considers Italy and Monaco, for example, as countries generating economic immigration flows towards Spain. The same consideration has been taken with respect to the remaining countries comprising the australian continent (New Zealand). We will carry out two types of analysis in this study: one aimed at determining the labour position of foreign- and native-born workers; and the other aimed at quantifying the impact made on the labour opportunities of native-born workers by the arrival of immigrants. Regarding the first analysis, the labour position of both groups will be analysed horizontally and vertically. For this, the EPA de-aggregated data regarding activity sectors and occupations are used at a two-digit level. In order to achieve statistical representation when the size of the. Institute of Social and Economic Analysis Working paper 05/2006 , 33 pages, ISSN: 1139-6148. 13.
(14) The impact of economic immigration on labour opportunities of native born workers: The spanish case. sample is reduced (case selection), the analysis finally distinguishes 32 sectors and 41 occupations. In order to determine the labour position that foreign- and native-born workers hold in the labour market, three complementary tools are used: The distribution index (the number of immigrant workers working in each sector or occupation divided by the total employment of both variables), the concentration index (the proportion of immigrants employed in each of the categories of the two previous variables over the total employment of immigrants within the framework of sectors or occupations) and the segregation index (to what extent immigrant and national workers present different horizontal and vertical concentration guidelines). An important question related to the second type of analysis lies in the election of the indicator to be used. According to the literature (Jacobs, 1993), there is a wide range of possibilities: Dissimilarity indices, weighted and unweighted Sex-Ratio index and K-M index, among others. Given its higher and more generalised application, we have decided to apply the easiest one, the Dissimilation index (Duncan and Duncan, 1955):. Σ | CI woman - CI man | 2 CI refers to the concentration index related to the group included in the sub-index. In accordance with Hakim (1993), and in relation to the distribution indexes, we will make a distinction between activity sectors/occupations dominated by immigrants, by nationals and integrated by nationalities. We will consider that an activity/occupation is dominated by the immigrant labour force when its presence exceeds by more than 10% the amount of immigrant employment over total employment. On the contrary, the activity/occupation is seen as controlled by the native-born workers when the immigrant presence is at least 10 percent below the weight of immigrants over total employment. And finally, when the percentage of immigrant employment in the sector/occupation is within the interval resulting from adding and subtracting 10 percent to the amount of immigrants over total employment, the activity sector will be deemed as having an integrated nature8. As regards to the second analysis, and as it has already been stated, the strategy entails substituting the criticised spatial correlations by correlations between “skill groups”. The idea is to classify the immigrant. 8. More precisely, sectors and occupations are integrated according to the following intervals: 0.70 – 0.58 (1997), 1.94 – 1.58 (2001), 4.31 – 3.53 (2004).. Institute of Social and Economic Analysis Working paper 05/2006 , 33 pages, ISSN: 1139-6148. 14.
(15) The impact of economic immigration on labour opportunities of native born workers: The spanish case. and national populations into defined groups on the basis of different qualificative criteria, so the mobility between the two is not simple. The variables used to create the “skill groups” comprise education level, occupation and work experience. In this way, we follow, more closely, the original approaches suggested by Borjas, complementing his definition by means of taking into consideration the data related to occupations. The variable regarding education level includes the general components of the qualifications, as long as they are related to the specific components of the work experience and occupation. We believe it to be important to take occupation into consideration to the extent that it is verified that the same educational contents can be used for different types of labour, as well as to show, as an extreme, the existence of labour overqualification or, in general, of the imbalance between qualifications held by the individuals and those required by the corresponding jobs. Occupations have been classified into four categories, depending on the type of task performed and the skill level required for its undertaking: White Collar highly-qualified workers (WCHS), White Collar low-qualified workers (WCLS), Blue Collar highly-qualified workers (BCHS) and Blue Collar low-qualified workers (BCLS). The education level has also been grouped into four categories: No education, compulsory education, secondary education, vocational training and university education. Regarding work experience and considering the related information provided by the Active Population Survey (EPA), this variable measures the most recent work experience of any person. For those currently employed, we use the questions from the EPA referring to the duration of their current employment contract. To calculate the work experience of those unemployed and inactive, we subtract the date on which the person declares to be unemployed or inactive from the starting date when he/she declares to have started the labour relationship in the last company where he/she worked. This is how we acquire the information regarding the duration of the last (and therefore the most recent) employment information. This approach can be especially interesting in the case of immigrants: The most recent experience is usually the one having the highest influence on the labour market, as this has generally taken place in the national labour market itself, against the employment information and qualifications provided by the immigrants which have not been acquired in the labour market of the target country, and frequently not valued by national employers (Borjas, 2003). Finally, the variable referring to work experience has been divided into four periods: Less than 12 months, from 13 to 48 months, from 49 to 144 months and 145 months and over. Therefore, when taking the period used for the analysis into consideration (from 1997 to 2004), the definition given to the variables leads us to a total of 512 boxes (4 occupations x 4 education levels x 4 intervals of work experience x 8 periods of time).. Institute of Social and Economic Analysis Working paper 05/2006 , 33 pages, ISSN: 1139-6148. 15.
(16) The impact of economic immigration on labour opportunities of native born workers: The spanish case. With the aim of assessing the impact of immigration on labour opportunities of native-born workers, we have carried out two types of estimates, distinguished by their dependent variable. The first one uses the employment rate of the Spanish population to estimate the labour results of native-born workers. The second estimate takes into account the impact exerted by the arrival of immigrants also on the unemployment rate of native-born population. The employment rate has been calculated as the percentage of people employed over the working-age population, which is comprised by employed, unemployed and inactive population: yijet= Oijet / (Uijet + Oijet + Iijet). (1). where i is the occupation, j is the education level, e the work experience and t refers to time, y is the occupation rate, O is the employed population, U the unemployed population and I the inactive population. In the case of unemployed or inactive population, the occupation developed in their last job has been considered as the occupation. On the other hand, the unemployment rate has been considered as the unemployment population among the active population, comprised of employed and unemployed population. uijet= Uijet / (Uijet + Oijet). (2). As is shown in the diagram boxes created, we have considered the occupation developed in their last job as the occupation of the unemployed population. Thus, we are only taking those unemployed with professional experience into consideration. We have considered the percentage of “economic” immigrants as an independent variable in each of the boxes considered (i occupation, j education level, e labour experience and t time): pijet = Mijet / (Mijet + Nijet). (3). where M is the immigrant population living in Spain and N refers to the national population, both characterised according to the criteria used.. Institute of Social and Economic Analysis Working paper 05/2006 , 33 pages, ISSN: 1139-6148. 16.
(17) The impact of economic immigration on labour opportunities of native born workers: The spanish case. 4. EMPIRICAL APPROACH AND MAIN RESULTS. A. s we have pointed out previously, the analysis implies the development of two consecutive approaches. On the one hand, we can show whether foreign- and native-born workers hold a similar labour position or not. On the other hand, we can assess the effect of the immigration rate on different measures of labour opportunities of nativeborn workers.. 4.1 The Labour Position of Native and Foreign-Born Workers in the Spanish Labour Market. Table 1 shows the distribution and concentration indices by activity sectors for the employed immigrant population. We can observe that: a) Foreign-born workers have penetrated the labour market only moderately. The majority of sectors (62.5 percent in 1997 and 75 percent in 2004) show an underrepresentation of immigrant workers. It is a well-known fact that Agriculture, Construction, Hotel Industry, Home Services and, to a lower extent, Clothing, are the activities most oriented to the immigrant sector. b) Evolution does not seem to generate a change in this situation: between 1997 and 2004, the number of activities “dominated” by foreign-born workers remained stable, and those sectors “dominated” by nationals increased substantially and therefore, the number of “integrated” sectors decreased. c) We must highlight the strong sectorial concentration of the immigrant group. Only three activity sectors (Construction, Hotel Industry and Home Services) add up to 52.44 percent of the total immigrants. d) As regards to the segregation level, the Ducan and Ducan index produces values of 0.284 and 0.349 for 1997 and 2004, respectively. To the extent that the index varies between 0 (maximum similarity) and 1 (maximum dissimilarity), it shows that the working population of immigrants and nationals has only moderately differed in 1997, although the level of dissimilarity has increased notably, reaching significant proportions.. Institute of Social and Economic Analysis Working paper 05/2006 , 33 pages, ISSN: 1139-6148. 17.
(18) The impact of economic immigration on labour opportunities of native born workers: The spanish case. TABLE 1. Distribution and concentration indices for immigrant and national employment by activity sectors. Horizontal viewpoint. Percentages9. Activity Sectors Agricult., Stockbr., Hunting and Related Act. Other Primary Activities Extractive Industries Food, Beverages and Tobacco Textile Industry Clothing, Fur and Leather goods Wood, Cork, Basketmaking and Esparto Energy, Water and Recycling Chemical Industry Rubber, Plastic Materials and Others Metalurgy and Metal Prod. Manuf. Construc. Ind. Machinery and Mech. Equipm. Machinery Manufacturing Transport Material Manufacturing Furniture; Other Manufacturing Industries Construction Motor Vehicles Sale and Repairs Wholesale Retail Hotel Industry Land, Water, Aire and Space Transport Transport-Related Activities Mail and Telecommunications Financial Intermediation Real Estate, Renting and Business Serv. Public Administration Education Sanitary and Veterinary, Social Services Associative Activities Leisure, Cultural and Sport Activities Various Personal Services Activities Domestic Personnel. Distribution Index 1997. 2004. 0.67 0.14 0.17 0.36 0.29 0.27 0.32 0,26 0,58 0.22 0.92 0.15 1.53 0.13 0.64 0.63 0.24 0.7 0.4 1.26 0.38 0.42 0.14 0.36 0.6 0.26 0.25 0.56 3.12 1.96 0.14 4.05. 6.25 1.61 2.68 3.64 3.05 4.36 3.07 1,51 1,01 3.57 2.7 1.84 1.00 0.92 3.15 7.09 1.73 2.59 2.13 8.29 2.19 2.15 3.25 0.73 3.01 0.25 0.98 1.63 0.76 3.13 4.23 25.63. Concentration Index 1997. 2004. 7.63 0.14 0.14 1.6 0.36 0.84 1.01 0,32 0,96 0.61 3.34 0.3 2.65 0.39 1.48 9.82 0.88 4.4 6.33 12.06 2.32 0.49 0.25 1.51 5.83 2.69 2.3 5.11 2.14 5.68 0.24 16.15. 7.8 0.18 0.24 2.37 0.4 1.41 1.57 0,31 0,24 1.62 1.8 0.57 0.25 0.43 1.02 21.87 0.97 2.43 5.51 13.43 2.05 0.49 1.21 0.43 6.74 0.42 1.47 2.61 0.09 1.54 1.38 17.14. Source: Own elaboration from EPA data. Second quarters.. 9. For the distribution index, boxes in bold correspond to the activity sectors dominated by native-born workers; grey-shaded boxes indicate those activity sectors dominated by foreign-born workers; and the rest refers to integrated activity sectors with respect to the proportion of foreign- and native-born workers. For the concentration indexes, grey-shaded boxes correspond to the highest concentrations of immigrants.. Institute of Social and Economic Analysis Working paper 05/2006 , 33 pages, ISSN: 1139-6148. 18.
(19) The impact of economic immigration on labour opportunities of native born workers: The spanish case. TABLE 2. Distribution and concentration indices for immigrant and national employment by occupaton. Vertical viewpoint. Percentages10. Occupations Top Management and Public Administration Trade Companies Management <10 Wage Earn. Hotels and Rest. Management <10 Wage Earn. Other Companies Management < 10 Wage Earn. Companies Management w/o Wage Earn. 2-3 Cycle Chem., Physics, Maths Professionals 2-3 Cycle Natural Sc. And Health Professionals 2-3 Cycle Qualif. Teaching-Related Jobs Social Sciences Professionals Other 2-3 Cycle Qualif. Related Jobs 1 Cycle Professionals. Sciences 1 Cycle Professionals. Teaching and Others Support Techn. and Professionals Natural Sc., Health and Chile Education Techn. Financ. And Comm. Op. Support Professionals Admin.. Management Support Professionals Other Support Techn. and Professionals Non Public-Related Administrative Personnel Public-Related Administrative Personnel Catering Services Workers Personal and Protection Services Workers Shop Assistans and Similar Jobs Agricult. Qualified Workers Stockbr. Qualified Workers Other Farming Workers Construction Managers and Other Managers Construction-Related Workers Construction-Finish Workers Extractive Ind. Workers. Metal and Similar Metal and Div. Arts Precision Technicians Food and Tobacco Industry Workers Wood, Cabinetmaking, Leather and Textile Workers Industrial Instal. Workers, Machinery Machinery Drivers and Operators Trade Non-Qualified Workers Domestic Personnel, Industrial Cleaning Other Services Workers Primary Act. Workers Construction Workers Manufacturing Workers Transport and Unloading. Distribution Index 1997 0.32 0.33 1.1 0.1 0.3 3.7 1.65 0.22 0.95 1.72 0.17 0.17 0.09 0.13 0.59 0.23 2.38 0.43 0.28 1.46 0.27 0.47 0.24 0.4 0.07 0.84 0.78 0.82 0.46 0.13 0.67 0.61 0.22 0.4 2.56 1.79 0.23 2.24 0.64 0.75 0.89. 2004 0.42 1.55 2.22 1.25 1.62 2.63 2.27 0.54 0.69 4.24 0.22 0.59 2.44 1.45 1.28 0.8 1.94 0.49 1.51 9.53 3.61 1.87 2.4 2.29 1.67 1.88 7.81 5.03 2.73 2.98 4.01 3.67 2.63 2.34 8.37 13.68 5.3 16.76 14.6 5.71 4.24. Concentration Index 1997. 2004. 1.03 0.51 0.97 0.17 1.76 4.64 3.42 0.76 2.33 1.26 0.55 0.79 0.25 0.13 2.43 1.04 2.8 4 1.88 8.26 2.14 3.57 1.03 0.97 0.14 0.44 5.05 4.11 3.93 0.19 1.28 1.56 1.77 3.23 2.53 17.02 0.24 6.51 1.74 2.12 1.45. Source: Own elaboration from EPA data. Second quarters.. 10. The same considerations as in the previous table.. Institute of Social and Economic Analysis Working paper 05/2006 , 33 pages, ISSN: 1139-6148. 19. 0.24 0.34 0.31 0.42 1.08 0.91 0.82 0.33 0.36 0.81 0.13 0.43 1.29 0.31 0.97 0.82 0.45 0.58 1.75 10.02 4.89 2.47 1.21 0.51 0.27 0.21 9.22 4.59 3.64 0.54 1.24 1.09 3.12 3.09 0.99 21.71 0.87 6.61 7.38 2.52 1.39.
(20) The impact of economic immigration on labour opportunities of native born workers: The spanish case. From a vertical viewpoint (table 2) we can also observe how immigrant workers have very little presence in the structure of occupations. In 2004, just 9 out of 41 (22 percent) of all occupations showed an overrepresentation of immigrant workers (six non-qualified occupations, two construction-related occupations and a medium-qualified services occupation). Integrated occupations are scarce (5 out of 41, namely 12 percent of the whole structure), while occupations where the nativeborn workforce is overly represented as regards to its weight within the total employment are the most frequent (27 out of 41, namely 66 percent). The employment distribution for immigrants in the occupation structure shows a high level of concentration (three occupations are enough to aggregate 40 percent of collective employment). And finally, a high and increasing dissimilarity index is obtained over time: 0.35 in 1997 and 0.39 in 2004. In 2004, almost 40 percent of foreign- or native-born workers would have to change location in the occupation structure in order to observe similar standards for both groups. Therefore, it appears that groups of forieng- and native-born workers differ substantially depending on their category of labour position, taken into consideration both horizontally and vertically. In our opinion, this result and the supporting information are an important indication that both groups can only compete for the same jobs to a limited extent.. 4.2 Immigration Workers.. and. Labour. Opportunities. of. Native-Born. With the aim of establishing the relationship between the immigration rate and the labour opportunities of native-born workers, we have made two estimates. Contrast models are specified in the following equations, differentiated depending on the dependent variable to be considered alternately: the employment or unemployment rate:. ⎛ yijet ⎞ ⎟ = θ pijet + di + dj + de + dt + (di *dj ) + (di *de ) + (di *dt ) log ⎜ ⎜ (1- y ) ⎟ ijet ⎠ ⎝ + (dj *de ) + (dj *dt ) + (de *dt ) + ψijet. (4). ⎛ uijet ⎞ ⎟ = θ pijet + di + dj + de + dt + (di *dj ) + (di *de ) + (di *dt ) log ⎜ ⎜ (1- u ) ⎟ ijet ⎠ ⎝ + (dj *de ) + (dj *dt ) + (de *dt ) + ψijet. (5). Institute of Social and Economic Analysis Working paper 05/2006 , 33 pages, ISSN: 1139-6148. 20.
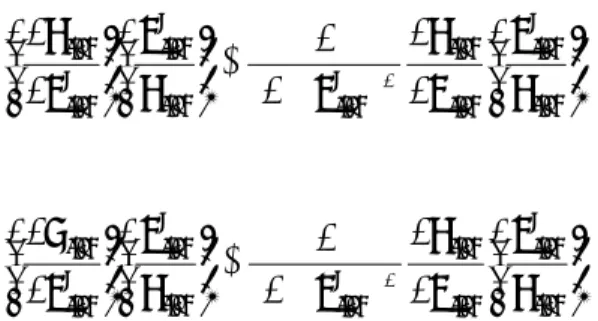
(21) The impact of economic immigration on labour opportunities of native born workers: The spanish case. In both cases, we impose a logistic transformation to improve the estimate. Moreover, we have included dummy vectors (d) in the labour characteristics considered and crossed vectors on such dummys by way of fixed effects. The previous model has been estimated using OLS data weighted by the origin population. The models have been estimated separately for men and women, given their different behaviour in the labour market. Following the criteria established by Borjas (2003), and in order to facilitate the interpretation of the results, these have also been expressed in terms of elasticity. Firstly, in line with Carrasco et al, 2004 we consider the average elasticity and secondly, we provide the elasticity weighted by the importance of the population they refer to. To calculate the elasticity, we have taken the following variable into consideration:. p ´ijet = M ijet /N ijet Thus, by means of this new variable we can estimate the elasticity as follows:. ⎛ ∂y ijet ⎜ ⎜ ∂p ´ ⎝ ijet. ⎞⎛ p ´ijet ⎟⎜ ⎟⎜ y ijet ⎠⎝. ⎞ ∂y ijet 1 ⎟= ⎟ (1 + p ´ ) 2 ∂p ijet ijet ⎠. ⎛ p ´ijet ⎜ ⎜ y ijet ⎝. ⎞ ⎟ ⎟ ⎠. ⎛ ∂u ijet ⎜ ⎜ ∂p ´ ⎝ ijet. ⎞⎛ p ´ijet ⎟⎜ ⎟⎜ y ijet ⎠⎝. ⎞ ∂y ijet 1 ⎟= ´ 2 ⎟ (1 + p ) ∂p ijet ijet ⎠. ⎛ p ´ijet ⎜ ⎜ y ijet ⎝. ⎞ ⎟ ⎟ ⎠. The proposed elasticity over the impact of immigration inflows shows or measures the direction and intensity of the alterations in employment or unemployment rates in the host country concerning changes in the amounts of immigrants over nationals or, in other words, the increase of an immigrant presence among nationals. Table 3 contains the results obtained from the estimate by Ordinary Least Squares concerning the effect of variation of immigrant percentage over the employment rate of native-born workers, classified into “skill groups”, built according to the aforementioned criteria– equation (4) –.. Institute of Social and Economic Analysis Working paper 05/2006 , 33 pages, ISSN: 1139-6148. 21.
(22) The impact of economic immigration on labour opportunities of native born workers: The spanish case. TABLE 3. Estimate by OLS of the impact of immigration on the labour opportunities of native-born workers. Dependent variable: log (yijte/(1- yijte)). Coeff.. Std. Err.. P>| t |. Boxes. Populationa. Elasticity (average). Elastity (weighted average)b. TOTAL. -2.797. 1.295. 0.031. 511. 281.59. - 0.17. - 0.11. Men. -0.564*. 1.4170. 0.690. 509. 164.21. -. -. -3.396. 1.212. 0.005. 495. 117.60. -0.31. -0.19. Women. Estimate period: 1997-2004 * Not significant under a confidence interval of 95%. a. Average population used during the years considered. Thousand people. b. Total population, total men and total women weighted.. According to the results obtained from this first estimate in terms of its coeficients and the corresponding elasticity, the increase of the immigrant population − given the existing occupational structure, the current education levels and the employment history among the population − has a negative effect on the employment rate of nativeborn workers. However, such an effect is of a reduced intensity, given that it takes place over the dependent variables transformation and not directly over the employment rate. This fact is more obvious in the case of elasticity where considerably reduced coefficients are achieved, even when the representative nature of the studied population is taken into consideration (average elasticity weighted by the population). We can also observe how the magnitude of the reduction undergone by the employment rate is notably higher in the case of women, as compared to the results obtained for men11. This therefore leads to the suggestion that the immigrant workforce behaves to a larger extent as a substitutive productive factor when taking into consideration the female workforce, a point which is highly relevant to our studies12. Although this is just an indication, this finding influences the undertaking of additional analyses towards a more robust verification. These results are situated, not only for their nature, but also for their magnitude, in the same line as those reached by the above-mentioned previous works (Carrasco et al, 2004), although the effect now concluded is slightly more reduced.. 11. Even in the case of men, the estimate is not statistically significant at 95 percent. 12 This result could be interpreted in the sense that women become secondary workforce in the labour market, as well as the immigrant labour supply, as Piore (1979) stated.. Institute of Social and Economic Analysis Working paper 05/2006 , 33 pages, ISSN: 1139-6148. 22.
(23) The impact of economic immigration on labour opportunities of native born workers: The spanish case. The following table 4 shows the results obtained in the alternative estimate, when labour opportunities of native-born workers approach each other by means of the variation experienced by its unemployment rates. As expected, the results are now the opposite. The increase of the immigrant weight, again in terms of coefficients and the elasticity obtained– given the existing occupational structure, the current education levels and the professional experience among the population − has a positive effect on the unemployment rate of native-born workers. This result is of a magnitude notably higher than the one obtained in the previous model. Therefore, we can conclude that the effect induced by the immigrants implies the expulsion from the employment (measured by the unemployment rate) rather than the expulsion from the labour market (included in the calculation of the employment rate). As immigrants compete with nationals for jobs, they do not expel the latter towards inactivity, but towards unemployment. At the same time, no inhibiting effect would be introduced on the decisions regarding labour participation of nationals. Now, the effects are more important when the estimate is restricted to men than when restricted to women in terms of coefficients and average elasticity. However, when the importance of the female population is taken into consideration (weighted average elasticity), we can see that the immigration effects are also very important within this group. TABLE 4. Estimate by OLS of the impact of immigration on the labour opportunities of native-born workers. Dependent variable: log (uijte /(1- uijte)). Coeff.. Std. Err.. P>| t |. Boxes. Populationa. Elasticity (average). Elasticity (weighted average)b. TOTAL. 14.189. 1.868. 0.000. 497. 289.77. 0.96. 1.54. Men. 17.450. 1.939. 0.000. 490. 170.85. 1.04. 1.12. 8.606. 1.717. 0.000. 456. 131.05. 0.65. 1.58. Women. Estimate period: 1997-2004 * Not significant under a confidence interval of 95%. a. Average population used during the years considered. Thousand people. b. Total population, total men and total women weighted.. In our opinion, the conclusion reached in the first model, when estimated for men and women individually, opens a very interesting path for future research, in the sense that it is possible that the foreignborn workforce competes with the native-born population, although not with respect to all kinds of jobs, but just in a segment characterised by certain qualitative aspects. The competition between nationals and. Institute of Social and Economic Analysis Working paper 05/2006 , 33 pages, ISSN: 1139-6148. 23.
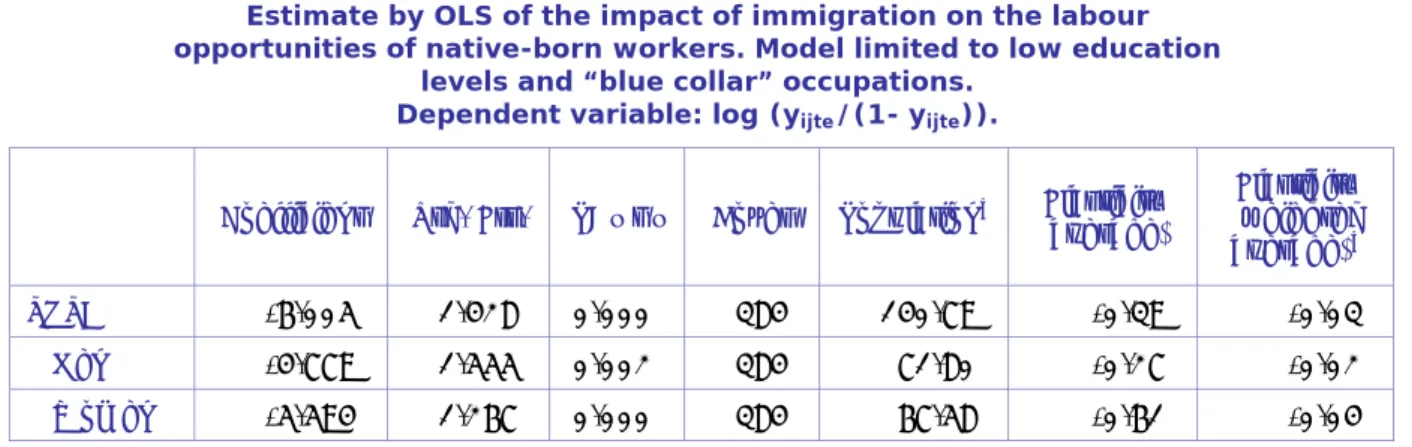
(24) The impact of economic immigration on labour opportunities of native born workers: The spanish case. immigrants will qualifications13.. probably. be. restricted. to. jobs. requiring. fewer. In order to start researching in this line, we have again estimated the previous models, but have redefined some categories of the variables used as criteria to construct the “skill groups”. More specifically, we limit the content of the education variable to the lowest educational levels (No education, compulsory and secondary) and the occupation variable to those implying manual tasks (blue collar), regardless of the qualification level (BCHS and BCLS)14. This way, we aim to find out whether the immigration effects are of a higher magnitude for this specific type of qualifying positions: people who perform manual work and whose education level is low. Table 5 (when the dependent variable corresponds to the employment rate) and table 6 (when the applicable variable is the unemployment rate) show the results of the estimate redefined as mentioned. In the case of employment rate, the coefficients and elasticity are seen to increase by a substantial amount, proving that the competition between the national and immigrant populations for the jobs is more intense at these levels. TABLE 5. Estimate by OLS of the impact of immigration on the labour opportunities of native-born workers. Model limited to low education levels and “blue collar” occupations. Dependent variable: log (yijte/(1- yijte)).. Coefficient. Std. Err.. P>| t |. Boxes. Populationa. Elasticity (average). Elasticity (weighted average)b. TOTAL. -6.005. 1.428. 0.000. 384. 140.79. -0.39. -0.03. Men. -4.779. 1.555. 0.002. 384. 71.80. -0.27. -0.02. Women. -5.594. 1.267. 0.000. 384. 67.58. -0.61. -0.04. Estimate period: 1997-2004 * Not significant under a confidence interval of 95%. a. Average population used during the years considered. Thousand people. b. Total population, total men and total women weighted.. 13. Given, on the one hand, the qualificative profile of the immigrant population living in Spain, and on the other, the aforementioned thought that only the labour qualifications acquired by immigrants in Spain are relevant for the purposes of our labour market. 14 In any event, it is worth mentioning that the criteria of the CNO-94 (National Classification of Occupations), the level and content of the characteristic qualifications of manual work refer to the knowledge of processes, tools, materials, etc. more than to other more general elements (educational credentials).. Institute of Social and Economic Analysis Working paper 05/2006 , 33 pages, ISSN: 1139-6148. 24.
(25) The impact of economic immigration on labour opportunities of native born workers: The spanish case. TABLE 6. Estimate by OLS of the impact of immigration on the labour opportunities of native-born workers. M Model limited to low education levels and “blue collar” occupations. Dependent variable: log (uijte /(1- uijte)).. Coefficient. Std. Err.. P>| t |. Boxes. Populationa. Elasticity (average). Elasticity (weighted average. TOTAL. 14.168. 2.167. 0.000. 383. 144.88. 1.181. 2.476. Men. 17.203. 2.214. 0.000. 379. 73.88. 1.239. 1.791. 9.520. 1.946. 0.000. 357. 69.59. 0.893. 2.499. Women. Estimate period: 1997-2004 * Not significant under a confidence interval of 95%. a. Average population used during the years considered. Thousand people. b. Total population, total men and total women weighted.. In contrast, the results obtained when the dependent variable is the unemployment rate are similar to the ones obtained before. There is just a slight fall in the case of women. In all respects, in the last two models (those restricted to people with low labour qualifications) the significance of the models increases, which is an indication that with this specification, the models measure correlations that are statistically clearer.. 5. CONCLUDING REMARKS. I. n this work, we have tried to find out whether the immigrant population is a substitutive productive factor with respect to the national workforce, competing for the same jobs. Generally speaking, it is to measure to what extent foreign-born workers are being responsible for the change taking place in the labour conditions of native-born workers. In order to do so, we have developed two complementary analyses. First, we have established the places (activity sectors and occupations) where nationals and immigrants are located within the labour market. The aim was to determine whether both groups share horizontal and vertical guidelines of labour locations, giving a response to the intuitive idea that similar location guidelines are required so that native- and foreign-born workers compete for the same jobs. Following this, and according to the most recent methodological proposals, we made a series of econometric estimates in order to establish whether the immigrant population is really affecting the labour opportunities of the. Institute of Social and Economic Analysis Working paper 05/2006 , 33 pages, ISSN: 1139-6148. 25.
(26) The impact of economic immigration on labour opportunities of native born workers: The spanish case. national population and, when appropriate, what is the nature and intensity of this effect. The results obtained regarding both questions can be concluded as follows: a) Immigrants and nationals differ notably in the positions held within the structure of the activity sectors and occupations, which limits the possibilities that both groups will compete for the same jobs. b) From both perspectives, we can observe how immigrants have reached just a moderate penetration level in the labour market. The most frequent situation is that the immigrant workforce is underrepresented not only as regards to sectors, but also to occupations. c) More specifically, the immigrant presence is quite important in the sectors of Agriculture, Construction, Hotel Industry and Home Services, and also in jobs requiring fewer qualifications. d) The previous guidelines are given specific representation in segregation indicators of 0.35 in the case of sectors, and 0.39 in the case of occupations. e) The proportional increase of the immigrant workforce over the total is connected to negative effects, although quite moderate, on the labour conditions of native-born workers. f). These are more important in terms of an increase in the unemployment rate than regarding the decrease of employment rates.. g) They also seem to be more intense for women than for men, which is clearly shown by the elasticity obtained in the previous section. h) The importance of the effects increases when we restrict the analysis to the sector of the labour requiring fewer qualifications. Our opinion is that results achieved from both analyses (the situation of native- and foreign-born workers in different sectors and occupations on one side, and on the other, the very moderate effects induced by increase of the immigrant rate over the national employment and unemployment population), must be understood reciprocally, so that the second results can be founded on a good explanatory basis of the first oned. All in all, it seems that the arrival of immigrants into our labour market is causing very limited effects, taking into consideration their magnitude, on the labour conditions of native-born workers. A profound study into this conclusion is still pending in order to discover the reasons behind the results. The location of the immigrant workforce preferably in. Institute of Social and Economic Analysis Working paper 05/2006 , 33 pages, ISSN: 1139-6148. 26.
(27) The impact of economic immigration on labour opportunities of native born workers: The spanish case. positions created as a consequence of their arrival and the existence of a deep segmentation in the labour market also taking into consideration the nationality of the workers are, from a personal point of view, two interesting hypotheses which amply justify the continuation of the analysis started.. Institute of Social and Economic Analysis Working paper 05/2006 , 33 pages, ISSN: 1139-6148. 27.
(28) The impact of economic immigration on labour opportunities of native born workers: The spanish case. 6. REFERENCES ABOWD, JM. Y FREEMAN, R.B. (1991). Inmigration, Trade and Labour Market. Chicago University Press. ALTONJI, J. Y CARDS, D. (1991). “The Effects of Immigration on the Labor Market Outcomes of Less-Skilled Natives”. En J.M. Abowd y R.. Freeman (eds.). Inmigration, Trade and the Labor Market. Chicago University Press. Chicago. ANGRIST, J. Y KUGLER, A. (2003). “Productive or Counter-Productive: Labour Market Institutions and the Effect of Immigration on EU natives”. Economic Journal (forthcoming) BORJAS, G. (1994). “The Economic of Inmigration”. Journal of Economic Literature, vol. XXXII, December, 1667-1717. BORJAS, G. (1999). “The Economics Analysis of Inmigration”. En O. Ashenfelter y D. Card (eds.). Handbook of Labour Economics. Volume 3A. Norh Holland. BORJAS, G. (2003). “The Labour Demand Curve is downward sloping: Reexamining the impact of inmigration on the labour market”. The Quarterly Journal of Economics. Vol. 118. Nº 4, 1335-1374. BORJAS, G.J., FREEMAN, R.B. Y KATZ, L.F. (1996). “Searching for the Effect of Inmigration on the Labour Market”. American Economic Review, 86, 246-257. CARRASCO, C. (1998). Mercados de Trabajo: Los inmigrantes económicos. Tesis doctoral. Dpto. de Fundamentos para el Análisis Económico. University of Alcalá. CARRASCO, C. (2002). “El impacto económico de la inmigración: incorporación al mercado de trabajo formal e informal”. En La Inmigración: Una realidad en España. Seminario de Investigación para la Paz. CARRASCO, R., JIMENO, JF. ORTEGA, AC. (2004). “The Effect of Immigration on the Employment Opportunities of Native-Born Workers: Some Evidence for Spain”. Fedea Working Paper. October, 2004. CUADRADO, JR., IGLESIAS, C. Y LLORENTE, R. (2005). Inmigración y mercado de trabajo: Análisis de algunas cuestiones fundamentales. Memoria de Investigación. Fundación BBVA. Madrid. DOLADO, JJ. (2002). “Los nuevos fenómenos migratorios: Retos y Políticas”. En T. García-Milá (ed.). Las nuevas fronteras de la Política Económica en España. CREI. Universidad Pompeu Fabra. DOLADO, JJ., JIMENO, JF. Y DUCE, R. (1997). “Los efectos de la inmigración sobre la demanda relativa de trabajo cualificado vs. poco cualificado: evidencia para España”. Cuadernos Económicos ICE, 63, 11-30.. Institute of Social and Economic Analysis Working paper 05/2006 , 33 pages, ISSN: 1139-6148. 28.
(29) The impact of economic immigration on labour opportunities of native born workers: The spanish case. DUCAN, O. Y DUNCAN, B. (1955). “A Methodological Análisis of Segregation Indices”. American Sociological Review, 20,200-217. FRIEDBERG, R. (2001). “The Impact of Mass Migration on the Israeli Labor Market”. Quarterly Journal of Economics. CXVI, 1373-1408. FRIEDBERG, RM. Y HUNT, J. (1995). “The Impact of Immigrants on Host Country Wages, Employment and Growth”. The Journal of Economic Perspectives, 9, 2, 23-44. HAKIM, C. (1993). “Segregated and Integrated Occupations: A New Approach to Analysing Social Change”. European Sociological Review, 9, 3 (December), 289-314. HAZARI, B.R. Y SGRO, P.M. (2001). Migration, Unemployment and Trade. Kluwer Academic Publisher. IZQUIERDO, A. (DIR.). Inmigración: Mercado de trabajo y protección social en España. Consejo Económico y Social. Madrid. JACOBS, JA. (1993). “Theoretical and Measurement Issues in the Study of Sex Segregation in the Workplace: Research Note”. European Sociological Review, 9, 3 (December), 325-330. OCDE (2001). Perspectivas del empleo 2001. OCDE. París. SCHOENI, R. (1997). “The Effects of Immigrants on the Employment and Wages of Native Workers: Evidence from the 1970s and 1980s”. RAND Corporation. March. STARK, O. (1991). The Migration of Labour. Cambridge. Mass. Blackwells.. Institute of Social and Economic Analysis Working paper 05/2006 , 33 pages, ISSN: 1139-6148. 29.
(30) The impact of economic immigration on labour opportunities of native born workers: The spanish case. APPENDIX: LABOUR CHARACTERISTICS OF NATIVE- AND FOREIGN-BORN POPULATION LIVING IN SPAIN. TABLE A.1. Characteristics of working-age immigrant and national population, and level of incidence15. Immigrants. Nationals. Incidence. 1997 2001 2004 1997 2001 2004 1997 2001 2004 Sex Men. 47.5. 49.4. 49.4. 48.4. 49.0. 48.5. 0.98. 1.01. 1.02. Women. 52.5. 50.6. 50.6. 51.6. 51.0. 51.5. 1.02. 0.99. 0.98. Single. 32.2. 37.0. 35.7. 31.9. 31.4. 30.7. 1.01. 1.18. 1.16. Married. 59.2. 56.2. 57.4. 58.3. 58.4. 58.6. 1.01. 0.96. 0.98. 8.6. 6.7. 6.9. 9.8. 10.2. 10.7. 0.88. 0.66. 0.64. Reference person. 36.0. 29.0. 38.5. 38.0. 33.6. 41.6. 0.95. 0.86. 0.93. Civil Status. Other Family status Spouse. 31.9. 24.3. 30.8. 28.1. 24.1. 29.2. 1.14. 1.01. 1.05. Son/daughter. 13.0. 22.6. 8.9. 28.0. 36.9. 24.3. 0.47. 0.61. 0.37. Other. 19.0. 24.0. 21.7. 5.9. 5.4. 4.9. 3.24. 4.44. 4.47. 16-24 years. 16.5. 14.4. 15.5. 18.6. 12.8. 13.2. 0.89. 1.12. 1.18. 25-34 years. 31.5. 32.5. 41.7. 17.0. 16.8. 19.5. 1.85. 1.93. 2.15. 35-49 years. 34.3. 29.0. 34.0. 24.0. 21.5. 26.7. 1.43. 1.35. 1.27. 50-64 years. 9.4. 6.7. 6.8. 20.3. 16.1. 19.9. 0.46. 0.42. 0.34. 65 years and over. 8.4. 17.4. 2.0. 20.1. 32.8. 20.8. 0.42. 0.53. 0.09. No Education. 10.6. 9.9. 8.1. 17.4. 15.8. 11.8. 0.61. 0.63. 0.68. Primary. 38.4. 18.4. 19.7. 52.5. 26.2. 25.8. 0.73. 0.70. 0.76. Secondary. 28.6. 52.9. 55.7. 19.9. 45.3. 48.1. 1.43. 1.17. 1.16. University. 22.4. 18.8. 16.6. 10.1. 12.7. 14.3. 2.21. 1.48. 1.16. 3.4. 26.0. 10.2. 1-4 years. 34.1. 41.9. 62.0. 5-9 years. 37.2. 15.5. 16.1. 10-14 years. 10.6. 10.4. 8.4. 15 years and over. 14.7. 6.2. 3.3. Age. Education Level. Period of residence Less than 1 year. Source: Second quarters of the re-weighted Active Population Survey (EPA). 15. The level of incidente is defined as the frequence of inmigrants over frequence of nationals.. Institute of Social and Economic Analysis Working paper 05/2006 , 33 pages, ISSN: 1139-6148. 30.
(31) The impact of economic immigration on labour opportunities of native born workers: The spanish case. TABLE A.2. Relationship of working-age immigrant population and national population with the labour market, and level of incidence. Immigrants. Nationals. Incidence. 1997. 2001. 2004. 1997. 2001. 2004. 1997. 2001. 2004. 51.2. 66.3. 67.5. 39.4. 47.6. 49.0. 1.30. 1.39. 1.38. 1.5. 2.3. 2.0. 2.4. 1.0. 0.8. 0.62. 2.40. 2.38. Unemployed w. experience. 11.7. 9.2. 9.4. 8.0. 4.5. 5.1. 1.46. 2.05. 1.85. Inactive. 35.6. 22.2. 21.1. 50.1. 46.8. 45.1. 0.71. 0.47. 0.47. Activity rate. 64.4. 77.8. 78.9. 49.9. 53.1. 54.9. Employment rate. 51.2. 66.3. 67.5. 39.4. 47.6. 49.0. Unemployment rate. 20.4. 14.8. 14.5. 20.9. 10.3. 10.8. Employed Unemployed w/o experience. Source: Second quarters of the re-weighted Active Population Survey (EPA). TABLE A.3. Characteristics of immigrant unemployed population and national unemployed population, and level of incidence. Immigrants. Nationals. Incidence. 1997. 2001. 2004. 1997. 2001. 2004. 1997. 2001. 2004. Men. 52.0. 52.2. 48.6. 47.8. 42.8. 42.6. 1.09. 1.22. 1.14. Women. 48.0. 47.8. 51.4. 52.2. 57.2. 57.4. 0.92. 0.84. 0.89. 16-24 years. 17.2. 27.1. 19.2. 30.7. 26.3. 23.7. 0.56. 1.03. 0.81. 25-34 years. 39.4. 47.0. 43.0. 32.0. 34.5. 32.7. 1.23. 1.36. 1.31. 35-49 years. 34.0. 20.9. 31.4. 26.3. 27.9. 31.1. 1.29. 0.75. 1.01. 50-64 years. 8.4. 4.9. 6.4. 10.9. 11.2. 12.5. 0.77. 0.44. 0.51. 65 years and over. 1.0. 0.0. 0.0. 0.0. 0.1. 0.1. 25.24. 0.00. 0.00. 5.9. 7.6. 9.6. 7.6. 6.6. 4.4. 0.78. 1.15. 2.19. Primary. 38.6. 17.7. 15.8. 56.9. 18.7. 17.7. 0.68. 0.95. 0.89. Secondary. 30.2. 54.9. 56.5. 24.6. 60.9. 63.9. 1.23. 0.90. 0.88. University. 25.2. 19.8. 18.1. 10.9. 13.8. 14.0. 2.31. 1.43. 1.29. Sex. Age. Education Level No Education. Source: Second quarters of the re-weighted Active Population Survey (EPA).. Institute of Social and Economic Analysis Working paper 05/2006 , 33 pages, ISSN: 1139-6148. 31.
(32) The impact of economic immigration on labour opportunities of native born workers: The spanish case. TABLE A.4. Characteristics of immigrant employed population and national employed population, and level of incidence. Immigrants. Nationals. Incidence. 1997. 2001. 2004. 1997. 2001. 2004. 1997. 2001. 2004. 62.9. 58.9. 58.7. 64.8. 63.1. 61.0. 0.97. 0.93. 0.96. Women Age 16-24 years. 37.1. 41.1. 41.3. 35.2. 36.9. 39.0. 1.05. 1.11. 1.06. 10.1. 13.0. 11.0. 12.6. 11.7. 9.9. 0.80. 1.12. 1.11. 25-34 years. 35.2. 39.5. 43.9. 26.7. 30.4. 29.8. 1.32. 1.30. 1.48. 35-49 years. 42.5. 40.4. 38.3. 38.7. 38.2. 39.6. 1.10. 1.06. 0.97. 50-64 years. 12.0. 6.9. 6.5. 21.3. 19.1. 20.1. 0.57. 0.36. 0.32. 0.1. 0.2. 0.3. 0.8. 0.7. 0.7. 0.17. 0.26. 0.46. 10.4. 7.8. 5.5. 6.2. 4.5. 2.6. 1.68. 1.72. 2.11. Primary. 37.5. 18.8. 19.5. 53.3. 19.5. 16.2. 0.70. 0.96. 1.20. Secondary. 26.5. 51.9. 58.3. 23.5. 56.3. 59.0. 1.13. 0.92. 0.99. 25.7. 21.6. 16.7. 17.0. 19.7. 22.1. 1.51. 1.10. 0.75. 5.8. 3.7. 1.6. 5.2. 5.5. 5.7. 1.11. 0.67. 0.29. Sex Men. 65 years and over Education Level No Education. University Professional Status Employers Freelancers. 14.9. 7.1. 5.5. 15.8. 12.8. 11.8. 0.94. 0.56. 0.46. 1.8. 2.1. 0.6. 3.1. 1.9. 1.5. 0.58. 1.12. 0.39. 77.6. 87.1. 92.3. 75.9. 79.9. 81.0. 1.02. 1.09. 1.14. Agriculture. 7.2. 10.5. 8.0. 8.3. 6.4. 5.2. 0.86. 1.64. 1.53. Heavy Industry. 8.3. 4.8. 5.4. 10.7. 11.4. 10.7. 0.77. 0.42. 0.51. Light Industry. 5.0. 5.5. 6.8. 9.3. 8.8. 7.7. 0.54. 0.63. 0.88. Family Aid Wage Earners Activity Sector. Building. 9.6. 15.7. 21.9. 9.9. 11.6. 11.7. 0.97. 1.35. 1.87. Commerce. 11.7. 12.8. 8.9. 16.7. 16.0. 16.3. 0.70. 0.80. 0.54. Hotel and catering. 12.4. 15.5. 13.4. 6.1. 5.9. 6.0. 2.03. 2.62. 2.23. Home services. 17.2. 20.6. 18.5. 3.6. 3.6. 3.3. 4.77. 5.72. 5.60. Other services. 28.7. 14.5. 17.0. 35.3. 36.2. 39.0. 0.81. 0.40. 0.44. Non-manual, qualified. 25.6. 14.1. 10.1. 28.6. 30.1. 32.5. 0.89. 0.47. 0.31. Non-manual, non-qualified. 20.2. 23.6. 19.7. 23.8. 23.8. 24.2. 0.85. 0.99. 0.82. Manual, qualified. 19.1. 18.9. 25.2. 27.5. 26.5. 24.4. 0.69. 0.71. 1.03. Manual, non-qualified. 35.2. 43.5. 45.0. 20.0. 19.5. 19.0. 1.76. 2.23. 2.37. Less than 20 hours. 4.5. 3.1. 5.4. 3.3. 3.1. 2.9. 1.37. 1.02. 1.84. 20-29 hours. 6.8. 5.6. 6.5. 4.7. 4.7. 5.2. 1.46. 1.17. 1.25. Occupation. Working Time. 30-39 hours. 7.8. 7.7. 6.1. 14.0. 14.6. 15.9. 0.56. 0.53. 0.38. 40-49 hours. 65.7. 66.3. 68.4. 65.4. 65.4. 64.6. 1.00. 1.01. 1.06. 50 hours and over. 15.2. 17.3. 13.6. 12.7. 12.1. 11.3. 1.20. 1.42. 1.20. Source: Second quarters of the re-weighted Active Population Survey (EPA).. Institute of Social and Economic Analysis Working paper 05/2006 , 33 pages, ISSN: 1139-6148. 32.
(33) The impact of economic immigration on labour opportunities of native born workers: The spanish case. AUTHORS Carlos Iglesias Fernández Director of the Labour Market, Employment and Training Area (SERVILAB) and Senior Lecturer, Department of Applied Economics of the University of Alcala. His main research interests are the economic analysis of labour market, the female labour situation, regional economy, labour immigration, tertiarization and its implications to the labour market. (carlos.iglesias@uah.es) Raquel Llorente Heras Researcher in Labour Market, Employment and Training (SERVILAB). Her main research interests are the labour market, segregation of labour market, Regional and European labour markets, the migrations and its labour consequences. (raquel.llorente@uah.es). Institute of Social and Economic Analysis Working paper 05/2006 , 33 pages, ISSN: 1139-6148. 33.
(34)
Figure
Documento similar
Government policy varies between nations and this guidance sets out the need for balanced decision-making about ways of working, and the ongoing safety considerations
In this work, the Spanish labor market was analyzed through the labor force survey (EPA) from a gender perspective, demonstrating the existing inequalities at the labor level,
In a similar light to Chapter 1, Chapter 5 begins by highlighting the shortcomings of mainstream accounts concerning the origins and development of Catalan nationalism, and
In the previous sections we have shown how astronomical alignments and solar hierophanies – with a common interest in the solstices − were substantiated in the
These data clearly reveal a complex structure for Spanish CP both in root and embedded clauses: They involve sentences with more than one instance of a complementizer heading
Using data from the Spanish Labor Force Survey (1996-2004) provides evidence for the proportion of contracted work hours lost due to sickness absence, its evolution over time and
The broad “WHO-ICF” perspective on HrWB provided at Figure 1 has a significant implication also for HRQoL. The develop- ment of ICF and its conceptual approach has challenged to
We analysed the prevalence of gross (GH) and microscopic (mH) haematuria in 19,895 patients that underwent native renal biopsies from the Spanish Registry of Glomerulonephritis..
