SERIE DO C UM ENTO S DE TRA BA JO
No . 9 2
M a rzo 2 0 1 1
A SIMPLE TEST OF MOMENTUM IN FOREIGN
EXCHANGE MARKETS
A Simple Test of Momentum in Foreign
Exchange Markets
1
Andrés Felipe García-Suaza
2José E. Gómez González
3March 14, 2011
1Disclaimer: The …ndings, recommendations, interpretations and conclusions ex-pressed in this paper are those of the authors and not necessarily re‡ect the view of the the Banco de la Republica or its Board of Directors, or the Department of Economics of the Universidad del Rosario.
2Assistant Professor, Economics Department, Universidad del Rosario. Calle 14 #
4-69, Bogotá, Colombia. E-mail address: [email protected]
3Senior Research Economist, Banco de la República (Central Bank of Colombia).
Abstract
This study proposes a new method for testing for the presence of momentum in nominal exchange rates, using a probabilistic approach. We illustrate our method-ology estimating a binary response model using information on local currency / US dollar exchange rates of eight emerging economies. After controlling for im-portant variables a¤ecting the behavior of exchange rates in the short-run, we show evidence of exchange rate inertia; in other words, we …nd that exchange rate momentum is a common feature in this group of emerging economies, and thus foreign exchange traders participating in these markets are able to make excess returns by following technical analysis strategies. We …nd that the presence of momentum is asymmetric, being stronger in moments of currency depreciation than of appreciation. This behavior may be associated with central bank inter-vention.
JEL Classi…cation: G14; G15; C41
1
Introduction
The existence of momentum in spot exchange rates - and more generally in the short-term returns of …nancial assets - has been well established in the academic literature. While studying the hypothesis of foreign exchange markets e¢ciency, researchers have found that nominal exchange rates display behaviors akin to mean reversion and positive serial correlation (see, for instance, Levich (1989) and Taylor (1992)). Traders in the foreign exchange (fx herein) markets have widely exploited trading strategies that combine mean reversion and momentum1, such
as moving average rules, to generate excess returns over a buy-and-hold strategy2.
As documented by Taylor and Allen (1992), in the short-run traders are more likely to follow strategies based on technical analysis than to base their actions on the behavior of economic fundamentals. In fx markets, strategies based on tech-nical indicators are more likely to succeed because, as Meese and Rogo¤ (1983) show, while macroeconomic fundamentals have explanatory power for stock re-turns, they do not have it for nominal exchange rates. Additionally, economic fundamentals usually have a lower frequency of ‡uctuation than nominal exchange rates.
In order to have technical trading strategies that generate positive risk-adjusted returns in fx markets, it must be the case that these markets are not fully e¢-cient. If fx markets were totally e¢cient, currencies should ‡uctuate randomly after controlling for the relevant information set at all moments in time. However, there is vast evidence that shows that the random walk hypothesis does not pre-vail in fx markets (see, for example, LeBaron (1999) and Marsh (2000)). In other words, there is ample empirical evidence showing that currency price changes rep-resent more than random departures from previous prices, and therefore short-run exchange rate movements are at least partially predictable. There might be mul-tiple sources for market ine¢ciencies in exchange fx markets. However, the aca-demic literature has identi…ed two main sources: noise trading and central bank intervention (Okunev and White (2003)). The former states that noise traders, who make decisions based on the previous movements of the currencies, dominate
1Chiang and Jiang (1995) …nd that foreign exchange returns exhibit high positive
correla-tions in the short-run (momentum) and negative correlacorrela-tions in the long-run (mean revertion).
2Many studies have shown that simple moving average trading rules systematically beat a
fx markets. The latter posits that central banks, not interested in trading prof-its, intervene fx markets to dampen foreign exchange volatility and to ensure that currencies re‡ect their targeted values. Central bank intervention can thus gener-ate non-random exchange rgener-ate movements, and can even foster pro…table trading strategies which can be exploited by fx traders (Sweeny (1986) and Neely (1997)). Regardless of the source of market ine¢ciencies, economists and researchers in the …eld of behavioral …nance have shown that exchange rate and, more generally, stock momentum is consistent with psychological feedback mechanisms. When market participants observe a currency depreciating (appreciating) they assume it is more likely it will continue to depreciate (appreciate) in the short-run, and will therefore enter into the market in a kind of "bandwagon e¤ect" (Malkiel (2003)). Various studies have formally tested for the presence of momentum in exchange rates. Most tests employ the framework developed by Fama and French (1998), and examine sample autocorrelations of realized exchange rate returns to check whether or not the series present positive serial correlation. If return correlations are statistically equal to zero, then it is said that exchange rates follow a random walk process. In particular, a zero autocorrelation of exchange rate returns in-dicates that market participants respond only to news which, by de…nition, are unpredictable. Most of the tests estimate correlations in currency returns over di¤erent time horizons, employing the generalized method of moments (GMM) estimator to calculate the variance-covariance matrix with correction for serial correlation (see, for instance, Chiang and Jiang (1995)).
This study proposes a new method for testing for the presence of momentum in nominal exchange rates, using a probabilistic approach. We estimate a logit model using information on local currency / US dollar exchange rates of eight emerging economies3. After controlling for important variables a¤ecting the be-havior of exchange rates in the short-run, we show evidence of exchange rate in-ertia; in other words, we …nd that exchange rate momentum is a common feature in this group of emerging economies, and thus fx traders participating in these markets are able to make excess returns by following technical analysis strate-gies. We …nd that the presence of momentum is asymmetric. It is stronger during periods of exchange rate depreciation than during periods of exchange rate ap-preciation. This empirical regularity may obey to the "fear of ‡oating" in emerg-ing economies identi…ed by Calvo and Reinhart (2002), which has shown to be
asymmetric in periods of local currency appreciation and depreciation. In fact, as Levy-Yeyati and Sturzenegger (2007), and Pontines and Rajan (2010) show, emerging market economies are more sensitive to exchange rate appreciation than depreciation and therefore central bank authorities in these economies are more likely to intervene fx markets trying to depreciate their currencies.
The method proposed in this study allows to test for the exchange rate momen-tum hypothesis in a very simple way, which has not been proposed before in the academic literature. While existing studies of momentum follow a time-series ap-proach estimating the autocorrelation function and performing variance-ratio tests to contrast the white noise hypothesis on exchange rate returns, our methodology estimates the probability that exchange rate presents short-term memory. Our methodology has some advantages over the existing one, and its able to answer to interesting questions that cannot be answered when looking at sample autocorre-lation functions.
When autocorrelation functions are analyzed, researchers have to assume partic-ular parametric forms for volatility clusters. Therefore, test results are sensitive to the chosen parametric forms. It is not uncommon that results are not robust under di¤erent model speci…cations (see, for instance, Michello and Chowdhury (2009), and Pavlova and Parhizgari (2008)). The probabilistic approach for test-ing momentum proposed in this study is based on duration hazard analysis, and provides a very ‡exible framework which overcomes the problem of assuming a particular parametric form for volatility clusters. Our approach presents other ad-vantages, including the maximal use of existing data and the identi…cation of the likelihood of e¤ects at various exposure levels.
The model proposed here is able to provide answers to relevant questions such as: conditional on having observed an appreciation (depreciation) of today´s ex-change rate, what is the probability that tomorrow´s exex-change rate will continue to appreciate (depreciate) given the behavior of the economic fundamentals? Or, how do central bank interventions a¤ect the probability that the exchange rate continues to appreciate (depreciate) given the value of the control variables?
2
Description of the data
In this paper we study the existence of exchange rate momentum in a sample of eight emerging economies. One of the main sources of momentum in fx mar-kets identi…ed in the literature is central bank intervention (see, for instance, Okunev and White (2003), and Beine et al. (2006)). Recent studies have shown that central bank intervention is more e¤ective in emerging market economies (Canales-Kriljenko (2003)). We chose these particular list of eight countries due to three main reasons: i). there are particular case studies of the e¤ects of central bank intervention in fx markets for these countries (Tapia and Tokman (2004) for Chile; Guimaraes and Karacadag (2004) for Mexico and Turkey; Domac and Men-doza (2004) for Turkey; Neely (2001) for Brazil, Chile, Hong Kong, and Mexico; Echavarría et al. (2009) for Colombia; in addition, internal studies on the e¤ec-tiveness of exchange rate intervention have been developed for Peru and South Africa); ii). there is information on CDS and stock market indices for all of these countries since the beginning of the 2000s; and, iii). all of these countries follow similar exchange rate regimes, labeled as "managed ‡oating" by Reinhart and Ro-go¤ (2004).
Figure 1:Exchange rates in the eight emerging economies South American economies
1 .5 2 2 .5 3 3 .5 4 Lo ca l c ur re nc
y / US
D
01jan2001 01jul2003 01jan2006 01jul2008 01jan2011 Date (Days) Bra 4 00 5 00 6 00 7 00 8 00 Lo ca l c ur re nc
y / US
D
01jan2001 01jul2003 01jan2006 01jul2008 01jan2011 Date (Days) Chl 15 00 20 00 25 00 30 00 Lo ca l c ur re nc
y / US
D
01jan2001 01jul2003 01jan2006 01jul2008 01jan2011 Date (Days) Col 2 .6 2 .8 3 3 .2 3 .4 3 .6 Lo ca l c ur re nc
y / US
D
01jan2001 01jul2003 01jan2006 01jul2008 01jan2011 Date (Days)
Per
Figure 1:Exchange rates in the eight emerging economies Other emerging economies
7 .7 7. 75 7 .8 7. 85 Lo ca l c ur re nc
y / US
D
01jan2001 01jul2003 01jan2006 01jul2008 01jan2011 Date (Days) HK 8 10 12 14 16 Lo ca l c ur re nc
y / US
D
01jan2001 01jul2003 01jan2006 01jul2008 01jan2011 Date (Days) Mex 6 8 10 12 Lo ca l c ur re nc
y / US
D
01jan2001 01jul2003 01jan2006 01jul2008 01jan2011 Date (Days) Sur .5 1 1 .5 2 Lo ca l c ur re nc
y / US
D
01jan2001 01jul2003 01jan2006 01jul2008 01jan2011 Date (Days)
Tur
indices, CDS and VIX. Control variables are included to isolate momentum from common movements of exchange rates with these variables. Table 1 presents de-scriptive statistics of these variables by country. All sample means of exchange rate returns are negative as expected, except for Hong Kong, while larger return dispersions correspond to South Africa, Brazil, and Turkey. Note that uncondi-tionally the empirical probability of observing an increase in the exchange rate return is higher than observing a decrease for all countries except for Hong Kong.
Table 1: Descriptive statistics
Country
Exchange rate returns
Mean 25th pctile 75th pctile Std. Error Proportion of decreases in returns Brazil -0.00017 -0.00507 0.00440 0.00015 52.35
Chile -0.00013 -0.00323 0.00293 0.00009 51.30
Colombia -0.00010 -0.00250 0.00228 0.00009 51.17
Hong Kong 0.00001 -0.00006 0.00008 0.00000 49.00
Mexico -0.00002 -0.00284 0.00254 0.00008 51.76
Peru -0.00009 -0.00076 0.00060 0.00003 52.60
South Africa -0.00028 -0.00592 0.00520 0.00017 52.17
Turkey -0.00015 -0.00472 0.00382 0.00014 53.15
Country Stock market index returns
Mean 25th pctile 75th pctile Std. Error
Brazil 0.00055 -0.00920 0.01146 0.00038
Chile 0.00059 -0.00446 0.00607 0.00020
Colombia 0.00113 -0.00437 0.00763 0.00029
Hong Kong 0.00020 -0.00641 0.00766 0.00035
Mexico 0.00072 -0.00586 0.00779 0.00027
Peru 0.00120 -0.00485 0.00752 0.00031
South Africa 0.00054 -0.00654 0.00789 0.00026
Turkey 0.00070 -0.01006 0.01234 0.00042
Country CDS
Mean 25th pctile 75th pctile Std. Error
Brazil 517.395 123.300 621.170 14.263
Chile 65.647 21.333 81.995 1.272
Colombia 264.436 136.575 389.733 3.665
Hong Kong 21.430 10.250 40.771 0.526
Mexico 145.400 78.313 176.250 1.929
Peru 196.619 119.749 256.434 2.640
South Africa 142.264 61.816 189.167 1.802
3
Empirical strategy and results
The objective of this study is to provide a simple empirical test for the hypothesis of exchange rate momentum. Our approach consists in estimating a probabilistic model in which the dependent variable represents the probability that the sign of the exchange rate return in the current period is the negative of the sign of last period´s exchange rate return.
We propose the following statistical framework. Consider two possible states of the world: St = fu; dg; 8t (intuitively, obtaining a positive return (up) and ob-taining a negative return (down), respectively) where St represents the state at time t. The current state isu if the current exchange rate´s return is positive, and it isd when the current exchange rate´s return is negative. Let Yij;t be the probability of changing from state iat time t 1 to statej at time t, i.e.,
Yij;t= Pr (St=jjSt 1 =i) (1)
wherei; j =fu; dg:
In order to test the hypothesis of momentum, we introduce covariates by de…ning the following function4:
Yij;t= Pr (St=jjSt 1 =i; Xt; zt; ) = Ii;tF(Xt; zt; ) (2)
whereIi;t represents an indicator function, Xt is a vector of covariates at timet,
zt is a dummy variable that takes the value of 1 if the exchange rate return´s sign of the last period is di¤erent of the one of the current period, is a vector of pa-rameters, andF( )is a cumulative density function (cdf). The indicator function is speci…ed in three di¤erent ways. In the …rst speci…cation the indicator function takes on the value of 1 always. In the other two the indicator function is used to separate the cases in which the current returns of the exchange rate are positive or negative. We establish the last two speci…cations to test whether momentum acts asymmetrically depending on whether observed returns are positive or nega-tive.
Our interest lies in the sign and signi…cance of the parameter associated with zt. If the sign of this parameter is negative and statistically signi…cant it is
possi-4Using this framework we are able to estimate a transition matrix, following the
ble to argue that exchange rate exhibits short term persistence or momentum. In other words, the probability of observing a positive (negative) exchange rate re-turn today is higher if yesterday´s rere-turn was also positive (negative).
The Xt vector includes control variables such as Credit Default Swaps (CDS), stock market indices, and the Standard and Poor´s VIX, all of these in daily fre-quency. These covariates allow us to control for issues such as risk aversion and temporal changes in assets ´ value. It is possible to think that a variable like the stock market index might be determined at the same time of the dependent vari-able. In order to avoid the possible problem of simultaneity, we instrument this variable by lagging it one period and taking …rst di¤erences. Additionally, we looked at pairwise correlations between covariates and found that the sample cor-relation between CDS and stock market indices was very high for all the countries included in the sample. Thus, we decided to exclude CDS from the estimations to reduce the probability of having multicollinearity issues5.
In this framework, the functionF( )can be any cumulative density function. In our case we chose the logistic cdf6. Recognizing that providing evidence for just
one country, or for a list of countries by separate could lead us to weak evidence of momentum, we pooled the observations of the eight emerging countries7 in
a data set and de…ned seven country dummies, setting Brazil as the base cate-gory. In all our speci…cations we use a linear index function, i.e. F(Xc;t; zc;t; ) =
( 0+ 1zc;t+ 2V IXt+ 3ST OCKc;t+ P7
c=1 cIc), where represents the logistic
cdf,c indexes the country, ST OCKc;t holds for the stock market index of country
cat time t, Ic is an indicator function taking the value 1 for countrycand zero otherwise, and c is the parameter corresponding to the indicator function Ic. Table 2 presents the results of the logistic regression when all the data is used. Six models were estimated under this speci…cation, and di¤er depending in the included control variables. For instance, Model (1) includes only our interest vari-able, a constant term, and the seven country dummy variables, while Model (4) additionally includes VIX and STOCK. Models (5) and (6) are identical to Model
5By eliminating CDS from the estimations we were also able to increase the sample period,
because these indicator is available only from 2003 on for most of the countries, and in some cases we found many missing values.
6As a robustness check we also used a probit cdf but, as expected, our results remained the
same.
7We also used runned regressions separately for each country. In all of the cases the sign of
(4), except that instead of using STOCK as a control, they use two di¤erent
in-struments for this variable: its …rst lag (STOCK(-1)), and its return (D(Ln(STOCK)). Note that in all six models the coe¢cient corresponding to our variable of
[image:12.612.145.469.331.622.2]inter-est resulted negative and statistically signi…cant at conventional levels. Important to note, the magnitude of the coe¢cient in all the models is very similar, around -0.06. Thus, we …nd evidence of momentum in exchange rate for our sample of emerging market economies. Even though none of the control variables included in the di¤erent models resulted statistically signi…cant, their signs were the ex-pected ones; and additionally, all six models were globally signi…cant according to likelihood ratio tests. Finally, Hong Kong and Mexico seem to present lower momentum with respect to Brazil (the base category).
Table 2: Logit estimations of the model using all data
Variables (1) (2) (3) (4) (5) (6)
z -0.0601** -0.0607** -0.0601** -0.0608** -0.0598** -0.0614**
(0.028) (0.028) (0.028) (0.028) (0.028) (0.029)
VIX 0.0011 0.0010 0.0011 0.0011
(0.001) (0.001) (0.001) (0.001)
STOCK -0.0156 -0.0142
(0.021) (0.021)
STOCK (-1) -0.0214
(0.021)
D(Ln(STOCK)) 0.0040
(0.015)
CHILE -0.0524 -0.0943 -0.0524 -0.0905 -0.1083 -0.0509
(0.056) (0.080) (0.056) (0.080) (0.080) (0.056)
COLOMBIA -0.0449 -0.0783 -0.0449 -0.0756 -0.0670 -0.0317
(0.056) (0.068) (0.056) (0.068) (0.068) (0.058)
HONG KONG 0.2406*** 0.2306*** 0.2408*** 0.2317*** 0.2270*** 0.2409***
(0.057) (0.059) (0.057) (0.059) (0.059) (0.057)
MEXICO 0.1522*** 0.1415** 0.1522*** 0.1425** 0.1391** 0.1539***
(0.056) (0.058) (0.056) (0.058) (0.058) (0.056)
PERU -0.0315 -0.0590 -0.0318 -0.0568 -0.0696 -0.0319
(0.057) (0.068) (0.057) (0.068) (0.068) (0.057)
SOUTH AFRICA -0.0038 -0.0131 -0.0038 -0.0122 -0.0165 -0.0038
(0.056) (0.057) (0.056) (0.057) (0.057) (0.056)
TURKEY 0.0175 0.0251 0.0175 0.0254 0.0175 0.0319
(0.056) (0.057) (0.056) (0.057) (0.057) (0.057)
Constant 0.0117 0.1727 -0.0127 0.1356 0.2078 -0.0126
(0.042) (0.224) (0.052) (0.230) (0.226) (0.052)
Observations 20,118 19,907 20,118 19,907 19,899 19,698
LL nule -13944 -13798 -13944 -13798 -13792 -13653
LL model -13919 -13772 -13919 -13772 -13767 -13628
DF 8 9 9 10 10 10
CHI(2) 50.11 50.92 50.75 51.46 50.05 49.25
Robust standard errors in parentheses *** p<0.01, ** p<0.05, * p<0.1
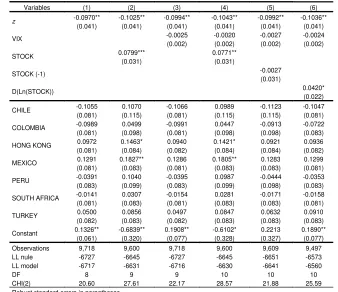
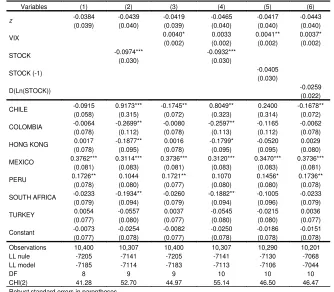
the estimations reported in Table 4 includes only cases in which they are nega-tive. Worthy to note, we …nd an asymmetric e¤ect of the previous behavior of the exchange rate´s return on the probability of obtaining gains (losses) in the current period. Conditional on having observed an exchange rate depreciation in the current period, it is more likely to observe an additional depreciation next pe-riod. Meanwhile, there is no statistical evidence in favor of inertia during times in which the exchange rate in appreciating. However, the sign of the coe¢cient of the variable of interest is also negative when periods of exchange rate appreciation are considered (see Table 4).
Table 3: Logit estimations of the model using positive returns
Variables (1) (2) (3) (4) (5) (6)
z -0.0970**(0.041) -0.1025**(0.041) -0.0994**(0.041) -0.1043**(0.041) -0.0992**(0.041) -0.1036**(0.041)
VIX -0.0025 -0.0020 -0.0027 -0.0024
(0.002) (0.002) (0.002) (0.002)
STOCK 0.0799*** 0.0771**
(0.031) (0.031)
STOCK (-1) -0.0027
(0.031)
D(Ln(STOCK)) 0.0420*
(0.022)
CHILE -0.1055 0.1070 -0.1066 0.0989 -0.1123 -0.1047
(0.081) (0.115) (0.081) (0.115) (0.115) (0.081)
COLOMBIA -0.0989 0.0499 -0.0991 0.0447 -0.0913 -0.0722
(0.081) (0.098) (0.081) (0.098) (0.098) (0.083)
HONG KONG 0.0972 0.1463* 0.0940 0.1421* 0.0921 0.0936
(0.081) (0.084) (0.082) (0.084) (0.084) (0.082)
MEXICO 0.1291 0.1827** 0.1286 0.1805** 0.1283 0.1299
(0.081) (0.083) (0.081) (0.083) (0.083) (0.081)
PERU -0.0391 0.1040 -0.0395 0.0987 -0.0444 -0.0353
(0.083) (0.099) (0.083) (0.099) (0.098) (0.083)
SOUTH AFRICA -0.0141 0.0307 -0.0154 0.0281 -0.0171 -0.0158
(0.081) (0.083) (0.081) (0.083) (0.083) (0.081)
TURKEY 0.0500 0.0856 0.0497 0.0847 0.0632 0.0910
(0.082) (0.083) (0.082) (0.083) (0.083) (0.083)
Constant 0.1326** -0.6839** 0.1908** -0.6102* 0.2213 0.1890**
(0.061) (0.320) (0.077) (0.328) (0.327) (0.077)
Observations 9,718 9,600 9,718 9,600 9,609 9,497
LL nule -6727 -6645 -6727 -6645 -6651 -6573
LL model -6717 -6631 -6716 -6630 -6641 -6560
DF 8 9 9 10 10 10
CHI(2) 20.60 27.61 22.17 28.57 21.88 25.59
Robust standard errors in parentheses *** p<0.01, ** p<0.05, * p<0.1
The observed asymmetric behavior may obey to the "fear of ‡oating" in emerging market economies. Empirical and case studies have shown that these economies are more sensitive to exchange rate appreciation8 than depreciation and therefore
deprecia-central bank authorities are more inclined to intervene fx markets during periods in which exchange rate appreciation is observed (see, for instance, Levy-Yeyati and Sturzenegger (2007), and Pontines and Rajan (2010)). Central bank interven-tion during periods of exchange rate appreciainterven-tion tends to generate short periods of currency reversion - i.e., short periods of exchange rate depreciation - which are exploited by traders who take short positions in dollars, leading to positive gains and further exchange rate depreciation for short periods of time.
Table 4: Logit estimations of the model using negative returns
Variables (1) (2) (3) (4) (5) (6)
z -0.0384 -0.0439 -0.0419 -0.0465 -0.0417 -0.0443
(0.039) (0.040) (0.039) (0.040) (0.040) (0.040)
VIX 0.0040* 0.0033 0.0041** 0.0037*
(0.002) (0.002) (0.002) (0.002)
STOCK -0.0974*** -0.0932***
(0.030) (0.030)
STOCK (-1) -0.0405
(0.030)
D(Ln(STOCK)) -0.0259
(0.022)
CHILE -0.0915 0.9173*** -0.1745** 0.8049** 0.2400 -0.1678**
(0.058) (0.315) (0.072) (0.323) (0.314) (0.072)
COLOMBIA -0.0064 -0.2699** -0.0080 -0.2597** -0.1165 -0.0062
(0.078) (0.112) (0.078) (0.113) (0.112) (0.078)
HONG KONG 0.0017 -0.1877** 0.0016 -0.1799* -0.0520 0.0029
(0.078) (0.095) (0.078) (0.095) (0.095) (0.080)
MEXICO 0.3762*** 0.3114*** 0.3736*** 0.3120*** 0.3470*** 0.3736***
(0.081) (0.083) (0.081) (0.083) (0.083) (0.081)
PERU 0.1726** 0.1044 0.1721** 0.1070 0.1456* 0.1736**
(0.078) (0.080) (0.077) (0.080) (0.080) (0.078)
SOUTH AFRICA -0.0233 -0.1934** -0.0260 -0.1882** -0.1005 -0.0233
(0.079) (0.094) (0.079) (0.094) (0.096) (0.079)
TURKEY 0.0054 -0.0557 0.0037 -0.0545 -0.0215 0.0036
(0.077) (0.080) (0.077) (0.080) (0.080) (0.077)
Constant -0.0073 -0.0254 -0.0082 -0.0250 -0.0186 -0.0151
(0.077) (0.078) (0.077) (0.078) (0.078) (0.078)
Observations 10,400 10,307 10,400 10,307 10,290 10,201
LL nule -7205 -7141 -7205 -7141 -7130 -7068
LL model -7185 -7114 -7183 -7113 -7106 -7044
DF 8 9 9 10 10 10
CHI(2) 41.28 52.70 44.97 55.14 46.50 46.47
Robust standard errors in parentheses *** p<0.01, ** p<0.05, * p<0.1
Finally, note that changes in the stock market index signi…cantly a¤ect the prob-ability of changing state both during periods of exchange rate appreciation and depreciation. The sign of the coe¢cient associated to this variable is the expected one. For example, during periods of exchange rate depreciation, an increase in the stock market index leads to a higher probability of changing state, i.e., of ob-serving an appreciation of the exchange rate. On the contrary, during periods of
exchange rate appreciation, an increase in the stock market index leads to a lower probability of changing state, in other words, excerpts additional pressure towards further exchange rate appreciation.
4
Concluding remarks
This study proposes a new method for testing for nominal exchange rate momen-tum using a probabilistic approach. Our methodology has some advantages over the existing ones - which are based on the study of sample autocorrelation func-tions -, including the maximal use of existing data and the identi…cation of the likelihood of e¤ects at various exposure levels.
We illustrate our methodology estimating a binary response model using infor-mation on local currency / US dollar exchange rates of eight emerging economies (Brazil, Chile, Colombia, Hong Kong, Mexico, Peru, South Africa, and Turkey), which were selected according to the following criteria: countries for which there exist particular case studies of the e¤ects of central bank intervention in foreign exchange markets, for which relevant information is available on a daily basis starting at the beginning of the 2000s, and which follow similar exchange rate regimes.
References
Balvers, R. and Y. Wu (2006): "Momentum and mean reversion accross national equity markets", Journal of Empirical Finance 13, 24 - 48.
Beine, M.; J. Lahaye; S. Laurent; C.J. Neely; and, F.C. Palm (2006): "Central bank intervention and exchange rate volatility, its continuous and jump com-ponents", Federal reserve Bank of St. Louis working paper No. 2006 - 031C. http://research.stlouisfed.org/wp/2006/2006-031.pdf
Calvo, G. and C.M. Reinhart (2002): “Fear of ‡oating”, Quarterly Journal of Economics 117, 379 - 408.
Canales-Kriljenko, J.I. (2003): "Foreign exchange intervention in developing and transition economies: results of a survey", IMF working paper No. 03/95. http://www.imf.org/external/pubs/cat/longres.cfm?sk=16514.0
Chiang, T. and C. Jiang (1995): "Foreign exchange returns over short and long horizons", International Review of Economics and Finance 4, 267 - 282.
Domac, I. and A. Mendoza (2004): "Is there room for foreign exchange in-terventions under an in‡ation targeting framework? Evidence from Mex-ico and Turkey", World Bank Policy Research working paper No. 3288. http://papers.ssrn.com/sol3/papers.cfm?abstract_id=610332
Echavarría, J.J.; D.M. Vásquez; and, M. Villamizar (2009): "Impacto de las intervenciones cambiarias sobre el nivel y la volatilidad de la tasa de cam-bio en Colombia", Borradores de Economia No. 561, Banco de la Republica. http://www.banrep.gov.co/docum/ftp/borra561.pdf
Fama, E. and K. French (1988): "“Market e¢ciency, long-term returns, and be-havioral …nance, "Journal of Financial Economics 49, 283 - 306.
Gómez-González, J.E.; P. Morales; F. Pineda; and, N. Zamudio (2009): "An alter-native methodology for estimating credit quality transition matrices", Journal of Risk Management in Financial Institutions 2, 353 - 364.
Guimaraes, R. and C. Karacadag (2004): "The empirics of foreign exchange in-tervention in emerging market economies: the cases of Mexico and Turkey", IMF working paper No. 04/123. http://repec.org/mmfc05/paper68.pdf
Jegadeesh, N. and S. Titman (2001): "Pro…tability of momentum strategies: an evaluation of alternative explanations", Journal of Finance 56, 699 - 720.
LeBaron, B. (1999): "Technical trading rule pro…tability and foreign exchange intervention", Journal of International Economics 49, 125 - 214.
Levich, R. (1989): "Is the foreign exchange market e¢cient?", Oxford Review of Economic Policy 5, 40 - 60.
Levy-Yeyati, E.L. and F. Sturzenegger (2007): “Fear of ‡oating in reverse: ex-change rate policy in the 2000s,” mimeo.
Malkiel, B.G. (2003): "The e¢cient market hypothesis and its critics", Journal of Economic Perspectives 17, 59 - 82.
Marsh, I.W. (2000): “High-frequency Markov switching models in the foreign ex-change market”,Journal of Forecasting 19, 123 -134.
Meese, R. and K. Rogo¤ (1983): "Empirical exchange rate models of the 70s: do they …t out of sample?", Journal of International Economics 14, 3 - 24.
Michello, F.A. and S.S.H Chowdhury (2009): "Momentum strategies: evidence from the Indian stock market", mimeo. http://frank.mtsu.edu/~ssc2q/Essay%201.pdf
Neely, C.J. (1997): "Technical analysis in the foreign exchange market: a lay-man´s guide", Federal Reserve Bank of St. Louis Review 79, 23 - 38.
Neely, C.J. (2001): "The practice of central bank intervention: looking under the hood", The Regional Economist, Federal Reserve Bank of St. Louis, 1 - 10.
Pavlova, I. and A. M. Parhizgari (2008): "International mo-mentum strategies:a genetic algorithm approach", mimeo.
http://69.175.2.130/~…nman/Reno/Papers/InternationalMomentumStrategiesGAApproach.pdf
Pontines, V. and R.S. Rajan (2008): “Foreign exchange market intervention and reserve accumulation in emerging Asia: is there evidence of fear of appreciation?", Economics Letters, article in press, doi:10.1016/j.econlet.2011.01.022.
Reinhart, C.M. and K. Rogo¤ (2004): "The modern history of exchange rate arrangements: a reinterpretation", Quarterly Journal of Economics 119, 1 - 48.
Sweeny, R. (1986): "Beating the foreign exchange market", Journal of Finance 41, 163 - 182.
Tapia, M. and A. PTokman (2004): "E¤ects of foreign exchange intervention un-der public information: the Chilean case", Economia 4, 1 -42.
Taylor (1992): "E¢ciency in the Yen futures market at the Chicago mercantile exchange", Rational Expectations and E¢ciency in Futures Markets. Routledge.