0186-1042/© Derechos Reservados © 2015 Universidad Nacional Autónoma de México, Facultad de Contaduría y Administración. Este es un artículo de acceso abierto distribuido bajo los términos de la Licencia Creative Commons CC BY-NC-ND 4.0.
www.contaduriayadministracionunam.mx
www.revistas.unam.mx/index.php/rca/
Contaduría y Administración 60 (2015) 367-388
Spanish credit institutions: do efficiency and
solvency support the first decisions on bank
restructuring from a financial point of view
2008-2012?
Entidades de crédito españolas: ¿eficiencia y solvencia
sustentan las primeras decisiones de reestructuración
2008-2012?
Salvador Marín Hernández*, Ester Gras Gil, Marcos Anton Renart
Universidad de Murcia, Facultad de Economía y Empresa, España
Received 12 June 2015; accepted 11 February 2015
Abstract
The restructuring processes of the Spanish financial entities over the last years has led us to ana-lyze financially how efficiency and solvency of banks and savings banks explain the decisions of incorporation and control of these entities. We analyze 51 Spanish financial entities for the period 2008-2012. The results show higher solvency and efficiency of banks over savings banks. On the other hand, after the first integrations it is observed that it is still early for these ratios to improve on the results obtained by the entities before the integrations. However, from the financial point of view, these integrations do explain how correct the start-up and intensification of the restructuring process-es were. There are some exceptions to the global criteria, which are explained by the size, strength and structure of the business and the closeness of its financial management scope to the area and business structure of the bigger banking groups.
All Rights Reserved © 2015 Universidad Nacional Autónoma de México, Facultad de Contaduría y Administración. This is an open access item distributed under the Creative Commons CC License BY-NC-ND 4.0.
Keywords: Restructuring; Financial system; Sistema institucional de protección; Efficiency; Solvency
* Corresponding author.
Resumen
Los procesos de reestructuración de las entidades de crédito españolas en estos últimos años nos han llevado a analizar en qué medida la eficiencia y solvencia de estos dos tipos de entidades explican las decisiones de integración y dominio de las mismas viéndolo, únicamente, desde un punto de vista de análisis financiero. Para ello analizamos 51 entidades españolas en el periodo 2008-2012. Los re-sultados muestran unos mayores valores de solvencia y eficiencia de los bancos sobre las cajas. Por otro lado, se observa que aún es pronto para que, tras las primeras integraciones, estos ratios superen los mejores valores a nivel individual. No obstante, sí que explican estas concentraciones, desde el punto de vista abordado, el financiero, lo acertado del inicio e intensificación en los procesos de reestructu-ración, así como las decisiones de forma societaria de la entidad dominante y/o resultante tras la inte-gración. Existe alguna excepción al criterio general aludido, siendo en tal caso explicada por el tamaño, fortaleza y estructura de negocio, más cercana en el campo de su gestión financiera al ámbito y estruc-tura de negocio de los grandes grupos bancarios.
Derechos reservados © 2015 Universidad Nacional Autónoma de México, Facultad de Contaduría y Administración. Este es un artículo de acceso abierto distribuido bajo los términos de la Licencia Creative Commons CC BY-NC-ND 4.0.
Palabras clave: Reestructuración; Sistema financiero; Sistema institucional de protección; Eficiencia; Solvencia
Introduction
In the summer of 2007 the “subprime mortgages” crisis started. These were a financial product whose risks were spread among various agents and markets through securitiza-tion and credit derivatives. At first, this situasecuritiza-tion did not affect the Spanish authorities di-rectly, but it was one of the triggers of a chain of effects in global economies and financial markets that soon, among other factors, would affect Spain.
Its immediate consequence was the deterioration of liquidity and funding, which drove several authorities to take support measures which had varying effects both over time and in inland areas of application.
In the case of Spain the passage from the crisis of the financial economy to the real economy took less than a year from the appearance of the first symptoms in North Ameri-ca.The Spanish economy fell into recession in late 2008. The fall in production and rising unemployment pushed up default rates of banks and savings banks and, consequently, the need for higher provisions of insolvency. Furthermore, there was an increase in financial costs brought about by the increasing reliance on wholesale funding and also by sudden difficulties in these markets. In addition, the slowdown in the housing market affected many entities that had a high concentration in the field of real estate development and construction (Aríztegui, 2011).
to be strengthened of those institutions that decide to undertake plans to improve their efficiency through mergers or other integration transactions.
Clearly by late 2011, and throughout 2012 and 2013, we were witnessing an intense re-organization process of territorial financial institutions (savings banks) which, forced by a series of regulatory rules, sought to strengthen the system and thus “solve the problems of liquidity, solvency and default of these entities” (Palomo, Sanchis-Palacio, & Gutiér-rez-Fernández, 2011).
Consequently, savings banksa are in particular the main figures in the restructuring
process. Their legislation reform involved significant changes in its legal form, with sev-eral variants. Thus, the adjustment to the declining demand gave rise to a situation of ex-cess capacity, leading to an urgent need to resize the sector (González Sánchez & García Muiña, 2011). All the savings banks, except Caixa Ontinyent and Pollensa, transferred their assets and liabilities to another entity regulated as commercial bank with the struc-ture of a public limited company, in which those saving banks which have not been na-tionalized or taken over are major shareholders.
These circumstances are of sufficient importance to merit research on whether these restructuring processes are improving the situation of the sector. We must point out that these restructuring processes are not unique of the Spanish Banking system. As we deep in the previous literature, we observe how these processes were carried out in other coun-tries, even when the intensity of the crisis was not as worldwide as now. In this sense, we noted that several studies addressed the impact of the reform of the financial systems in the sector from an international point of view. An example of this can be seen in Table 1, although some of the studies are not strictly comparable in terms of full homogeneity, not only for the political systems in the respective countries but also for the type of problems, as they provide information on the intended purpose of restructuring examples in the banking sector at some level.
After this review, we observed how after the restructuring process there are two vari-ables, efficiency and solvency, which in most cases improve considerably.
This paper aims to be the first in a series of observations over the next few years (until 2016 at least) and aims to ascertain, first which financial entities had higher efficiency and solvency values. It also seeks to discover whether the concentration decisions of the Span-ish banking sector followed the guidelines according to the values obtained by these two variables and according to previous experiences in other contexts. After that first goal, we thought it important to analyze the situation after the first integrations and to provide the methodology, with the values of the ratios indicated, for analysis in future years.
Therefore, for proper monitoring and analysis, this paper is structured in five sections. After the introduction, the second part provides a review of the development of those stan-dards affecting the banking sector during 2009-2013. The third section describes the sam-ple and presents the methodology and variables used in the analysis. Section 4 presents
Table 1
Reforms of the financial systems from an international point of view.
Country Year Effects Authors
Germany 1986-2001 Germany experiences one of the deepest consolidating processes, compared to USA, UK or Japan
Koetter, et al. (2004) 1993-2003 The success or not of the banking mergers which
mainly happened in the 90’s was an open debate One of the conclusions of this paper is that that entities arising from a merger are successful
Koetter (2005)
China 2003-… Because of the reform, the banking system achieved a homogeneous structure, not only in terms of profitability, efficiency and quality of the assets, but also in size and geographical location. The restructuring of the banking sector was a basic pillar in the reform process and was focused on improving the solvency of the main Chinese Banks.
García Herrero and Santabárbara García (2009)
Egypt 1992-2007 After analyzing the impact of the reform of the financial systems on the competitiveness and efficiency of the banking system and the impact on economic growth in the short and long term, the conclusion is that reforms have a positive and significant effect on competitiveness and efficiency of production
Poshakwale and Qian (2011)
United States 1990-2006 The number of banks in the United States fell by 32% between 1990 and 2006. In the mergers of "local" banks (community banks), the acquirers were more efficient and managed objectives better. These mergers led to the acquirer being stronger and more efficient and to better management of the bank
Jagtiani (2008)
Greece 2001-2009 Worsening of efficiency (2003-2009) and solvency (2001-2009) of the Greek financial sector
Martín de Vidales Carrasco (2010) Italy 1985-1996 After the mergers, there is no evidence of any
improvement in profits: the increase of the revenues (in the face of a wider market for services and increased lending) is offset by an increase in labour costs. However, it is shown that after the merger profitability increases
Focarelli, Panetta, and Salleo (2002)
1995-2000 The results suggest the existence of benefits in terms of efficiency, deriving from the banks' consolidation
Colombo and Turati (2004)
Japan 1990-2000 The restructuring of the financial system occurs in the 1990s. Though the loan losses were almost unanimously recognized as the origin of the fall of the Japanese banking system, it was not clear that they were the sole cause of the persistence of the crisis. Political responses highlighted the need to improve efficiency, especially, and drove more mergers
Country Year Effects Authors Jordan 1990-… The banking sector has witnessed significant
developments over the past two decades. Since 2003 there has been an unprecedented development in the work of banks in terms of quantity and quality. Moreover, the efficient functioning of the banking sector has become one of the main objectives of financial reforms. Profitability and efficiency also become one of the challenges faced by banks to strengthen their financial position to take on the risks associated with globalization
Ramadán, Kilani, and Kaddumi (2011)
Latinamerica 1993-2000 Analysis of eleven Latin American countries during a period characterized by significant restructuring reforms of their banking systems. A high degree of competition in banking is associated with reduced margins, low profitability and greater cost efficiency
Yildirim and Philippatos (2007)
Nordic Countries
1988-1990 In order to overcome the crisis, countries like Norway, Finland and Sweden opted for restructuring measures like mergers
Thorvald et al. (2004)
For the particular case of Norway, mergers of troubled banks with larger solvent banks were chosen 1985-1990 In the case of Finland, the overall efficiency analysis
shows that it is lower in merged banks than in non merged ones
Kuussaari (1993)
1964-1985 In Denmark and Finland, for example, mergers made the purchaser large enough to act independently abroad
Fagerland Jacobsen (1997) Portugal 1990-1995 Following the reform of the Portuguese banking
system from 1986, the efficiency of new domestic banks in a more competitive banking system is quantified
Canhoto and Dermine (2003)
South Africa 1999-2008 The analysis of the evolution of competition and efficiency of the banking sector shows a progressive decrease in the number of efficient banks. It also reflects the dominance of five major banks that together represent more than 85% of total bank assets
Mlambo and Ncube (2011)
Table 1 (continuation)
Country Year Effects Authors Turkey 2005-… Its banking system, once it had pulled through the
severe financial crisis of1999 to 2001, has in recent tax years shown adequate levels of solvency, profitability and efficiency
Calvo Bernardino and Martín de Vidales Carrasco (2010) Furthermore, the efficiency analysis reveals that
market share is the most important determinant of efficiency. This result supports the idea that banks benefit from economies of scale and as they increase their market share they will be better able to utilize their excess capacity
Ozdincer and Ozyildirim (2006)
Venezuela 1996-2001 Mergers that took place in the Venezuelan banking system sought to reduce processing costs, take advantage of economies of scale, strengthen net worth and technological and operational transactions with a view to increasing the profitability of their activities
Bracho, Ariza, González, and Jiménez (2002)
Source: own elaboration. Table 1 (continuation)
Reforms of the financial systems from an international point of view.
the findings and Section 5 analyzes the entities that were involved in any restructuring process. The paper ends with the main conclusions and lines for future research.
Literature review
At a European level, several studies analyze the significant impact degree that the Eco-nomic and Monetary Union (EMU) has on the competence of the banking sector in those countries which adopted the single currency (Bikker & Groeneveld, 2000; De Bandt & Davis, 2000); whether bank concentration in a national market has a negative impact on the financial solvency of European banks (Uhde & Heimeshoff, 2009) or the determinants of bank profitability in several European countries, and also that a higher degree of concentra-tion leads to a higher profitability (Molyneux & Thornton, 1992). In this sense, internaconcentra-tional comparisons of banking efficiency can be used to identify, among others, issues of interna-tional consolidation of the banking industry. González (2009) analyzes the influence of bank efficiency and policy variables on the market structure. Their results are consistent with the efficiency-structure hypothesis, which states that the most efficient banks have, on average, higher levels of domestic market that enhance market concentration.
2009a). However, in 2010, efficiency deteriorated. Bigger banks were more efficient than the industry average (Maudos, 2011). As for the differences between banks and savings banks, previous studies show how the savings banks are less efficient and solvent than banks. Fernández de Guevara (2007) analyzed the period 1992-2004 and Carbó and Mau-dos (2010) to December 2009. Climent (2013) analyzes the determinants of solvency of the Spanish financial institutions in the period 2006-2009, concluding that banks achieve better solvency than savings banks.
Other studies show how in banks and savings banks there is a significant positive cor-relation between measures of size, efficiency and financial profitability (Marín, Gómez, & Gómez, 2008) or Bernad, Fuentelsaz, & Gómez (2009), who claim that although it seems that mergers and acquisitions have sometimes been an effective way to deal with increased competition deriving from the new competitive environment, they do not al-ways manage to improve the results of the entities involved. Moreover, other studies like Fernández, Fonseca, and González (2006) find that banks take more risks than savings banks, and Fonseca and González (2005) state that as the political presence increases on savings banks, so does their risk, as they may take riskier investments in the pursuit of po-litical ends. The possibility of transferring funds in the commercial relationship between savings banks and regional governments can also favor risky investments, especially in saving banks with higher levels of public participation.
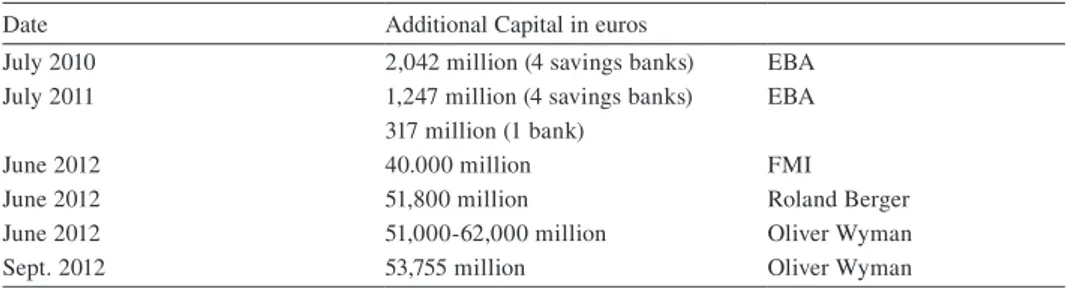
Elsewhere, the latest stress test published (September 2012) for a number of entities, shows this initial trend of solvency strength behind decisions made.
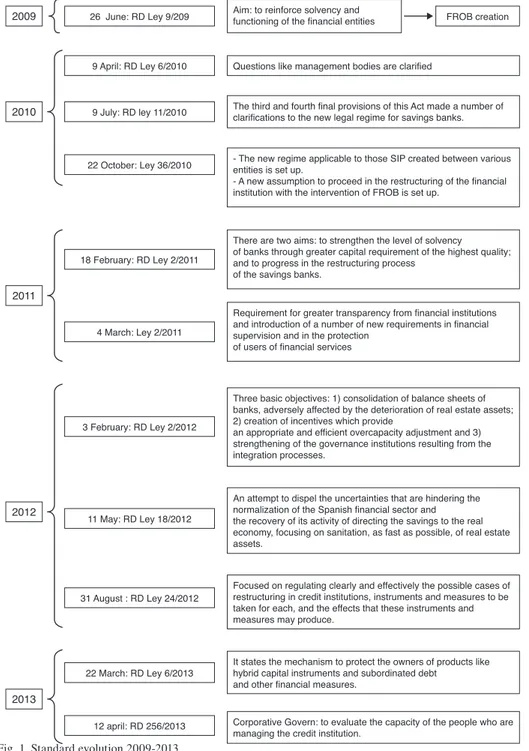
Regulatory developments 2009-2013
Apart from the legal aspects of the savings banks and their need to transform and up-date as a consequence of the necessary adaptation to European directives, (including the initial definition of the Fund for Restructuring and Banking management), we can state that it was not until late 2011, early 2012, when the standards, were issued (and measures of economic and financial policy), were clearly determined in Spain regarding restructur-ing and, especially, decreasrestructur-ing the debt of the financial system.
In this sense, we briefly show in Figure 1 synopsis and content of the standards and their evolution from 2009-2013.
As a result of all this legislation, several steps were taken to restructure the sector, as is shown in Table 2.
Without doubt, there will still be changes made in the last column, so it is important to note the content and results of the so-called stress test. The last one made in Spain points to a “clear exit point” from what we have commented on above in terms of future changes.
2009 26 June: RD Ley 9/209 Aim: to reinforce solvency and functioning of the financial entities FROB creation
2010
9 April: RD Ley 6/2010 Questions like management bodies are clarified
9 July: RD ley 11/2010 The third and fourth final provisions of this Act made a number of clarifications to the new legal regime for savings banks.
2011
18 February: RD Ley 2/2011
There are two aims: to strengthen the level of solvency of banks through greater capital requirement of the highest quality; and to progress in the restructuring process
of the savings banks.
4 March: Ley 2/2011
Requirement for greater transparency from financial institutions and introduction of a number of new requirements in financial supervision and in the protection
of users of financial services
2013
22 March: RD Ley 6/2013 It states the mechanism to protect the owners of products like hybrid capital instruments and subordinated debt and other financial measures.
12 april: RD 256/2013 Corporative Govern: to evaluate the capacity of the people who are managing the credit institution. 22 October: Ley 36/2010 - The new regime applicable to those SIP created between various entities is set up. - A new assumption to proceed in the restructuring of the financial institution with the intervention of FROB is set up.
2012
3 February: RD Ley 2/2012
Three basic objectives: 1) consolidation of balance sheets of banks, adversely affected by the deterioration of real estate assets; 2) creation of incentives which provide
an appropriate and efficient overcapacity adjustment and 3) strengthening of the governance institutions resulting from the integration processes.
11 May: RD Ley 18/2012
An attempt to dispel the uncertainties that are hindering the normalization of the Spanish financial sector and the recovery of its activity of directing the savings to the real economy, focusing on sanitation, as fast as possible, of real estate assets.
31 August : RD Ley 24/2012 Focused on regulating clearly and effectively the possible cases of restructuring in credit institutions, instruments and measures to be taken for each, and the effects that these instruments and measures may produce.
Table 2
Restructuring processof the spanish financial system.
2009 2010 2011 2012 2013
La Caixa
La Caixa La Caixa
Caixabank
Caixabank CaixaGirona
Caja Sol
CajaSol-Guadalajara
Banca Civica CajaGuadalajara
Caja Navarra
Banca Civica Caja Burgos
Caja Canarias
Banco de Valencia Banco de Valencia Banco de Valencia Banco de Valencia
BBVA BBVA BBVA
BBVA BBVA
Caixa Sabadell
Unnim Unnim
Caixa Terrasa Caixa de Manlleu
Banco Santander Banco Santander Banco Santander Banco Santander Banco Santander Caja Madrid
BFA-Bankia BFA-Bankia BFA-Bankia BFA-Bankia Bancaja
Insular de Canarias Caixa Laietana Caja de Avila Caja Segovia Caja Rioja Banco Sabadell
BancoSabadell
Banco Sabadell Banco Sabadell Banco Sabadell Banco Guipuzcoano
CAM CAM
Banco Popular Banco Popular BancoPopular
Banco Popular Banco Popular Banco Pastor Banco Pastor BancoPastor
Unicaja
Unicaja Unicaja
Unicaja Banco Unicaja Banco Caja Jaen
Caja Duero
Ceiss Ceiss
2009 2010 2011 2012 2013 Caixa Catalunya
Calaunya Caixa Catalunya Caixa Catalunya Caixa Catalunya Caixa Caixa Tarragona
CaixaManresa Caja Galicia
NovaGalicia Banco NovaGalicia Banco NovaGalicia Banco NovaGalicia Banco CaixaNova
BBK
BBK
Kutxa Bank Kutxa Bank Kutxa Bank Caja Sur
CajaVital CajaVital
Kutxa Kutxa
CajaMurcia
BancoMareNostrum BancoMareNostrum BancoMareNostrum BancoMareNostrum CaixaPenedes
Caja Granada Sa Nostra
IberCaja IberCaja IberCaja
IberCaja IberCaja
CAI CAI
Caja3 Caja Círculo Burgos Caja Círculo Burgos Caja Badajoz Caja Badajoz CajAstur + CCM CajAstur
Liberbank Liberbank Liberbank Caja Extremadura Caja Extremadura
Caja Cantabria Caja Cantabria
Bankinter Bankinter Bankinter Bankinter Bankinter
Source: own elaboration. Table 2 (continuation)
Restructuring processof the spanish financial system.
In Europe, the European Banking Authority (EBA) published the stress tests of the European Union for the years 2010 and 2011 and announced that it would not conduct new stress tests for 2012, with the next stress test for European banks to be in 2014. Nev-ertheless in Spain, in a clear attempt to be transparent, a series of additional stress test, in addition to the European ones, were made in 2012.
It is important to note that changes in the methodology, along with others in how results are presented, makes it difficult to compare results.
Sample, variables and method
Sample
Our study population comprises the Spanish credit institutions and, within them, the two main types of entities: banks and confederated saving banks. To accurately determine our initial sample (12/31/2008) we use, first, the information provided by the Spanish Banking Association (AEB), from which we selected the top 6 Spanish banks by asset volume. We also took information from the Spanish Confederation of Savings Banks (CECA), which records the existence of 45 savings banks. Therefore, the target population to analyze is set initially at 51 institutions (6 banks and 45 sav-ings banks).
The economic and financial information of the entities that was used to develop the empirical study was taken from the AEB and CECA websites and that concerning the stress test from the website of the Bank of Spain.
Table 4 shows in detail the evolution of the sample by years. We observed how from a total of 51 institutions in 2008 there are just 15 in 2012, because of the restructuring processes, which implied mergers, acquisitions and SIP.
Table 3
Stress test on the spanish banking sector.
Date Additional Capital in euros
July 2010 2,042 million (4 savings banks) EBA July 2011 1,247 million (4 savings banks) EBA
317 million (1 bank)
June 2012 40.000 million FMI
June 2012 51,800 million Roland Berger
June 2012 51,000-62,000 million Oliver Wyman
Sept. 2012 53,755 million Oliver Wyman
Source: own elaboration. Data taken from Bank of Spain website.
Table 4
Characteristics of the simple.
2008 2009 2010 2011 2012
Financial Institutions 51 51 37 19 15
Variables
a. Dependent variable
Taking into account that the main objective of our study is to determine, before and af-ter the restructuring of the Spanish credit institutions, the degree and distinction between efficiency and solvency, our dependent variables are:
• Efficiency Ratio (EFIC): this indicator measures which processing costs (salaries, technology, rent, supplies, administrative expenses, etc.) an entity must bear to get a regular unit margin (net financial interests plus mediation commissions). Therefore, an entity will be more efficient if it applies lower processing costs for each unit of gross income generated. The variable is calculated for each entity as Operating Expenses/Gross income. This indicates that the smaller the ratio, the greater the efficiency.
• Solvency ratio (SOLV): this shows the ability of the entity to pay debts with its own resources. The variable is calculated for each entity as Equity/Current Liabilities.
The higher this ratio, the higher the solvency.
b. Independent variable
To address the objective, we sought to combine simplicity (given the public financial data available) and clarity with proper intellectual rigor, so we have relied on an explana-tory variable and four more control variables:
1. Before/After restructuring (RESTR): we created a variable that classifies the sample before and after the restructuring. Given that these restructuring processes began in 2011 (annual accounts filed in 2012), we consider as before the years 2008-2010 and the subsequent ones as after the process.
Thus we have a dichotomous variable (RESTR) which takes the value 0 for the in-formation referred to 2008-2010 (“before restructuring”) and value 1 for the 2011-2012 information (“after restructuring”).
As for the control variables, first we added two variables that must be associated with levels of efficiency and solvency:
1. Stress Test (TEST). According to these tests, the need for additional capital of some entities could be related to our dependent variables, explaining that in more efficient and / or solvent institutions the need for capital requirements will be lower. This feature is shown with a numeric variable. As discussed above, the test included both a reference scenario and an adverse scenario. In order to calculate the Stress Test variable, we considered the adverse scenario for the whole bank (we analyzed banks on a whole. No branches).
Finally, we also included as control variables the size of the institutions and whether they are savings banks or banks in order to see if there is a differentiation between the two:
1. Banks or Savings Banks (B_S): Dummy variable that takes the value 1 if it is a Bank and 0 if it is a Savings Bank.
2. Size (SIZE) is measured by the logarithm of the value of assets in millions of euros.
Method
The analysis seeks to answer the question of whether the restructuring process of the banking sector followed the guidelines of efficiency and solvency of the sector. We use a multivariate model that allows us to verify the predictive capability of our previously defined explanatory variable, RESTRit, where each entity is i and year is t:
Xit=β0+β1*RESTRit+β2*B_Sit+β3*TESTit+β4*TIER1it+β5*SIZEit+ε
RESTR: Before or after the restructuring
B_S: Bank or Savings Bank
TEST: Additional capital requirement under the stress test
TIER1: Percentage of Tier1
SIZE: Logarithm of total assets
With this model we analyze the capacity of the explanatory variable to predict two ver-sions of the dependent variable, Xit, the efficiency (EFFICit), defined as the ratio between operating expenses and gross income, and solvency (SOLVit), defined as the ratio between equity and liabilities.
With the above model, we analyze the regression of two versions, depending on wheth-er the dependent variable is efficiency or solvency.
Results
In order to clarify the explanatory model, we show the Granger causality test.
Efficiency:
Variable definition:
• Y=EFFIC
• X1=RESTR Table 6
Correlation matrix.
Efficiency Solvency RESTR B_S TEST TIER
Solvency –0.300**
RESTR 0.405** 0.037
B_S –0.197* 0.337** 0.234**
TEST 0.194* –0.127 0.293** –0.032
TIER –0.446** 0.613** –0.345** –0.014 –0.347**
SIZE –0.131 0.091 0.475** 0.507** 0.178* –0.168
Source: own elaboration. * p<.05; ** p<.01. Table 5
Descriptive statistic of the sample divided in: before/after the restructuring.
B/A reestructur Variables N. Obs. Mean Standard Dev. 25th Perctl. Median 75th Perctl.
Total EFFIC 136 53.94 13.72 43.48 51.32 60.40
SOLV 136 7.29 2.57 5.78 7.10 8.86
TEST 136 414.78 2438.49 0.00 0.00 0.00
TIER 136 8.72 2.07 7.42 9.00 9.60
B_S 136 0.19 0.394 0.00 0.00 0.00
SIZE 136 7.47 0.62 7.05 7.42 7.84
Before EFFIC 102 50.02 11.31 41.03 49.42 55.83
SOLV 102 7.39 2.64 5.93 7.02 9.11
TEST 102 0.00 0.00 0.00 0.00 0.00
TIER 102 9.16 1.84 8.70 9.00 9.95
B_S 102 0.14 0.35 0.00 0.00 0.00
SIZE 102 7.31 0.58 6.96 7.23 7.56
After EFFIC 34 64.28 14.41 51.32 61.27 74.86
SOLV 34 7.05 2.43 5.13 7.59 8.25
TEST 34 1634,71 4680.86 0.00 0.00 562.5
TIER 34 7.58 2.23 6.4 7.4 9.1
B_S 34 0.32 0.48 0.00 0.00 0.00
SIZE 34 7.90 0.49 7.58 7.82 8.11
• X2=B_S
• X3=TEST
• X4=TIER
• X5=SIZE
Unrestricted model (U):
Y – β0 + β1 X1 + β2 X2 + β3 X3 + β4 X4 + β5 X5 + ε (1)
Restricted model (R):
Y – β0 + β2 X2 + β3 X3 + β4 X4 + β5, X5 + ε (2)
Hypothesis H0: β1=0
The test is performed by comparing the F statistic, given by:
(3)
Fort the analyzed case, we have:
m=1
n=134
k=6
On the other hand, the SSR are shown in the following tables,
Unrestricted model (U):
ANALYSIS OF VARIANCE
Degrees of freedom Sum of squared resid
Mean of squares F Critical value of F Regression 5 0.89315614 0.17863123 14.7771534 1.9739E-11
Residue 12 1.54730729 0.01208834
Total 13 2.44046343
Restricted model (R):
ANALYSIS OF VARIANCE
Degrees of freedom Sum of squared resid
Mean of squares F Critical value of F Regression 4 0.45432483 0.11358121 7.37711649 2.2072E-05
Residue 12 1.9861386 0.01539642
Then, by replacing the respective values in equation (3) we obtain:
F=36.30204>Fcritical=3.91514 (0.95 confidence level)
Therefore, we conclude that restructuring has an statistically significant effect on efficien-cy according to Granger.
Solvency:
Variable definition:
• Y=SOLV
• X1=RESTR
• X2=B_S
• X3=TEST
• X4=TIER
• X5=SIZE
And about SSR:
Unrestricted model (U):
ANALYSIS OF VARIANCE
Degrees of freedom Sum of squared resid
Mean of squares F Critical value of F Regression 5 0.01547688 0.00309538 4.41898521 0.00095671
Residue 12 0.08966043 0.00070047
Total 13 0.10513731
Restricted model (R):
ANALYSIS OF VARIANCE
Degrees of freedom Sum of squared resid
Mean of squares F Critical value of F Regression 4 0.01540783 0.00385196 5.53778365 0.00038038
Residue 12 0.08972948 0.00069558
Total 13 0.10513731
Then, by replacing the respective values in equation (3) we obtain:
Therefore, we conclude that restructuring has no effect on solvency according to Granger.
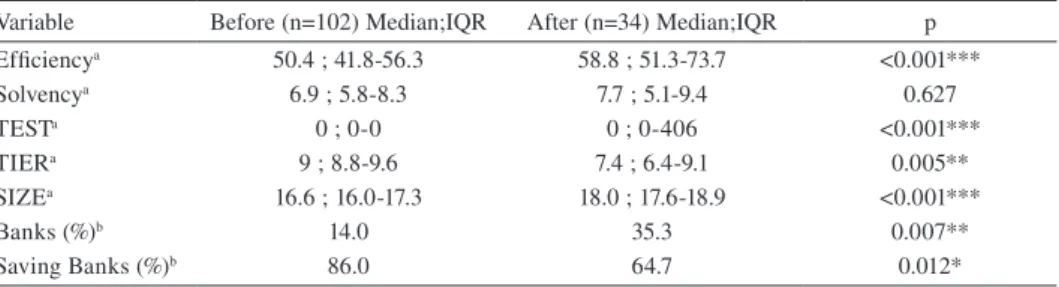
Table 7 provides the mean value of the main variables analyzed. It is calculated ac-cording to the RESTR variable. The value of the Mann Whitney and the associated sig-nificance level are also given.
The results show how the two variables present better values on simple average before the restructuring process than later, which is logical at this first stage. These differences are statistically significant for the EFFIC variable.
Table 8 shows the evolution of the two variables for the Spanish banking sector during the period 2008-2012. We note that until 2011, the two variables get worse, with efficiency being hit harder, rising from 50.01 in 2009 to 64.28 in 2011. However in 2012 there is a change of trend and both variables begin to improve. In both cases the financial decisions of integration taken could be the explanation.
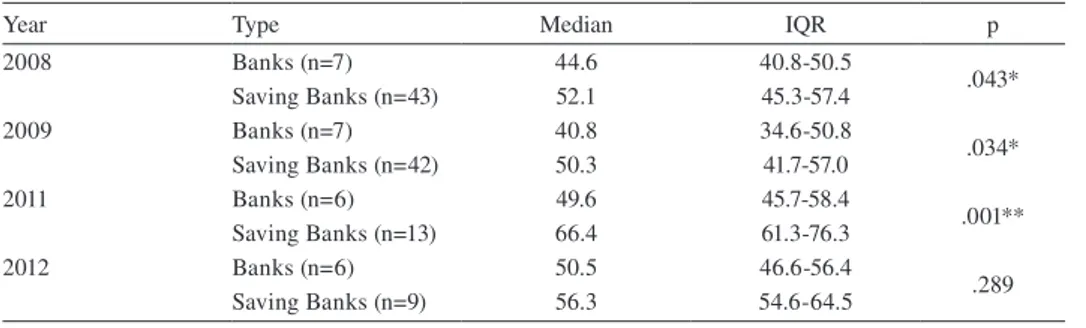
Tables 9 and 10 show the comparison, for each year, of efficiency and solvency for both Banks and Saving Banks. We must take into account that the restructuring process of the banking sector led to the grouping of savings banks in SIP that finally ended in the creation of banks. We must point out that those banks created through SIP among saving banks, were still included in the group of savings banks when presenting the data. This is because they originally came from savings banks and in the analysis period they are still in an initial process of restructuring.
Table 7
Comparison of means.
Variable Before (n=102) Median;IQR After (n=34) Median;IQR p Efficiencya 50.4 ; 41.8-56.3 58.8 ; 51.3-73.7 <0.001***
Solvencya 6.9 ; 5.8-8.3 7.7 ; 5.1-9.4 0.627
TESTa 0 ; 0-0 0 ; 0-406 <0.001***
TIERa 9 ; 8.8-9.6 7.4 ; 6.4-9.1 0.005**
SIZEa 16.6 ; 16.0-17.3 18.0 ; 17.6-18.9 <0.001***
Banks (%)b 14.0 35.3 0.007**
Saving Banks (%)b 86.0 64.7 0.012*
a Mann-Whitney U-test; b Chi Cuadrado test. * p<.05; ** p<.01;*** p<.001.
Table 8
Efficiency and solvency in the banking sector.
2008 2009 2010 2011 2012
Efficiency 50.53 50.01 56.45 64.28 59.44
Solvency 7.04 7.38 6.46 7.05 7.93
First, we note that the efficiency of banks is better than the savings banks. These dif-ferences are statistically significant for the years 2008, 2009 and 2011. Thus, our first research question, about efficiency, confirms as valid those financial policy decisions pro-posed as more efficient from the economic and financial point of view. That is, the legal transformation of the savings banks, their absorption by the banks and/or their integration to become banks.
Similarly, for solvency, it is observed how the solvency of banks is better than savings banks. These differences are statistically significant for the years 2009, 2011 y 2012. Therefore, the above comments for efficiency would be the same for solvency.
Analysis
Table 11 shows the results of regression models 1 and 2. The results obtained are en-tirely consistent with what was indicated in the descriptive analysis. For Model 1, where the dependent variable is efficiency, RESTR variable reflects a positive relationship in the Table 9
Efficiency. Banks-saving banks (Mann-Whitney U-test).
Year Type Median IQR p
2008 Banks (n=7) 44.6 40.8-50.5
.043* Saving Banks (n=43) 52.1 45.3-57.4
2009 Banks (n=7) 40.8 34.6-50.8
.034* Saving Banks (n=42) 50.3 41.7-57.0
2011 Banks (n=6) 49.6 45.7-58.4
.001** Saving Banks (n=13) 66.4 61.3-76.3
2012 Banks (n=6) 50.5 46.6-56.4
.289
Saving Banks (n=9) 56.3 54.6-64.5
*p<.05; **p<.01.
Table 10
Solvency. Banks-saving banks (Mann-Whitney U-test).
Year Type Median IQR p
2008 Banks (n=7) 7.6 6.9-8.2
.150
Saving Banks (n=43) 6.6 5.5-7.8
2009 Banks (n=7) 8.4 6.8-9.4
.037*
Saving Banks (n=42) 7.0 5.8-7.9
2011 Banks (n=6) 9.2 8.1-10.4
.004**
Saving Banks (n=13) 5.5 5.1-7.7
2012 Banks (n=6) 10.4 8.7-11.5
.012*
Saving Banks (n=9) 4.8 2.6-7.5
Table 11
Multiple linear regression models.
Model 1: EFFIC=β0+β1*RESTR+β2*B_S+β2*TEST+β2*TIER1+β2*SIZE+ε Model 2: SOLV=β0+β1*RESTR+β2*B_S+β2*TEST+β2*TIER1+β2*SIZE+ε
Predictors Efficiency Model (n=136) Solvency Model (n=136)
Beta (SE) P Beta (SE) p
RESTR 0.170 (0.031) <0.001*** 0.003 (0.035) 0.638
B_S –0.057(0.035) 0.107 0.016 (0.006) 0.017*
TEST 0.001(0.001) 0.314 0.001(0.001) 0.972
TIER –0.018 (0.006) 0.006** 0.007(0.001) <0.001***
SIZE –0.033(0.011) 0.003** 0.001(0.002) 0.692
R2 (%) 53.2 47.3
Model F(5;130)=13.89*** F(5;130)=11.13***
Assumptions
Normalitya p=0.185 p=0.200
Independenceb 1.872 1.977
Homoscedasticityc p=0.923 p=0.589
a Kolmogorov-Smirnov test for residuals values; b Durbin-Watson; c Levene test between residuals and
predicted values.
* p<.05; ** p<.01; *** p<.001.
coefficient and a statistically significant value. This positive relationship in the coefficients is just confirming that efficiency in the banking sector was, on average, better before the restructuring than later. This would be explained by the fact that the restructuring process which would bear fruit in subsequent years began in 2011. This shows that those with better efficiency and solvency are the ones which must offset the lower values of the rest, which explains the drop in average after the initial restructuring.
Meanwhile, variables SIZE and TIER reflect a negative relationship in the ratio and return statistically significant values. This negative relationship indicates that larger insti-tutions are more efficient than smaller ones. Also, entities with the highest percentage of Tier1 ratio have higher efficiency than those with the lowest percentage of Tier1.
As for model 2, where the dependent variable is solvency, results show that B_S and TIER variables reflect a positive relationship in the ratio and have statistically significant values. These positive relationships indicate that banks have better solvency ratio than savings banks and that those which show the highest percentage of Tier1 have higher solvency ratios.
Conclusions
dis-posal of the annual accounts after the application of 2011 and 2012 provides consistency to our study.
This paper, in its main research question and from the public financial data available, confirms that:
• Any transformation of savings banks into banks follows a logical criterion of financial policy. Solvency and efficiency values of the Banks are better than those of the savings banks. These differences increase over the period 2008-2012.
• These results confirm related previous studies such as Fernández de Guevara (2007); Carbó and Maudos (2010) and Climent (2013).
We confirm that these processes have not been yet fruitful in terms of the values ob-tained by the Spanish financial institutions in their ratios of efficiency and solvency but no doubt they will in the future, especially considering the legislative decisions taken in late 2011 and throughout 2012, and financial information containing the first financial statements published after restructuring.
Indeed, from the second analysis made, which is justified because of the data-set that it provides, which means we can carry through this investigation in the following years (2013-2016), we can conclude that:
• Opposite to the main question, the second one indicates that the efficiency and solven-cy of banks and savings banks was higher, in global, before the restructuring. This is explained by the short management time to enable improvements in efficiency and sol-vency. Also, the best entities absorb or integrate those which showed the worst indexes. According to previous studies cited, the improvements in efficiency in the restructuring processes require a clear legal framework; macroeconomic conditions and proper time to manage the new entities. This was started in late 2011 and continued decisively throughout 2012, so this variable will begin to improve results from 2013 and 2014, as was confirmed in previous studies of different countries and financial systems analyzed in this work.
• Nevertheless, in one of the new groups an improvement in solvency was observed. This is justified by the strengthening of own resources obtained via Government aid. Thus, it appears that this measure advocated by, among others things, the stress test, is very successful, either through diminished sale of risk, state capitalization or the market. In this regard, further evidence was obtained that the institutions with the highest efficiency are those that do not need additional capital according to the results of the stress test performed.
because previous literature confirms that restructuring should be done in a decisive and quick way, with regulatory intervention and keeping investors and several other agents in the process informed.
Regarding the future research lines, we understand the need to supervise the future development of both main variables analyzed (profitability and solvency). We would also like to check if, as we understand that it will happen, the evolution of both variables will still be positive and will increase when the restructuring processes come to an end.
References
Aríztegui, J. (2011). La crisis financiera y la reestructuración del sistema bancario español. Curso APIE-UIMP. Santander: Banco de España.
Álvarez, J.A. (2008). La banca española ante la actual crisis financiera. Estabilidad Financiera (15): 21-38. Bank of Spain. www.bde.es
Bernad, C., Fuentelsaz, L., & Gómez, J. (2009). El efecto del horizonte temporal en el resultado de las fusiones y adquisiciones: el caso de las cajas de ahorros españolas. Revista Europea de Dirección y Economía de la Empresa 18 (4): 49-68.
Bikker J.A. & Groeneveld, J.M. (2000). Competition and concentration in the EU banking Industry. Kredit und Kapital (33): 62-98.
Bou-Said, M.J. & Saucier, P. (2003). Liquidity, solvency, and efficiency? An empirical analysis of the Japanese banks’ distress. 20th Symposium on Banking and Monetary Economics. Birmingham, June 5-6. Bracho, Y., Ariza, B., González, M., & Jiménez, E. (2002). Fusiones bancarias en el sistema financiero
venezolano. Revista de Ciencias Sociales 2 (8): 300-311.
Calvo Bernardino, A. & Martín de Vidales Carrasco, I. (2010). El sistema bancario de Turquía. Boletín económico de ICE (2986): 35-44.
Canhoto, A. & Dermine, J. (2003). A note on banking efficiency in Portugal, new vs. old banks. Journal of Banking & Finance 27 (11): 2087-2098.
Carbó, S. & Maudos, J. (2010). Diez interrogantes del sector bancario español, Cuadernos de Información Económica (215): 89-105
Climent, S. (2013). La reestructuración del Sistema Bancario Español tras la crisis y la solvencia de las Entidades Financieras. Consecuencias para las Cajas de Ahorros. Revista española de Contabilidad 16 (2): 136-146.
Colombo, L. & Turati, G. (2004). The role of local real and financial variables in banking industry consolidation: the case of Italy. Working Paper 80. Department of Economics and Finance.
De Bandt, O. & Davis, E.P. (2000). Competition, contestability and market structure in European banking sectors on the eve of EMU. Journal of Banking & Finance 24 (6): 1045-1066.
Fagerland Jacobsen, S. (1997). The Norwegian banks in the nordic consortia: A case of international strategic alliances in banking. Working Paper. Wharton Institution.
Fernández, A.; Fonseca, A.R., & González, F. (2006). Forma jurídica de los intermediarios bancarios y asunción de riesgos. El caso de las cajas de ahorros españolas. Moneda y Crédito (223): 43-84.
Fernández de Guevara, J. (2007). La mejora de la productividad bancaria en España: crecimiento de la actividad y progreso técnico. Revista Valenciana de Economía y Hacienda (14): 51-84.
Focarelli, D., Panetta, F., & Salleo, C. (2002). Why do banks merge? Journal of Money, Credit and Banking
34 (4): 1047-1066.
Fonseca, A.R. & González, F. (2005). Cambios en el gobierno de las cajas de ahorros y nivel de riesgo. Efecto de las legislaciones autonómicas. Revista Española de Financiación y Contabilidad 34 (125): 395-422. García Herrero, A. & Santabárbara García, D. (2009). Una valoración de la reforma del sistema bancario chino.
González, F., (2009). Determinants of bank market structure: Efficiency and political economy variables.
Journal of Money, Credit and Banking 41 (4): 735-754.
González Sánchez, R. & García Muiña, F.E. (2011). La reestructuración del sistema bancario español y su gestión del conocimiento. Boletín económico de ICE (3012): 33-42.
Gujarati, D. (1997). Ecometría. La Habana: ENPES.
Jagtiani, J. (2008). Understanding the effects of the merger boom on community banks. Economic Review 93 (3): 28-48.
Koetter, M., Nestmann, T., Stolz, S., & Wedow, M. (2004). Structures and trends in German banking. Kieler Arbeitspapiere 1225.
Koetter, M. (2005). Evaluating the German Bank Merger Wave (March 2005). Tjalling C. Koopmanns
Discussion Paper 05-16. Available from: http://ssrn.com/abstract=726408 or http://dx.doi.org/10.2139/ ssrn.726408, 5/3/2014.
Kuussaari, H. (1993). Productive efficiency in Finnish Loca1 Banking during 1985-1990. Bank of Finland Discussion Paper 14/93. Finland: Bank of Finland.
Marín, S., Gómez, J., & Gómez, J.C. (2008). Técnica en el sistema bancario español. Dimensión y rentabilidad.
El Trimestre Económico 75 (300): 1017-1042.
Marquardt, D.W. (1970). Generalized inverses. Ridge regression, biased linear estimation, and non-linear estimation. Technometrics (12): 591-612.
Maudos, J. (2009ta). La banca española ante la crisis financiera. Revista de Economía de Castilla La Mancha
(14): 31-53.
Maudos, J. (2009b). El sector bancario español en el entorno de crisis financiera internacional. Economía Exterior (48): 56-66.
Maudos, J. (2011). El impacto de la crisis en los bancos españoles: 2007-2010. Cuadernos de Información Económica (222): 87-99.
Mlambo, K. & Ncube, M. (2011). Competition and efficiency in the banking sector in South Africa. African Development Review 23 (1): 4-15.
Molyneux, P. & Thornton, J. (1992). Determinants of European bank profitability: A note. Journal of Banking and Finance (16): 1173-1178.
Ozdincer, B. & Ozyildirim, C. (2006). Determining factors of bank performance based on return on solvency and efficiency: A study of Turkish banks. International Business & Economics Research Journal 5 (9): 29-43.
Palomo, R., Sanchis-Palacio, J.R., & Gutiérrez-Fernández, M. (2011). Efectos de la crisis financiera sobre la innovación en la reorganización de los sistemas bancarios: los sistemas institucionales de protección en las entidades financieras de ámbito territorial. Revista Innovar 21 (39): 179-190.
Poshakwale, S.S. & Qian, B. (2011). Competitiveness and efficiency of the banking sector and economic growth in Egypt. African Development Review 23 (1): 99-120.
Ramadán, I.Z., Kilani, Q.A., & Kaddumi, T.A. (2011). Determinants of bank profitability: evidence from Jordan. International Journal of Academic Research 3 (4): 43-57.
Thorvald, G.M., Solheim J.A., & Vale, B. (2004). The Norwegian bankingcrisis. Norges Bank, Occasional Papers.
Uhde, A. & Heimeshoff, U. (2009). Consolidation in banking and financial stability in Europe: empirical evidence. IWQW discussion paper series 02/2009. Alemania: Institut für Wirtschaftspolitik und Quantitative Wirtschaftsforschung.