© 2017 Universidad Nacional Autónoma de México, Centro de Ciencias de la Atmósfera. This is an open access article under the CC BY-NC License (http://creativecommons.org/licenses/by-nc/4.0/).
Carbon fluxes above a deciduous forest in Greece
Nikolaos PROUTSOS*, Αristotle LIAKATAS, Stavros ALEXANDRIS and Ioannis TSIROS
Agricultural University of Athens, 75 Iera Odos, 11855 Athens, Greece *Corresponding author; email: [email protected]
Received: December 8, 2016; accepted: June 26, 2017
RESUMEN
La producción fotosintética en ecosistemas forestales se lleva a cabo mediante la absorción de luz y CO2.
El presente estudio analiza las densidades de los flujos de carbono y CO2 sobre un bosque caducifolio en
Grecia, que es el sitio de monitoreo más meridional de Europa. Los resultados muestran una absorción anual
neta de carbono de 7.6 t C ha–1 y–1, lo cual indica que este bosque es un sumidero de carbono importante
en comparación con otros bosques europeos. Sin embargo, la absorción puede reducirse 1 μmol m–2 s–1 por
cada 1.5 ºC de aumento de la temperatura del aire por encima de la cobertura forestal, o con una reducción
de la humedad en la zona de las raíces de 0.015 cm3 cm–3 por debajo de los valores óptimos estimados. El
bosque actúa como sumidero de carbono desde finales de abril hasta principios de noviembre y como fuente
de carbono durante el resto del año. La mayor absorción neta de CO2 ocurre durante el periodo junio-julio
(estimada aproximadamente en 200 g C m–2 mes–1).
ΑBSTRACT
Photosynthetic production in forest ecosystems occurs through the absorption of light and CO2. The present
work deals with CO2 and carbon flux densities above a deciduous forest in Greece, the southernmost monitoring
site in Europe. Results show annual net carbon absorption of 7.6 t C ha–1 y–1, indicating that this forest is a
strong carbon sink compared to other European sites. However, absorbance may be reduced by 1 μmol m–2 s–1
for every 1.5 ºC above-canopy air temperature increase or 0.015 cm3 cm–3 active root-zone moisture depletion,
beyond estimated optimum values. The forest acts as a carbon sink from late April to early November and
as a source of carbon in the remaining period of the year. The highest CO2 net absorption flux occurs during
June-July (approximately 200 g C m–2 month–1).
Keywords: Carbon fluxes, oak forest, photosynthetic active radiation (PAR), net radiation (Rnet), temperature,
net ecosystem exchange (NEE).
1. Introduction
It is well known that forest ecosystems have the ability to absorb CO2 from the atmosphere and
store it in trees biomass and soils (Valentini et al., 2000; Griffiths and Jarvis, 2005; Hyvönen et al., 2007; Jarvis and Linder, 2007). Deforestation and reforestation can cause faster decomposition of the soil organic matter (e.g., Cannell et al., 1993), releasing thus CO2 back to the atmosphere and
causing negative rates of net ecosystem exchange (NNE) for many years after (e.g., Zerva and Men-cuccini, 2005; Zerva et al., 2005; Jarvis and Linder,
2007), whereas wildfires have similar effects (e.g., Jarvis and Linder, 2007) since they produce high magnitudes of carbon emissions to the atmosphere (Cruz-Núñez et al., 2014). The rate of CO2 absorption
depends on the efficiency of solar radiation on pho-tosynthetic rates. On the other hand, forests lose C by emitting CO2 as a result of autotrophic and
forests in both northern and southern hemispheres is quite similar with an annual rate of approximately 12 t C ha–1 y–1 (Valentini et al., 2000).
Despite the extended research carried out on the effects of increasing CO2 concentrations on forest
ecosystems, there are several questions that remain unanswered (e.g., Körner et al., 2005). One of the most important issues is the change in forest productivity. Increase in CO2 concentration in the atmosphere may
lead to an increase in leaf area in the younger plan-tations (e.g., Karnosky et al., 2003, 2005; Liberloo et al., 2006) but not in the older ones (e.g., Asshoff et al., 2006). Norby et al. (2005) found a 23.2% increase in net primary production due to an increase in radiation absorbance resulting from leaf area increase. However, Körner et al. (2005) found that atmospheric enrichment with CO2 did not lead mature deciduous forest trees
to trap more carbon, but, instead, more carbon was “pumped” through the trees bodies.
Increase in CO2 concentration can also lead to
changes in the start, end and also the length of the growth period of the plants but may differ from region to region (Karnosky et al., 2005; Asshoff et al., 2006). The data from Valentini et al. (2000) re-vealed a decreased net uptake of various European forests with increasing latitude and GPP to remain, in principle, constant. The forests investigated in that study were located mostly in boreal and temperate zones, whereas a small number of forests located in the northern Mediterranean (Italy, between 41º 45’-41º 52’ N) were also included. In general, a rather small number of studies have been carried out for forests in the Mediterranean area compared to other climate zones. However, the Mediterranean environment may significantly affect C fluxes due to restricted water availability during the growth period, despite the fact that during the same period more favorable air tem-perature and solar radiation do exist. In addition, in the context of response to climate change, data – along with a better understanding of the driving forces in the Mediterranean environment – is needed, since re-sponse to climate change has been reported to be more pronounced in the Mediterranean area and especially in the semiarid coastal areas (e.g., SRES, 2000).
This work deals with C fluxes in a Mediterranean deciduous ecosystem, a natural oak forest in the most southern European monitoring site (Peloponnese, Greece) of the MEDEFLU network. The latter is a
part of the wider network MEDEFLU-EUROFLUX, which was established to study mass and energy fluxes in the Mediterranean forest ecosystems. The work is based on micrometeorogical and CO2 flux
measurements using the eddy covariance technique and provides information about the carbon cycle dynamics on forest ecosystems, which can be useful in future studies for climate change mitigation in the Mediterranean. This technique is used in the present study since it has been shown to provide reliable local scale estimations of C absorption rates and ecosystem carbon balance response to the variability of climate parameters (Valentini et al., 2000). However, even if the eddy covariance technique is acknowledged as a major achievement in ecosystem research, its potential for the quantification of carbon budget and sequestration on a long-term basis and in regional or greater scales is in question (Körner, 2003a, b).
2. Materials and methods
The monitoring site is the Mogostos forest (38º 00’ N, 22º 37’ E, 840 masl), located in the Peloponnese, central Greece. The site covers an area of about 580 ha in a homogenous deciduous forest, approximately 50-yrs old, consisting mainly of Hungarian oak (Quercus frainetto) but also in coniferous species (Pinus nigra, Pinus halepensis, Pinus laricio and
Abies cefalonica). The oaks dominate at a percent-age of 57%, while conifers occupy about 14% of the total forest area, with the rest corresponding to mixed zones (25%) or openings with shrubs (4%). Around the meteorological station the oak forest is almost pure, with an average density of 320 trees per ha and with only sparse Abies cefalonica
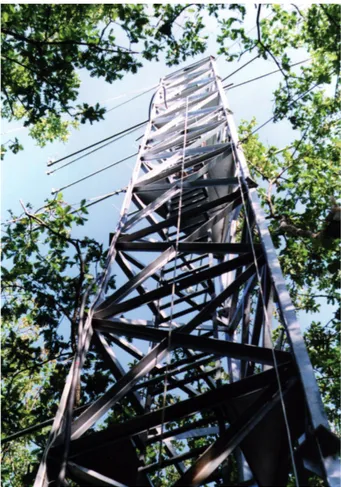
Within the forest stand, a 26 m high meteoro-logical tower was constructed (Figure 1). The trees surrounding the tower had an average height of 13 m and breast diameters ranging from 6.4 cm to 12.8 cm. The forest had a maximum leaf area index (LAI) of 3.2 during the fully leafed period. The soil is clay-loam with a field capacity (FC) of 0.42 and a permanent wilting point (PWP) of 0.05 by volume.
The region has a typical Mediterranean climate (hot and dry summers, cold and wet winters). The length of the dry period is six months starting in April. The annual mean temperature at a height of 18.55 m is 13.84 ± 6.79 ºC, whereas the total precipitation is 714 mm. Monthly mean values of air temperature (T), relative humidity (RH), precipitation (P), incoming short wave solar radiation (Rs), photosynthetically active radiation (PAR) and net radiation (Rnet),
mea-sured at this height, are shown in Table I.
Measurements of CO2 fluxes were carried out
using the eddy covariance technique (Moncrieff et al., 1997; Aubinet et al., 1999; Baldocchi et al. 2000). The general principles of the technique are fully described in Burba and Anderson (2006) and a synoptic description is presented in Vargas et al. (2013). The method uses simultaneous measure-ments from three dimensional wind velocity and gas
analyzer data, allowing calculation of representative Fig. 1. Instrumentation set up in the MEDEFLU study site (Mogostos forest in Corinth, Greece).
Table I. Monthly mean values of temperature (T), relative humidity (RH), precipitation (P), short wave solar radiation (Rs), photosynthetically active radiation (PAR), and net
radiation (Rnet) in Mogostos (1999-2006).
Month T
(ºC) (%)RH (mm)P (µmol mPAR–2 s–1) (W mRs–2) (W mRnet–2)
January 4.8 79.3 131 178 79 5
February 5.2 76.9 102 246 111 23
March 9.6 65.9 156 366 175 38
April 12.3 61.8 18 406 206 68
May 16.5 56.0 6 534 268 130
June 20.7 50.3 17 638 314 170
July 23.6 45.8 9 646 314 170
August 23.4 46.5 0 601 280 140
September 18.2 64.2 46 425 221 90
October 15.4 77.0 25 305 135 65
November 11.0 71.5 24 203 102 19
fluxes above a surface. Since several uncertainties are associated with the eddy covariance technique (e.g., Mauder et al., 2008), efforts have been made to find the possible miscalculations in every stage of data assessment by the use of suggested methods (Mauder and Foken, 2006; Aubinet et al., 2003). More spe-cifically, in the present study the eddy covariance system was established at a height of 18.55 m (about 5.5 m above the top of the canopy). It consists of a METEK USA1 Sonic 3-D anemometer (METEK GmbH, Elmshorm, Germany) and a Li-6262 infrared gas analyzer (IRGA) used for CO2 and water vapor
flux measurements. For the set-up of the system, the technique described by Schutz (1996) and Tworek (1996) was followed. The calibration of the system was completed on a 10-day basis manually. Briefly, the post-processing data quality control procedure included calibration of the vapor and CO2 measuring
system, the Webb-Pearmann-Leunig correction to covariances, spike removal and crosswind correction, sensor head correction, rotation corrections and de-trending. For more details on the above procedures see Morgenstern (2000). A threshold of friction ve-locity u* = 0.47 m s–1 was adopted for corrections
of atmospheric stability conditions, resulting to an exclusion of almost half (46%) of nighttime and less than 10% of daytime raw data. The eddy covariance measurements were averaged every 15 (year 1999) or 30 min (year 2000). Negative nighttime CO2
measurements and out of range data (fluxes greater than –50 and less than +50 μmol m–2 s–1) were also
removed (Etzold et al., 2011). Gap filling for the hourly data was applied only for small gaps (less than 2 h). These gaps were filled by linear interpolation. The hourly values used in this paper were extracted from the half hour data.
The radiation regime was studied by locating radi-ation sensors on the tower, at the same height (18.55 m) with the eddy covariance system. Net radiation (Rnet) was measured with a Q-7 Net Radiometer.
Intercepted and reflected PAR fluxes were measured with Li 190S B Quantum sensors and those absorbed by the ecosystem were computed by subtracting the reflected from the intercepted fluxes. Radiation mea-surements were taken every 10 min and an average was extracted every hour.
Hourly data were collected on a 2-yr period (Feb-ruary to September 1999 and June to July 2000). After
quality control, a data set of 4008 hourly measure-ments (including CO2, Rnet and PAR fluxes densities)
was used. Daily means, covering about 65% of the total length of the above-mentioned data recording periods, were calculated only for days with complete hourly data. Daily gaps were filled only in order to make an estimate of the annual fluxes. Daily gaps were filled by using response functions, relating daily CO2 flux to: a) air temperature (during forest leafless
stage), b) absorbed PAR (during the fully leafed stage), and c) soil moisture at 10 cm depth (during the leaf development stage), within a data window of variable size, depending on data availability.
3. Results and discussion
CO2 fluxes in the Mogostos forest are typical of those
recorded above a natural deciduous ecosystem, i.e. low (slightly positive or zero) during the leafless stage and highest (negative, showing CO2 absorption)
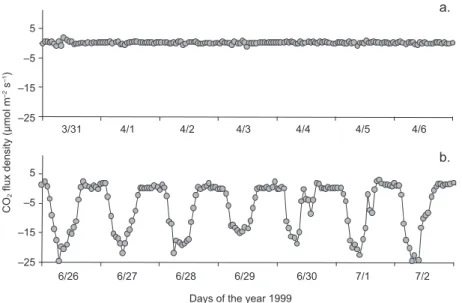
at maximum leaf area index (LAI). In Figure 2 the diurnal CO2 fluxes during 14 days (seven during the
leafless stage and seven more during the fully leafed period of the year 1999) are shown.
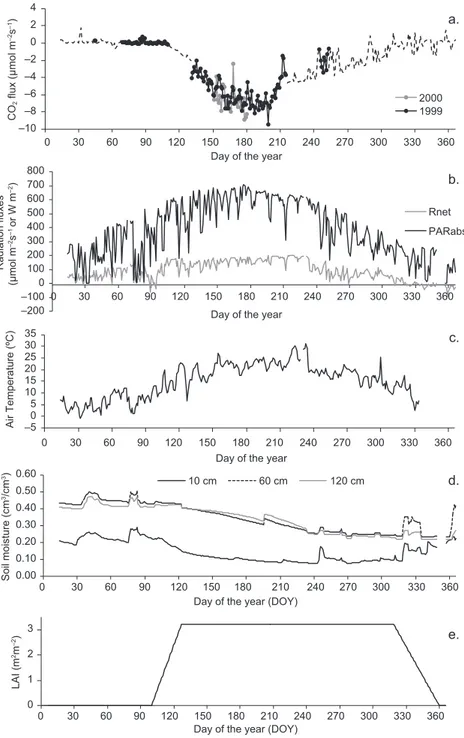
The daily means of CO2, Rnet, absorbed PAR flux
densities, and annual evolution of air temperature and soil moisture, along with LAI development estima-tions, are presented in Figure 3. Carbon fluxes are near zero (slightly positive) in the leafless stage, they become (negative) higher after leaf emergence and get to a maximum when leaves are fully developed. The difference derived from the magnitude of CO2 between emission and absorption constitutes
the NEE. More detailed information about the partitioning of CO2 flux in terrestrial ecosystems
is given by Vargas et al. (2013). CO2 absorption
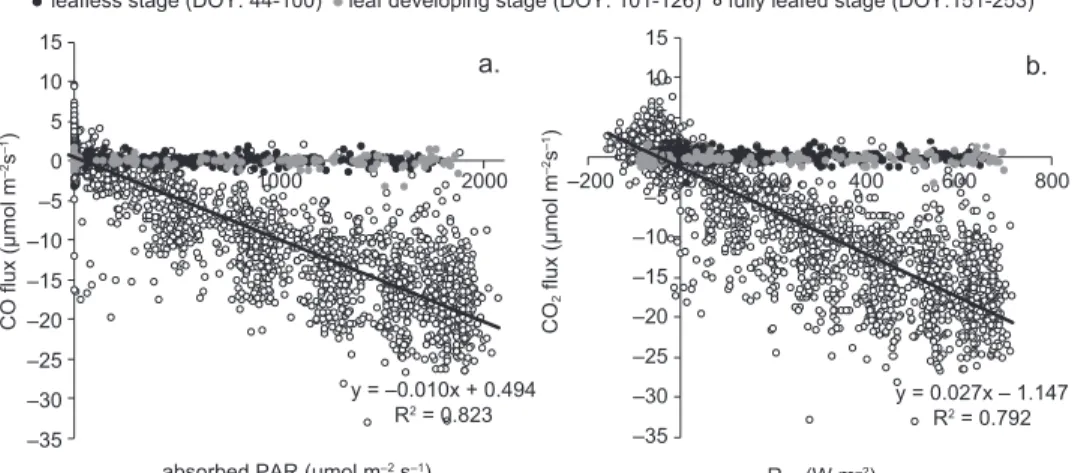
was strongly related with Rnet and absorbed PAR,
even in an hourly basis (Fig. 4). The determina-tion coefficients between the hourly flux densities of CO2 and the respective values of Rnet and
ab-sorbed PAR were highest during the growth period (R2 = 0.79 and 0.82 for R
net and PAR, respectively),
when trees had fully developed canopies. CO2
flux-es were almost zero during dormancy or when the forest was in the initial stage of its growth period. It started increasing when trees developed photosyn-thetically active leaves. During the fully leafed stage, light use efficiency (LUE) shows that CO2
addition of every μmol m–2 s–1 of absorbed PAR (or
0.02 μmol m–2 s–1 for every W m–2 of R
net added).
In the leaf stage, CO2 fluxes varied much,
espe-cially in daytime during a 24-h period (Fig. 5). As expected, the maximum absorption was observed at noon when fluxes became highest in summer and particularly in June and July (averaged to 19 μmol CO2 m–2 s–1), most probably due to high solar
radi-ation combined with sufficient soil moisture. More specifically, during the most productive months, June and July, daytime fluxes (C absorption by photosyn-thesis) were found to be higher than 12 µmol m–2 s–1
(12.8 and 12.9 µmol m–2 s–1, respectively). In
com-parison, even when leaves were fully developed, night time fluxes (C loss by respiration) were close to 1 µmol m–2 s–1 (0.9 and 0.8 µmol m–2 s–1 for June
and July, respectively). The highest absorption rate of 739 g CO2 m–2 month–1 was observed in July,
corre-sponding to carbon uptake of 202 g C m–2 month–1.
After July, however, the increase of atmospheric dryness leads trees to employ adaptive-survival mechanisms, mainly by leaf stomata closure, which results in a decrease of C absorption during late sum-mer (August, Fig. 5). In September, the combination of the above parameters is slightly improved and leads to a small increase in C uptake as compared to August. Further, absorption rates were gradually reduced in the next months, becoming almost zero
(4.7 g C m–2 month–1) in November, when leaves
stopped photosynthesizing. As there was no appre-ciable photosynthetic activity in winter, C emission, due to respiration, exceeded absorption. Therefore, in the leafless stage (December to March) the eco-system functions as a C source. The rates of C loss were quite low, becoming maxima in January and February (+6 g C m–2 month–1). In general, during
late fall, winter and early spring, when there were no leaves, CO2 fluxes are found to be close to zero
or slightly positive during the 24-h period (Fig. 5). In the leaf stage (April to November) the Mogostos forest acts as a sink for C.
CO2 absorption and emission differ strongly
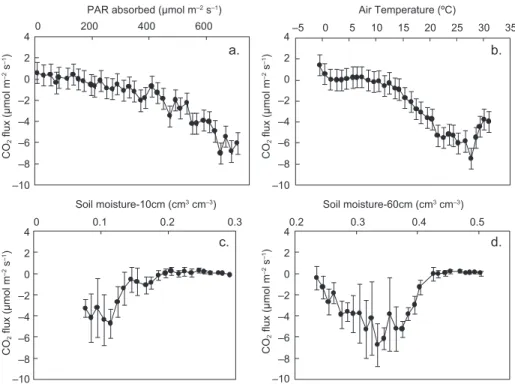
among plant species and between dry and rain periods of the year (Sánchez-León et al., 2016). To investigate the effects on CO2 fluxes of (a) PAR absorbed by the
ecosystem, (b) the above canopy air temperature, and (c) soil moisture at various depths, mean daily CO2 fluxes were examined in response to the above
parameters. Results are shown in Figure 6.
The derived curves in Figure 6 are generally similar to those presented in Etzold et al. (2011). The CO2 flux starts becoming negative at a threshold
temperature of 8 ºC and a PAR value of 150 μmol m–2 s–1. At lower values. CO
2 fluxes are positive,
indicating C emission. The CO2 flux becomes
max-imum (more negative than –6 μmol m–2 s–1) when
3/31 4/1 4/2 4/3 4/4 4/5 4/6
6/26 6/27 6/28 6/29 6/30 7/1 7/2
Days of the year 1999 –25
–15 –5 5
a.
b.
–25 –15 –5 5
CO
2
flux density (μmol
m
–2 s –1)
Fig. 2. Indicative CO2 hourly fluxes during (a) seven days of the leafless stage
daily absorbed PAR is around 650 μmol m–2 s–1, air
temperature is close to 27 ºC and soil moisture at 60 cm is approximately 0.33. Relative to these optimum values, when air temperature becomes higher and/ or soil moisture becomes lower, carbon absorption
is reduced even if PAR is high. Specifically, when temperature exceeds its threshold value, the CO2 flux
(negatively) increases at a rate of –0.4 µmol m–2 s–1
per ºC (Fig. 6b). Fluxes also increase by –0.02 µmol CO2 per µmol of absorbed PAR when radiation exceeds
–10 –8 –6 –4 –2 0 2 4
0 30 60 90 120 150 180 210 240 270 300 330 360
2000 1999
a.
–200 –1000 100 200 300 400 500 600 700 800
0 30 60 90 120 150 180 210 240 270 300 330 360
Radiation fluxes
(μmol
m
–2s –1 or W
m
–2)
Day of the year Day of the year
Rnet PARabs
b.
–50 5 10 15 20 25 30 35
0 30 60 90 120 150 180 210 240 270 300 330 360
Day of the year
c.
0.00 0.10 0.20 0.30 0.40 0.50 0.60
10 cm 60 cm 120 cm d.
0 1 2 3
0 30 60 90 120 150 180 210 240 270 300 330 360
e.
Day of the year (DOY)
0 30 60 90 120 150 180 210 240 270 300 330 360
Day of the year (DOY)
CO
2
flux (μmol
m
–2s –1)
Air Temperature (ºC)
Soil moisture (cm
3/c
m
3)
LAI (m
2m –2)
Fig. 3. Daily means of (a) CO2 flux data and CO2 flux estimates (dashed line),
(b) Rnet and absorbed PAR flux densities, (c) air temperature at 25 m height, (d)
550 µmol m–2 s–1 (Fig. 6a) or by –0.7 µmol m–2 s–1
for 1% root-zone soil moisture departure from field capacity (0.42) down to 0.33, becoming positive thereafter at 0.4 µmol m–2 s–1 per 1% soil moisture
depletion (Fig. 6d), which implies C uptake reduction due to inadequate water availability (Graf Pannatier et al., 2012). When soil moisture is adequate, increases in temperature (up to a certain level) enhance net CO2 absorption (Sacks et al., 2007). Therefore, for
the soil moisture effect on carbon fluxes, it is found that the changes in soil moisture, due to changes in precipitation patterns, can substantially affect carbon uptake by the ecosystems (Thomey et al., 2011; Var-gas et al., 2012, 2013).
In Figure 7 the estimated monthly CO2 absorption
(NEE) is shown. It is noticeable that NEE is low in April and it increases sharply in the following month, which is rather expected for deciduous oaks (Novic et al., 2015), since the budbreak occurs in April and the maximum LAI is achieved by the end of this month. The total annual CO2 absorption was 27.85 t CO2 ha–2,
meaning that the forest (580 ha), absorbs 16 150 t CO2 annually. This estimated annual CO2 absorption
results in an annual C uptake on the order of 7.6 t C ha–1 y–1, a rather high value but within the range of
expected for other Mediterranean forest ecosystems (Valentini et al., 2000; Griffiths and Jarvis, 2005; Hyvönen et al., 2007; Etzold et al., 2011).
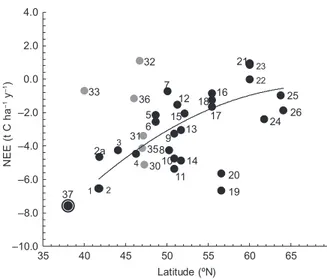
Figure 8 shows the net productivity data (in terms of NEE values) as a function of site latitude for forests in various world climates provided by several authors (Valentini et al., 2000; Griffiths and Jarvis, 2005; Hyvönen et al., 2007; Etzold et al., 2011). The NEE value at the Mogostos forest in the present study is also shown. Note that the estimated value of –7.6 t C ha–1 y–1 for the Mogostos forest fits well to the NEE
curve. Further, the forest examined in the present study shows the highest value compared to all other sites, including those in the Mediterranean area (Italy, sites 1 and 2 in Fig. 8), which have estimated values on the order of –6.5 t C ha–1 y–1. However, in Italy,
Chirici et al. (2016) found NEE values of about 7.0 t C ha–1 y–1 for a beech and a turkey-oak forest
at quite different altitudes, and Tirone et al. (2003) mention NEE between –5.47 and –6.60 t C ha–1 y–1
–25 –20 –15 –10 –5 0 5
0 2 4 6 8 10 12 14 16 18 20 22 24
solar time (h)
14 February 15 March 15 April
14 May 15 June 15 July
2 August 8 September
CO
2
flux density (µmol
m
–2 s –1)
Fig. 5. CO2 flux diurnal variations on indicative days of
the leafless and leafed stages of the oak forest.
leafless stage (DOY: 44-100) leaf developing stage (DOY: 101-126) fully leafed stage (DOY:151-253)
–35 –30 –25 –20 –15 –10 –5 0 5 10 15
0 1000 2000
a.
–200 0 200 400 600 800
b.
CO flux (µmol
m
–2s –1)
y = –0.010x + 0.494
R2 = 0.823 y = 0.027x – 1.147R2 = 0.792
–35 –30 –25 –20 –15 –10 –5 0 5 10 15
CO
2
flux (µmol
m
–2s –1)
absorbed PAR (µmol m–2 s–1) R
net (W m–2)
Fig. 4. Correlation of the hourly CO2 fluxes with (a) absorbed PAR and (b) Rnet, during
for a Q. ilex forest in Castelporziano. It is also inter-esting to note that similar high values (on the order of –6 t C ha–1 y–1) have been reported for forests
in northern Europe (Great Britain, sites 20 and 19 in Fig. 8). These are well managed forests and the net productivity values associated with them are in contrast to values close to 0 t C ha–1 y–1 reported
for poor managed forests in the same region (Great
Britain, sites 21, 22 and 23 in Fig. 8). This implies the importance of management practices in forest pro-ductivity, without underestimating the effect of many other driving factors as altitude, soil substrate, tree density, forest composition, existing herbaceous veg-etation, etc. However, such management practices, which maintain or enhance high carbon absorption, especially at young forests, do not contribute to the long-term carbon sequestration in ecosystems, since the carbon residence time is diminished and these forests are not as significant long-term carbon pools as the old growth ones (Körner, 2017).
The high-net ecosystem carbon uptake estimated for the Mogostos forest is only a rough (though indica-tive) estimate. It is desirable to have longer time series to obtain a representative average value, since carbon fluxes are significantly affected by the gap-filling method used and also show significant annual vari-ations (e.g., Novick et al., 2015). However, the high NEE for Mogostos forest is possibly explained by the generally warmer Mediterranean conditions (partic-ularly during 1999 and 2000) and the longer growth period compared to other sites. Such an environment –10
–8 –6 –4 –2 0 2 4
–10 –8 –6 –4 –2 0 2 4
0 200 400 600
a.
–5 0 5 10 15 20 25 30 35
b.
0 0.1 0.2 0.3
c.
0.2 0.3 0.4 0.5
d.
CO
2
flux (µmol
m
–2 s –1)
–10 –8 –6 –4 –2 0 2 4
CO
2
flux (µmol
m
–2 s –1)
–10 –8 –6 –4 –2 0 2 4
CO
2
flux (µmol
m
–2 s –1)
CO
2
flux (µmol
m
–2 s –1)
PAR absorbed (µmol m–2 s–1) Air Temperature (ºC)
Soil moisture-10cm (cm3 cm–3) Soil moisture-60cm (cm3 cm–3)
Fig. 6. Mean daily CO2 fluxes (and SD) in response to (a) mean daily
photosynthetical-ly active radiation (PAR) absorbed by the ecosystem bin-averaged in 20 μmol m–2 s–1
classes; (b) air temperature at 25.1m height, bin-averaged in 1 ºC classes; and (c, d) soil moisture bin-averaged in 1% classes at 10 and 60 cm depths, respectively.
–250 –200 –150 –100 –50 0 50
Jan Feb Mar Apr May Jun Jul Aug Sep Oct Nov Dec Month
C flux (gC
m
–2 mont
h
–1)
accelerates the carbon fluxes, since the forest extends over a clay-loam soil with relatively high field capac-ity, providing root-zone with adequate water until late July (Fig. 3d). The soil at Mogostos forest is mesic, with 291 days per year with soil temperatures greater than 5 ºC and 0 days with temperatures less than 0 ºC (Baier and Mack, 1973), implying a prolonged active season length (negative NEE) of about seven months (Figs. 3a, 7), which is considered as a significant control on inter-annual flux variability in deciduous forests (Dragoni et al., 2011). Costa-e-Silva et al. (2015) mention the extended length of the growing season and soil water availability as reasons for high-er NEE values in a cork-oak ecosystem in Portugal. Additionally, the absorbed PAR by the young (50-yr old) trees is higher than 550 µmol m–2 s–1 between mid
April and late August (Fig. 3b). CO2 absorption is not
significantly affected by the sparse, early flourishing herbaceous vegetation, but the high tree density of the forest is expected to affect the carbon fluxes.
Further, it is also interesting to discuss the ra-tio NEE/RΕ with RE representing C losses due to Fig. 8. Net ecosystem exchange (NEE) of different Europe-an forest ecosystems that are part of the EUROFLUX net-work, as a function of latitude. Black dots 1-26 (modified from Valentini et al., 2000) correspond to Italy (1, 2, 2a, 4), France (3, 5, 6), Germany (7, 9, 10, 11, 13, 14), Belgium (8, 12), Holland (15), Denmark (16, 17, 18), Britain (19, 20, 21, 22, 23), Finland (24), Iceland (25), and Sweden (26). Grey dots 30-33, 35, 36 (modified from Etzold et al., 2011) correspond to Switzerland (30, 31, 32, 35, 36), and the USA (33). The circled black dot (37) refers to the NEE value at Mogostos forest in Greece (altitude: 840 m).
30 31
32
35 36 33
19 20
25
37 1 2 3
4
5 6
7
89 10
11 12
13
14 15
16
17 18
23 22
21
24 26
2a
–10.0 –8.0 –6.0 –4.0 –2.0 0.0 2.0 4.0
35 40 45 50 55 60 65 70
N
EE (t C ha
–1 y –1)
Latitude (ºN)
autotrophic and heterotrophic respiration. This ratio was found also to vary according to latitude. The extrapolation of the NEE/RE ratio curve for all Eu-ropean forests as given by Valentini et al. (2000) pro-vides for the Mogostos forest (latitude 38º N) a ΝΕE/ RE value of ≈ –1.2. This ratio was used to produce a rough estimate of RE in our study, implying that RE corresponds to a value of about 6.3 t C ha–1 y–1 (RE =
NEE/1.2 =7.6/1.2 = 6.3). The gross primary produc-tion (GPP) would be then the sum of net gains and losses (GPP = NEE + RE) with a value of 7.6 + 6.3 = 13.9 t C ha–1y–1. This value is in the range expected
for Mediterranean and north European forests and it is also consistent with the value of 1288 g C m–2 y–1
simulated using the BIOME-BGC model (Running and Hunt, 1993) for an oak forest in Tuscany, Italy (Chiesi et al., 2011). These results indicate that the Mogostos oak forest is a strong carbon sink compared to other European forests, at least on an annual basis.
4. Conclusions
The results of the present study allow to draw the following conclusions. There is a good relation between radiation availability and CO2 fluxes
above the deciduous forest ecosystem during the fully leafed period (May to July) when, for every µmol m–2 s–1 increase in absorbed PAR, an increase
of 0.01 µmol m–2 s–1 of CO
2 absorption was recorded.
The net carbon uptake of the examined Mediterranean oak forest was roughly estimated at 7.6 t C ha–1 y–1,
which is a relatively high value compared to other European forests, probably because the young aged forest grows in a favorable physical environment (i.e., warm conditions, high radiation availability, suffi-cient soil moisture and an extended growing season). CO2 fluxes were found to be maximum in June and
July (averaged to 200 g C m–2 month–1) with a noon
peak of 19 µmol CO2 m–2 s–1. However, the
coinci-dence of the fully leafed period with the dry and warm season of the year may lead to a 1 µmol CO2 m–2 s–1
decrease in the absorption active root-zone moisture or a 1.5 ºC increase in the above-canopy air tem-perature with respect to optimum values (0.33 cm3
cm–3 at 60 cm and 27 ºC at 18.5 m). Finally, the
ex-amined ecosystem was found to act as a CO2 source
Acknowledgments
This research was part of the EC Project MEDE-FLU-EUROFLUX “Carbon and water fluxes of Mediterranean forests and impacts of land use/ cover changes” (ENV4-CT97-0455 DGXII-Envi-ronment and Climate) carried out by the Agricultural University of Athens and the Göttingen Institute of Bioclimatology. Special acknowledgements are ad-dressed to Dr. K. Morgenstern and Dr. A. Ibrom of this institute for cooperation on the data processing. The authors also wish to thank Dr. P. Michopoulos of the Mediterranean Forest Ecosystems Research Institute in Athens for his constructive remarks on the manuscript of this paper, and to Mrs R. Draco-poulou and Dr. D. Tigasfor the Spanish translation of the abstract. Finally, the significant contribution of two anonymous reviewers is highly acknowledged.
References
Asshoff R., G. Zotz and C. Körner, 2006. Growth and phenology of mature temperate forest trees in elevated
CO2. Glob. Change Biol. 12, 1-14.
doi: 10.1111/j.1365-2486.2006.01133.x
Aubinet M., A. Grelle, A. Ibrom, Ü. Rannik, J. Moncrieff, T. Foken, A.S. Kowalski, P.H. Martin, P. Berbigier, Ch. Bernhofer, R. Clement, J. Elbers, A. Granier, T. Grün-wald, K. Morgenstern, K. Pilegaard, C. Rebmann, W. Snijders, R. Valentini and T. Vesala, 1999. Estimates of the annual net carbon and water exchange of forests: the EUROFLUX methodology. Adv. Ecol. Res. 30, 113-175. doi: 10.1016/S0065-2504(08)60018-5 Aubinet M., R. Clement, J.E. Elbers, T. Foken, A. Grelle,
A. Ibrom, J. Moncrieff, K. Pilegaard, Ü. Rannik and C. Rebmann, 2003. Methodology for data acquisition, storage and treatment. In: Fluxes of carbon, water and energy of European forests (R. Valentini, Ed.). Ecolog. Stud. 163, 9-35.
Baier W. and A.R. Mack, 1973. Development of soil temperature and soil water criteria for characterizing soil climates in Canada. Field soil water regime. SSSA Spec. Publ. 5, 195-212. doi:10.2136/sssaspecpub5.c11 Baldocchi D.D., B.E. Law and P.M. Anthoni, 2000. On
measuring and modeling energy fluxes above the floor of a homogeneous and heterogeneous conifer forest. Agr. Forest. Meteorol. 102, 187-206.
doi: 10.1016/S0168-1923(00)00098-8
Burba G.G. and D.J. Anderson, 2006. Introduction to the eddy covariance method. General guidelines and
conventional workflow. Available at: http://www. instrumentalia.com.ar/pdf/Invernadero.pdf
Cannell M.G.R., R.C. Dewar and D.G. Pyatt, 1993. Co-nifer plantations on drained peatlands in Britain: a net gain or loss of carbon? Forestry 66, 353-369.
doi: 10.1093/forestry/66.4.353
Chiesi M., L. Fibbi, L. Genesio, B. Gioli, R. Magno, F. Maselli, M. Moriondo and F. Vaccari, 2011. Integration of ground and satellite data to model Mediterranean forest processes. Int. J. Appl. Earth Obs. Geoinf. 13, 504-515.
doi: 10.1016/j.jag.2010.10.006
Chirici G., M. Chiesi, P. Corona, R. Salvati, D. Papale, L. Fibbi, C. Sirca, D. Spano, P. Duce, S. Marras, G. Mat-teucci, A. Cescatti and F. Masilli, 2016. Estimating dai-ly forest carbon fluxes using a combination of ground and remotely sensed data, J. Geophys. Res.-Biogeo. 121, 266-279. doi: 10.1002/2015JG003019
Costa-e-Silva F., A.C. Correia, A. Piayda, M. Dubbert, C. Rebmann, M. Cuntz, C. Werner, J.S. David and J.S. Pereira, 2015. Effects of an extremely dry winter on net ecosystem carbon exchange and tree phenology at a cork oak woodland. Agr. Forest. Meteorol. 204, 48-57. doi: 10.1016/j.agrformet.2015.01.017
Cruz-Núñez X., L. Villers-Ruiz and C. Gay-García, 2014. Black carbon and organic carbon emissions from wild-fires in Mexico. Atmósfera 27, 165-172.
Dragoni D., H.P. Schimid, C.A. Wayson, H. Potter, C.S.B. Grimmond and J.C. Randolph, 2011. Evidence of increased net ecosystem productivity associated with a longer vegetated season in a deciduous forest in south-central Indiana, USA. Glob. Change Biol. 17, 886-897.
doi: 10.1111/j.1365-2486.2010.02281.x
Etzold S., N.K. Ruehr, R. Zweifel, M. Dobbertin, A. Zingg, P. Pluess, R. Häsler, W. Eugster and N. Buchmann, 2011. The carbon balance of two contrasting mountain ecosystems in Switzerland: Similar annual trends, but seasonal differences. Ecosystems 14, 1289-1309. doi: 10.1007/s10021-011-9481-3
Graf Pannatier E., M. Dobbertin, A. Heim, M. Schmitt, A. Thimonier, P. Waldner and B. Frey, 2012. Response of carbon fluxes to the 2003 heat wave and drought in three mature forests in Switzerland. Biogeochemistry 107, 295-317. doi: 10.1007/s10533-010-9554-y Griffiths H. and P.G. Jarvis (Eds.), 2005. The carbon
Hyvönen R., G.I. Ǻgren, S. Linder, T. Persson, F.M. Cotrufo, A. Ekblad, M. Freeman, A. Grelle, I.A. Janssens, P.G. Jarvis, S. Kellomäki, A. Lindroth, D. Loustau, T. Lundmark, R.J. Norby, R. Oren, K. Pile-gaard, M.G. Ryan, B.D. Sigurdsson, M. Strömgren, M. van Oijen and G. Wallin, 2007. The likely impact of elevated CO2, nitrogen deposition, increased tem-perature and management on carbon sequestration in temperate and boreal forest ecosystems: a literature review. New Phytol. 173, 463-480.
doi: 10.1111/j.1469-8137.2007.01967.x
Jarvis P.G. and S. Linder, 2007. Forests remove carbon dioxide from the atmosphere: Spruce forest tales! In: Forestry and climate change (P.H. Freer-Smith, M.S.J. Broadmeadow and J.M. Lynch, Eds.). Cromwell Press Group, Trowbridge, 60-72.
Karnosky D.F., D.R. Zak, K.S. Pregitzer, C.S. Awmack, J.G. Bockheim, R.E. Dickson, G.R. Hendrey, G.E. Host, J.S. King, B.J. Kopper, E.L. Kruger, M.E. Kubiske, L. Lindroth, W.J. Mattson, E.P. McDonald, A. Noormets, E. Oksanen, W.F.J. Parsons, K.E. Percy, G.K. Podila, D.E. Riemenschneider, P. Sharma, R.C. Thakur, A. Sober, J. Sober, W.S. Jones, S. Anttonen, E. Vapaavuori, B. Mankovska, W.E. Heilman and J.G.
Isebrands, 2003. Tropospheric O3 moderates responses
of temperate hardwood forests to elevated CO2: A
synthesis of molecular to ecosystem results from the Aspen FACE project. Funct. Ecol. 17, 289-304. doi: 10.1046/j.1365-2435.2003.00733.x
Karnosky D.F., K.S. Pregitzer, D.R. Zak, M.E. Kubiske, G.R. Hendrey, D. Weinstein, M. Nosal and K.E. Per-cy, 2005. Scaling ozone responses of forest trees to the ecosystem level in a changing climate. Plant Cell Environ. 28, 965-981.
doi: 10.1111/j.1365-3040.2005.01362.x
Kirschbaum M.U., 1995. The temperature dependence of soil organic matter decomposition, and the effect of global warming on soil organic C storage. Soil. Biol. Biochem. 6, 753-760.
doi: 10.1016/0038-0717(94)00242-S
Körner C., 2003a. Slow in, rapid out-carbon flux studies and Kyoto targets. Science 300, 1242-1243.
doi: 10.1126/science.1084460.
Körner C., 2003b. Analyzing carbon flux measurements – Response. Science 301, 916-917.
doi: 10.1126/science.301.5635.916b
Körner C., R. Asshoff, O. Bignucolo, S. Hättenschwiler, S.G. Keel, S. Peláez-Riedl, S. Pepin, R.T.W. Siegwolf
and G. Zotz, 2005. Carbon flux and growth in mature
deciduous forest trees exposed to elevated CO2.
Sci-ence 309, 1360-1362. doi: 10.1126/sciSci-ence.1113977 Körner C., 2017. Carbon sequestration – a matter of tree
longevity. Science 355, 130-131. doi: 10.1126/science.aal2449
Liberloo M., C. Calfapietra, M. Lukac, D. Godbold, Z.B. Luo, A. Polle, M.R. Hoosbeek, O. Kull, M. Marek, C. Raines, G. Taylor, G. Scarascia-Mugnozza and R. Ceulemans, 2006. Woody biomass production during second rotation of a bio-energy Populus plantation
increases in a future high CO2 world. Glob. Change
Biol. 12, 1-13.
doi: 10.1111/j.1365-2486.2006.01118.x
Mauder M. and T. Foken, 2006. Impact of post-field data processing on eddy covariance flux estimates and en-ergy balance closure. Meteorol. Z. 15, 597-609. doi: 10.1127/0941-2948/2006/0167
Mauder M., T. Foken, R. Clement, J.A. Elbers, W. Eugster, T. Gröunwald, B. Heusinkveld and O. Kolle, 2008. Quality control of CarboEurope flux data – Part 2: Inter-comparison of eddy-covariance software. Bio-geosciences 5, 451–462.
Moncrieff J.B., R. Valentini, S. Greco, G. Seufert and P. Ciccioli, 1997. Trace exchange over terrestrial ecosys-tems: methods and perspectives in micrometeorology. J. Exp. Bot. 48, 1133-1142.
doi: 10.1093/jxb/48.5.1133
Morgenstern K., 2000. Turbulent CO2, H2O and energy
fluxes above a Mediterranean oak and a mountainous spruce forest investigated by eddy-covariance mea-surements. PhD dissertation. Georg-August-Univer-sität, Göttingen-Germany.
Norby R.G., E.H. De Lucia, B. Gielen, C. Calfapietra, C.P. Giardina, J.S. King, J. Ledford, H.R. McCarthy, D.J.P. Moore, R. Ceulemans, P. De Angelis, A.C. Finzi, D.F. Karnosky, M.E. Kubiske, M. Lukac, K.S. Pregitzer, G.E. Scarascia-Mugnozza, W.H. Schlesinger and R.
Oren, 2005. Forest response to elevated CO2 is
con-served across a broad range of productivity. P. Natl. Acad. Sci. USA 102, 18052-18056.
doi: 10.1073/pnas.0509478102
Novick K.A., A.C. Oishi, E.J. Ward, M.B.S. Siqueira, J.-Y. Juang and P.C. Stoy, 2015. On the difference in the net
ecosystem exchange of CO2 between deciduous and
evergreen forests in the southeastern United States. Glob. Change Biol. 21, 827-842.
Running S.W. and E.R. Hunt, 1993. Generalization of a forest ecosystem process model for other biomes, BIOME-BGC, and an application for global-scale models. In: Scaling physiological processes: Leaf to globe (J.R. Ehleringer and C.B. Field, Eds.). Academic Press, San Diego, 141-158.
doi: doi.org/10.1016/B978-0-12-233440-5.50014-2 Sacks W.J., D.S. Schimel and R.K. Monson, 2007.
Coupling between carbon cycling and climate in a high-elevation, subalpine forest: a model-data fusion analysis. Oecologia 151, 54-68.
doi: 10.1007/s00442-006-0565-2
Sánchez-León E., T. Castro, Ó. Peralta, H. Álvarez-Ospina, M. de la Luz-Espinosa and A. Martínez-Arroyo, 2016. Estimated carbon dioxide exchange for three native species in an ecological reserve of Mexico City. Atmós-fera 29, 189-196, doi: 10.20937/ATM.2016.29.03.01 Schlesinger W.H., 1997. Biogeochemistry: An analysis
of global change. Gulf Professional Publishing, Am-sterdam, 588 pp.
Schütz C., 1996. Eddy-Korrelationsmessungen von CO2
- Flüssen im Solling - Aufbau und Test eines Meßsys-tems. Thesis. Institut für Bioklimatologie, Georg-Au-gust-Universität, Göttingen.
SRES, 2000. IPCC special report emissions scenari-os-summary for policymakers. A Special Report of IPCC Working Group III, 27 pp.
Thomey M.L., S.L. Collins, R. Vargas, J.E. Johnson, R.F. Brown, D.O. Natvig and M.T. Friggens, 2011. Effect of precipitation variability on net primary production and soil respiration in a Chihuahuan desert grassland. Glob. Change Biol. 17, 1505-1515.
doi: 10.1111/j.1365-2486.2010.02363.x
Tirone G., S. Dore, G. Matteucci, S. Greco and R. Val-entini, 2003. Evergreen Mediterranean forests. Carbon and water fluxes, balances, ecological and energy of European forests. Springer Verlag, Berlin Heidelberg, 126-149 (Ecological Studies, 163).
Tworek T., 1996. Feldmessungen von turbulenten Trans-porten von Wasserdampf und Kohlendioxid über und
in einem Fichtenbestand. Thesis. Institut für Bioklima-tologie, Georg-August-Universität, Göttingen. Valentini R., G. Matteucci, A.J. Dolman, E. -D.
Schul-ze, C. Rebmann, E.J. Moors, A. Granier, P. Gross, N.O. Jensen, K. Pilegaard, A. Lindroth, A. Grelle, C. Bernhofer, T. Grünwald, M. Aubinet, R. Ceulemans, A.S. Kowalski, T. Vesala, Ü. Rannik, P. Berbigier, D. Loustau, J. Gu mundsson, H. Thorgeirsson, A. Ibrom, K. Morgenstern, R. Clement, J. Moncrieff, L. Montag-nani, S. Minerbi and P.G. Jarvis, 2000. Respiration as the main determinant of carbon balance in European forests. Nature 404, 861-865. doi:10.1038/35009084 Vargas R., S.L. Collins, M.L. Thomey, J.E. Johnson, R.F.
Brown, D.O. Natvig and M.T. Friggens, 2012. Pre-cipitation variability and fire influence the temporal
dynamics of soil CO2 efflux in an arid grassland. Glob.
Change Biol., 18, 1401-1411.
doi: 10.1111/j.1365-2486.2011.02628.x
Vargas R., E.A. Yépez, J.L. Andrade, G. Ángeles, T. Arredondo, A.E Castellanos., J. Delgado-Balbuena, J. Garatuza-Payán, E. González del Castillo, W. Oechel, J.C. Rodríguez, A. Sánchez-Azofeifa, E. Velasco, E.R. Vivoni and C. Watts, 2013. Progress and opportunities for monitoring greenhouse gases fluxes in Mexican ecosystems: the MexFlux network. Atmósfera 26, 325-336.
Vogt K.A., D. Vogt, S. Brown, J. Tilley, R. Edmonds, W. Silver and T. Siccama, 1995. Dynamics of forest floor and soil organic matter accumulation in boreal, tem-perate, and tropical forests. In: Soil management and greenhouse effect (R. Lal, J. Kimble, E. Levine and B.A. Stewart, Eds.). CRC Press, Boca Raton, 159-178. Zerva A. and M. Mencuccini, 2005. Short-term effects of
clearfelling on soil CO2, CH4 and NO2 fluxes in a Sitka
spruce plantation. Soil Biol. Biochem. 37, 2025-2036. Zerva A., T.M. Ball, K.A. Smith and M. Mencuccini,
2005. Soil carbon dynamics in a Sitka spruce (Picea
sitchensis [Bong.] Carr.) chronosequence on a peaty gley. Forest Ecol. Manag. 205, 227-240.