Electronic copy available at: http://ssrn.com/abstract=2521099
Master thesis Economics of Markets, Organization and Policy
Supervisor: Prof. Dr. J. van Sinderen
August 2007
T. C. Vermeulen – 265942tv
Detecting Collusion
Electronic copy available at: http://ssrn.com/abstract=2521099
Detecting Collusion
The Cartel Index applied to the Dutch economy
*T. C. Vermeulen† August 2007
Abstract
Illegal cartels and other collusive agreements are welfare reducing and exist everywhere in the economy. It is therefore important that we detect and prosecute such collusive behavior in order to increase the competitiveness of the economy. In this thesis a method is developed to detect the location of collusive behavior. This method, called the Cartel Index, can be used by competition authorities complementary to other instruments such as leniency programs.
The Cartel Index screens all sectors of the economy using nine easily measurable indicators of collusion. These indicators are selected from a comprehensive list of available indicators of collusion identified by theoretical and empirical literature. From these nine indicators an index is constructed which gives an indication of the likelihood of collusion existing in a certain sector.
With the use of publicly available data the index is then applied to the Dutch economy and compared to various other indices of competitiveness. It showed us that the index can help us to determine in which sectors collusion is most likely, but that a more thorough study of an identified sector is necessary to verify the existence of collusion.
The detection method developed in this thesis could be used by the Netherlands Competition Authority as a tool to prioritize sector investigations.
*A number of people have helped me writing this thesis. First of all, I would like to thank my supervisor Prof. Dr. Jarig van Sinderen for his
helpful comments on the detection method and for providing me with the possibility to write this thesis at the place where it all happens: the Netherlands Competition Authority (NMa). Secondly, I would like to thank my colleagues at the NMa‟s Office of the Chief Econo mist who provided me with useful comments and insights: in particular those of Madeline Buijs, with whom I‟ve worked together on this project and Ron Kemp. The attendees of the conference on detection methods held in May at the NMa, in particular Eric van Damme, are also tha nked for their useful tips. And last but not least, I‟d like to thank Maysam Hamdan for her support throughout the period I was writing this thesis.
† This thesis is submitted for the degree of Master of Science at the Erasmus University Rotterdam, faculty of Economics and Business Studies.
Contents
1. Introduction ... 4
2. Literature Review... 7
2.1. Definition of Collusion ... 7
2.2. Existing Literature on Screening Methods ...13
2.3. Indicators of Collusion ...18
2.4. Aggregation of the Indicators: Constructing an Index ...28
2.5. Conclusion...32
3. A Method to Detect Collusion: the Cartel Index...34
3.1. Selection of Usable Indicators ...34
3.2. Combining the Indicators into an Index ...35
3.3. Specification of the Cartel Index ...37
3.4. Handling Missing Data ...40
3.5. A Test of the Cartel Index on Hypothetical Markets ...42
3.6. Conclusion...43
4. The Cartel Index Applied to the Dutch Economy ...44
4.1. Data Description ...44
4.2. Data Processing ...45
4.3. Data Problems ...48
4.4. Results of the Cartel Index...50
4.5. The Cartel Index in Perspective ...55
4.6. Conclusion...60
5. Conclusion and Discussion ...61
Appendix A: Overview of Available Indicators of Collusion ...65
Appendix B: Measurement of Indicators Used in the Cartel Index ...74
Appendix C: Membership Functions of Indicators ...78
List of Figures and Tables
Figure 1: partial cartelization and the discount rate ...24Figure 2: example of a membership function...32
Figure 3: specification of the Cartel Index ...39
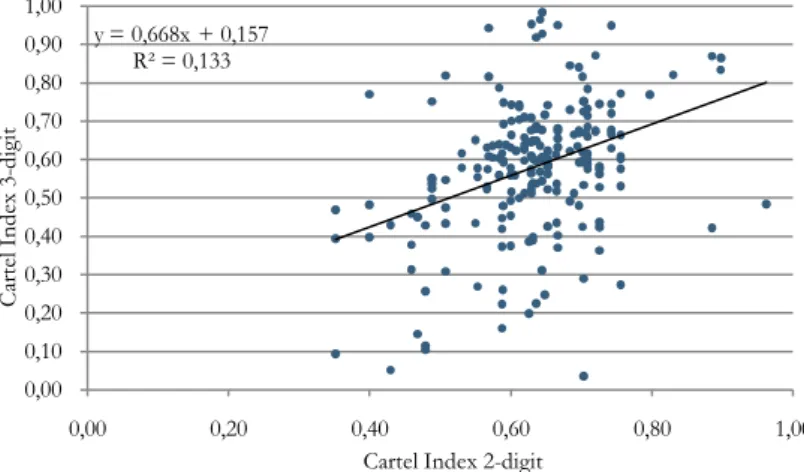
Figure 4: Cartel Index: 3-digit level vs. 2-digit level (2004 data) ...54
Figure 5: Cartel Index vs. Lerner Index (2004 data) ...56
Figure 6: Cartel Index vs. Grout & Sonderegger Index (2004 data; 1999-2003 data) ...57
Figure 7: Cartel Index and discovered cartels (2004 data; 1998-2007 data) ...58
Figure 8: specification of the advanced version of the Cartel Index...60
Table 1: pay-offs in the cartel game ...12
Table 2: selected indicators of the Cartel Index ...35
Table 3: data quality of indicators...42
Table 4: the Cartel Index applied to hypothetical markets ...43
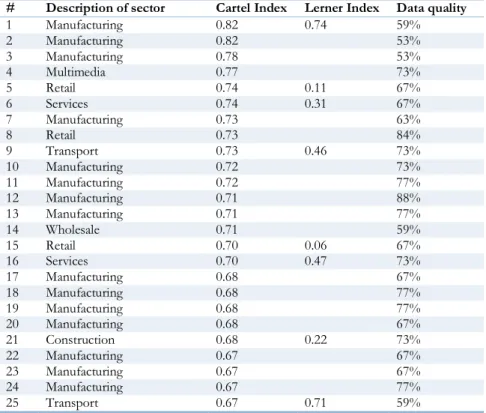
Table 5: results of the Cartel Index for the top-25 sectors (based on 2004 data) ...52
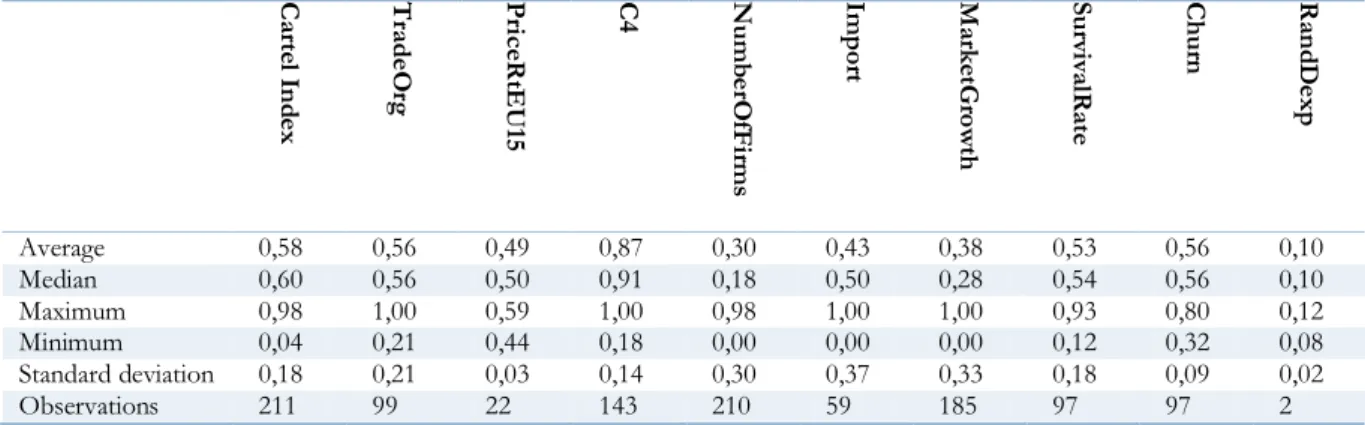
Table 6: descriptive statistics of the indicators at the 3-digit level (2004 data) ...53
Table 7: structural indicators ...66
Table 8: behavioral indicators ...70
4
1.
Introduction
Cartels and illegal price agreements exist everywhere in the economy. Sometimes these agreements are made during illegal meetings at the golf course, as can be seen on the FBI videotapes of the international Lysine cartel, sometimes this behavior is just common practice, like in the Dutch construction sector. Clearly, allowing firms to agree on a price which is above the competitive level is not efficient for the economy. It allows the producers to convert consumer surplus into producer surplus and, as a side-effect, creates a deadweight loss. Competition authorities all over the world do their best to discover and punish this behavior, which is thought to be decreasing welfare (Motta, 2004).
Until now, most competition authorities relied on signals from either consumers or competitors of cartels to detect collusion in a sector. In other words, authorities maintained a reactive policy on complaints of consumers and producers. Various tools are used to induce signaling by participants in the economy, such as the use of leniency programs which provide (partial) amnesty for reporting cartel members and a special telephone number for consumers to complain about firms that they suspect to collude.
The fact that these signals are for competition authorities the only source of leads to cartels makes them very dependent on these signals to detect collusion. If for some reason the number of complaints by consumers or the use of leniency programs declines in the future, the authority will have difficulties in keeping the economy as competitive as before. One could imagine that various sectors exist in which cartels are to a great extent common practice and will never be discovered using the conventional signals and leniency programs, because there are no incentives for the colluding firms or the customers to notify the conspiracy to the authority. Furthermore, the cartels that have been discovered using the signals or leniency programs could be the „old & dying‟ cartels which are badly organized; the well-designed and sophisticated cartels go undetected.
Therefore, competition authorities should develop a more pro-active attitude in determining in which markets collusion takes place. Instead of only reacting to signals received from the society, it would be wise to also develop a method that is independent of signals. An important point is that this method could be implemented complementary to the existing detection methods and thereby creates an additional way of finding collusion. This makes the authority more independent, increases its effectiveness and allows the authority to effectively fight cartels in the future.
The importance of such a detection method follows from the fact that in the Netherlands alone there are at least four research groups currently involved in this topic: the Netherlands Competition Authority (NMa), CPB, University of Amsterdam, and the Ministry of Economic Affairs. These groups came together at a conference at the NMa in May, 2006 to discuss new findings in the field and to align the direction of further development. Internationally many competition authorities are currently developing and testing detection methods, although most methods are still in early stages of research. The United Kingdom‟s Office of Fair Trading has published a trend-setting paper on screening (Grout & Sonderegger, 2005), while the Norwegian (following the approach of de Bronnet, et al) as well as the Italian competition authority (Esposito & Ferrero, 2006) are currently investigating the practical use of such methods.
5 sectors as possible for collusion. It should also be possible to carry out the investigation on a regular basis (say, yearly) to constantly monitor the economy for collusion. Examining every sector using the intensive method is obviously impossible. So, if our goal is to detect collusion in the economy, we have to find a method that strikes a balance between speed and accuracy.
This research forms one part of a project on cartel detection methods, carried out by the Netherlands Competition Authority. While doing research for this project, we have found out that one way to tackle the trade-off is to implement a two-step top-down approach. The first step of the method screens all sectors of the economy on sectors in which collusion could take place. Since a lot of sectors are involved, this step cannot be too complex and time- and data-intensive. Resulting from the screening step is a selection of sectors which have to be examined further to eliminate the false positives among them. This elimination procedure takes place in the second step, where a more complex and demanding method is applied. Thus, in the first step the focus is on speed (screening all sectors in a relatively easy way), while in the second step the focus is on accuracy (verifying a small set of sectors). The end result is a selection of sectors of the Dutch economy where collusion is likely to occur. In my thesis, I will try to find out how the first step of the detection method, called the screening step, should be designed.
Research question
The above introduction brings me to the following research question:
What is the best method available to screen an economy for collusion and what results would this method yield for the Dutch economy?
Methodology and structure
If we would like to develop a method that screens an economy for collusion, it is important to clearly define what collusion exactly is and what types of collusion we are searching for. In the first part of this thesis I will describe what kind of collusion we are trying to find and how collusion works theoretically. Next, I will give an overview of existing detection methods in the academic literature. Currently there exist a small amount of papers which try to develop a detection method, of which only a few are actually applied to the real world. These researches will be discussed and some remarks at these methods will be provided.
The next step is to try to determine what characterizes the collusive market vis-à-vis the competitive one. That is, we have to find market structure characteristics that help to support collusion, behavior of market participants that could indicate collusion and market outcome characteristics that point to collusion. Finding these so-called „collusive markers‟ can be done in two ways: by looking at relevant theories and at empirical evidence of discovered cartels. Using empirical data we can derive under what circumstances the cartels existed, how they behaved and in what way it changed the market outcome.
When we know what parts of existing screening methods are useful and which indicators can be used for screening, this information is combined into a new method. It will select sectors from the set of all sectors in an economy that are most likely to be subject to collusive behavior. Using a set of indicators that are evaluated per sector and a scoring system, a measure of the likelihood of collusion in a sector is created, called the Cartel Index. Unlike current literature which is often based on a very simplistic scoring system, the calculation of the index makes use of a more theoretically founded aggregation method.
6 of the detection method: is it easy to find data, how much work is it to process the data and what is its quality?
In the last part of this thesis I will evaluate the results of the application of the Cartel Index to the Dutch economy. The Cartel Index will be compared to various other measures of competition and collusion. Using data of previously discovered cartels in the Netherlands I will also test whether the developed method would have detected these cartels. The application, together with the evaluation, gives us insight into the usefulness of this screening method. We can check whether it provides the expected results, whether it discriminates enough between non-collusive and collusive sectors and shows us in which direction future detection methods have to be developed.
7
2.
Literature Review
If we would like to detect collusion, it is important to begin with a clear definition of collusion. What is collusion exactly and in what forms can it occur? This is the main question in the first section of this chapter.
The next section reviews relevant literature on the detection of collusion. The focus will be on methods that screen the economy for collusion. That is, we are looking for methods that scan the economy in a quick and easy way, as accurate as possible. In the last section various indicators of collusion are described. The goal is to find a set of indicators that help us to determine whether collusion takes place in a market or whether the market is competitive. These indicators can then be combined into one index, called the Cartel Index. The various options available to aggregate the indicators into an index will also be discussed. In short, this chapter forms the theoretical basis for the Cartel Index that will be developed in the next chapter.
2.1.
Definition of Collusion
In order to be able to detect cartels in an economy, we first need to understand why and in what ways cartels exist. Why are cartels being formed? When do cartels break down? How long do they usually operate? Under what circumstances is it easy for cartels to form? In this section I will try to answer these questions.
2.1.1. What is Collusion?
The simplest description of a cartel, or explicit collusive agreement, is the definition used by the United Kingdom‟s Office of Fair Trading: “(…) a cartel is an agreement between businesses not to compete with each other”. In the Dutch competition law („Mededingingswet‟) this definition is also used. According to the Dutch law, “all agreements between undertakings, decisions by associations of undertakings and concerted practices which may affect trade between Member States and which have as their object or effect the prevention, restriction or distortion of competition within the common market” are forbidden (Mededingingswet 1997, art. 6, sub 1 and Article 81 of the EC-treaty).
Restricting competition can be accomplished in a large number of ways, but can generally be classified in three categories: increasing the price, limiting output and the allocation of market shares. When firms make an explicit agreement, they can set the price at the level that would prevail when a single firm would exist on the market. This results in a higher price than under competition, a lower quantity of product supplied (demand declined because of the higher price) and larger profits for the cartel. Instead of setting the price to a fixed level, the agreement could also work via the quantities the firms supply. When firms agree to limit the overall output, this increases the price (the good becomes more scarce in the market) and eventually increases profits for the cartel. Another way to increase cartel profits for the cartel is to allocate parts of the market to their members, for example by dividing the market geographically. Each firm would then become a monopolist in its market and can set the price at the level it wants.
8 agreements are more difficult to sustain and arrive at than explicit agreements (Harrington Jr., 2005; Motta, 2004).
A second important distinction that can be made concerns the type of market cartels operate in. Generally, we can distinguish two types: „normal‟ markets in which business sell directly to customers or other businesses and set their own contract details and markets in which a public procurement procedure is used to sell products, as is usual in for example the construction sector. Until now, most cartels have been found in standard markets and collusion in such markets will have our primary focus. Because of a different mechanism underlying collusion in procurement auctions, our detection method is of limited use for such markets.
Whatever form of collusive agreement is used, the end-result of all forms of a cartel is the same: reaching higher profits than in the absence of the cartel. Logically one would say that „high profits‟ would make a great indicator for the detection of cartels. However, while the goal of the cartel is to increase profits (otherwise there would be little reason for the cartel to exist), most cartels are found in saturated markets where profits are relatively low. A market situation like this creates incentives to start a cartel and save the market from severe losses. Empirically, in most markets where cartels are active profits are lower than in other markets (Symeonidis, 2003). Therefore we must be very careful in using and interpreting the available indicators of collusion.
In this thesis we are looking for all kinds of agreements that restrict competition, as long as they are illegal by definition of Article 81. Not all agreements are illegal under Article 81. Explicit, hard-core cartels are obviously illegal, but it‟s not in all cases possible to prosecute firms that use no direct communication to reach the agreement. While these agreements are forbidden, they are often very difficult to prove (isn‟t there an alternative explanation that doesn‟t involve collusion) and to prosecute (Motta, 2004).
Now that we have defined what cartels are (agreements between undertakings that aim to restrict competition), we can analyze a theoretical model that describes how collusion works.
2.1.2. A Simple Model of Collusion
In our model, we assume that the ultimate goal of every firm is to maximize the profit it makes. Suppose several firms are competing with each other in a market on price. If firm 1 sets its price above marginal costs and makes profit, the best action of firm 2 is to set a price just below that of firm 1. This way, firm 2 attracts all demand from the market (if products are homogeneous) and makes profit. When firms compete this way, each firm tries to lower its price to make profits and this „race to the bottom‟ eventually results in the price being equal to marginal cost. No above-normal profits will be made and the market output is shared between all competing firms.
This outcome is the result when firms compete with which each other and no coordination takes place. If firms instead decide to coordinate their behavior through the use of a cartel, they will be able to make extra profits. They can for instance agree on a certain price for a product and promise not to set a price lower than the one agreed on. The result is that the product will be sold to customers for the fixed price, and the profits are shared between the members of the cartel.
9 If collusive agreements wouldn‟t be illegal, the agreement could be enforced by a legally binding contract. When a firm breaches the contract, the other firms could then rely on a court to enforce the agreement and punish the deviator. But since a cartel agreement is an illegal agreement, firms cannot rely on courts to keep their cartel together. Therefore cartels have to come up with a mechanism that makes sure it is in every firm‟s best interest to stick to the agreement and makes cheating unattractive.
According to economic literature, cartels can use a so-called „trigger-strategy‟ to align the incentives of the cartel members (Motta, 2004; Pepall, Richards, & Norman, 2005). The idea of this strategy is that cartel members punish a firm that deviates from the agreement. When firms know that they will be punished for their actions, they will not deviate in the first place and the cartel will continue to exist. Such an agreement is called a self-enforcing contract (Watson, 2002).
This trigger-strategy works as follows. Suppose several firms set up a cartel. This cartel allows the firms to fully coordinate their behavior and act as if it they are one firm. It can then set the price at the optimal level and share the profits between the members of the cartel. The optimal price is thus equal to the price a monopolist would set.
Every period each firm has two options: stick to the agreement or deviate from it. When it sticks to the agreement, the firm will obtain its share of the monopoly profit and the cartel will continue to exist. When it deviates, it will make excessively high profits and reduce the profits of the other cartel members. This is where the trigger-strategy comes into action. When the non-cheating firms observe the deviation, they should punish the deviating firm by starting a price-war and thus break the cartel. Since firms know that the cartel will respond with a price-war to their deviation, it is faced with a trade-off between cartel profits on one hand, and one-time high profits and a breakdown of the cartel on the other hand.
The important part of the trigger-strategy is the fact that it reduces the incentive for a firm to deviate in the first place. It recognizes that the extra short-run profit will come at the cost of the more distant cartel profits, because its deviation will break the cartel. Factors that influence this relationship between short-run profits of deviation and long-short-run cartel profits can indicate under what circumstances collusion is more likely to sustain. When for example the number of firms increases, the share of the cartel profits each member obtains will be lower and thus the relative extra profit that can be made by deviating increases. This makes deviation more tempting and the cartel less stable. Many of the indicators that we will use to determine the likelihood of the existence of collusion in a sector can be explained by the above relationship, as we will see in 2.3.2: In-Depth Explanation of Selected Indicators.
2.1.3. Game-Theoretical Model of Collusion
A more formal model of collusion that makes use of the trigger strategy increases our understanding of the theory and can serve as a formal basis to analyze the effect of indicators for collusion. Below, we will develop the model for a simple two-firm market in which the firms compete on quantity.
The goal of the model is to find under what conditions firms choose to cooperate with the cartel instead of deviating from the cartel agreement. To model this behavior, a standard Cournot model is used as described in Pepall, Richards & Norman (2005) and Watson (2002). In this model two firms, i and j, both produce the same homogeneous good. This divisible good is sold in one market, which is characterized by the following simplified linear demand function:
𝐷 𝑄 = 𝑝 = 1 − 𝑄
10
Cournot Duopoly
The two firms compete which each other in a Cournot fashion, which means that they set simultaneously and without cooperation the amount of goods they supply, denoted by 𝑞𝑖,𝑗. The subscript of the variable q indicates which firm, i or j, supplies which quantity. The total products supplied by the two firms
determine the price of the product in the market (𝑄 = 𝑞𝑖+ 𝑞𝑗). If we rewrite the demand function into the two-firm version, we get:
𝑝 = 1 − 𝑞𝑖+ 𝑞𝑗
Every firm makes a turnover equal to the supplied quantity multiplied by the market price. In order to keep the model simple, we will assume that the marginal costs per product are zero. If this is the case, profits are equal to turnover:
𝜋𝑖,𝑗= 𝑞𝑖,𝑗∙ 𝑝
Every firm tries to maximize its profits, 𝜋, by producing the optimal quantity q given the market demand function. However, the market price for the good is dependent on total supply, not the supply of one firm only. The amount one firm sells thus influences the profits of the other firm through the market price of the product. This interdependency can be written as follows:
𝜋𝑖= 𝑞𝑖∙ 1 − 𝑞𝑖− 𝑞𝑗 = 𝑞𝑖− 𝑞𝑖2− 𝑞𝑖𝑞𝑗
We can find the quantity that maximizes profit of firm i by taking the derivative with respect to 𝑞𝑖 of the above function and setting it equal to 0:
𝑑𝜋𝑖
𝑑𝑞𝑖 = 1 − 2𝑞𝑖− 𝑞𝑗 ≡ 0
Because both firms are identical (they have both zero marginal cost) they will behave the same. Furthermore, they are aware of the fact that there are only two identical firms in the market. If this is the case, the reaction curves of both players (the best response to the decision of the other player) are identical. We can obtain the reaction curves by solving the above equation, which yields:
𝑞𝑖∗=
1 − 𝑞𝑗
2 , 𝑞𝑗∗=
1 − 𝑞𝑖
2
The best response of each firm (denoted by the extra *) can be substituted into the best response function of the other player, since both firm are identical. This determines the Nash equilibrium. In this equilibrium none of the firms have an incentive to deviate by choosing a different output quantity. Thus, the stable equilibrium of a Cournot duopoly is given by:
𝑞𝑖∗=
1 −1 2 1 − 𝑞𝑖
2 =
1 3
The outcome of the market, for a Cournot duopoly in which no coordination takes place, then becomes:
𝑞𝑖∗= 𝑞
𝑗∗=
1 3
𝑄𝑑𝑢𝑜 =2 3
𝑝𝑑𝑢𝑜 = 1 −2
3=
1 3
11
Cartel
Although profits are made in the above Cournot oligopoly, in contrast with the situation under perfect competition where almost no profits are made, firms could strive for even more profits. To accomplish this, they have to coordinate their behavior. If firms perfectly coordinate their actions, they can act as if they were one firm. This way the firms internalize the negative externalities that are present in the duopoly situation, since in the Cournot model an expansion of output by one firm lowers the profit of the other firm.
We can model the cartel situation by determining the profit that would be made if there was only one firm in the market (monopoly). In a cartel, every member then produces their part of the quantity supplied under monopoly (in this case half the quantity) and profits are shared equally by the members of the cartel.
So, under monopoly the single firm would produce the following quantity:
𝐷 𝑄 = 𝑝 = 1 − 𝑞, 𝜋 = 𝑝 ∙ 𝑞 𝜋 = 𝑞 − 𝑞2
𝑑𝜋
𝑑𝑞= 1 − 2𝑞 ≡ 0 𝑞𝑚𝑜𝑛𝑜 =1
2, 𝑝
𝑚𝑜𝑛𝑜 =1
2, 𝜋
𝑚𝑜𝑛𝑜 =1
2∙
1
2=
1 4
Clearly, the profit under monopoly, 1
4, is larger than the total profit in the Cournot-duopoly situation, 2 ∙ 1 9.
If both cartel members agree to produce half of the quantity that would be supplied under a monopoly (1/4), they are able to obtain a profit of 1/8 instead of 1/9. The outcome in a cartel situation will be:
𝑞𝑖𝑐𝑎𝑟𝑡𝑒𝑙 = 𝑞
𝑗𝑐𝑎𝑟𝑡𝑒𝑙 =12∙ 𝑞𝑚𝑜𝑛𝑜 =14
𝑄𝑐𝑎𝑟𝑡𝑒𝑙 =1
2
𝑝𝑐𝑎𝑟𝑡𝑒𝑙 = 1 − 1
4+
1
4 =
1 2
𝜋𝑖𝑐𝑎𝑟𝑡𝑒𝑙 = 𝜋𝑗𝑐𝑎𝑟𝑡𝑒𝑙 =12∙14=18
Thus, coordinating behavior can improve the per-firm profit with 12.5%.
Cheating
As you might have noticed, the above denoted quantity supplied per firm in the cartel situation is not accompanied by a *. The reason is that an asterisk denotes a best response to the action of the other players in the market. However, a cartel suffers from a coordination problem because firms can gain extra profit by deviating from the agreed quantity. To see this, suppose firm j sticks to the agreement, but firm i
deviates. The best response of firm i will then be, given firm j‟s choice to produce the cartel quantity:
𝑞𝑖∗=1 − 𝑞𝑗
2 =
1 −1 4
2 =
3 8
Producing 3/8 instead of 1/4 will result in a decrease of the price and a decrease of the profit of firm j. The profit of firm i will however increase, otherwise producing 3/8 wouldn‟t be a best response in the first place. The outcome of the market when one of the firms cheats is:
𝑄𝑐𝑒𝑎𝑡 =1
4+
3
8=
5
8
𝑝𝑐𝑒𝑎𝑡 = 1 −5
8=
3 8
𝜋𝑖𝑐𝑒𝑎𝑡 =38∙38=649 (𝑐𝑒𝑎𝑡𝑒𝑟),
𝜋𝑗𝑐𝑒𝑎𝑡 =1
4∙
3
8=
6
12 By deviating from the agreement, firm i is able to increase its profit from 8/64 to 9/64 and thereby decreasing firm j‟s profit from 8/64 to 6/64. The cartel agreement in itself is not a stable agreement, since every participating firm has an incentive to deviate from the agreement and to make extra profits.
Trigger-Strategy
In short, a cartel agreement allows firms to increase their profit, but it is not a Nash equilibrium since firms always have an incentive to deviate from the agreement. Therefore the cartel has to come up with a mechanism that makes sure it is in every firm‟s best interest to stick to the agreement and to prevent the cartel from falling apart.
In the static setting described above such a mechanism is not possible. In reality however, cartels are better described as a dynamic process. Firms do not choose the quantity they produce once, but adjust the quantity continuously. So, every period firms make a decision on the quantity they will supply to the market. Since the game firms play is a dynamic instead of a static game, this allows the use of the so-called trigger-strategy. This strategy helps aligning the incentives of the cartel members and, under certain conditions, eliminates the incentive of firms to deviate from the cartel agreement.
The trigger-strategy works like this: every period a firm has two decisions. Either it sticks to the cartel agreement, or it deviates from the agreement. If it sticks, the profit will be equal to its share of the cartel profit, in our model 1/8 (=8/64). If it deviates it will obtain, provided the other firm produces the agreed cartel quantity, a profit of 9/64. In the table below the options both firms have each period are shown (including the expected profit it will make):
Firm j
Cheat Cooperate
F
ir
m
i Cheat 1/9, 1/9 9/64, 6/64
Cooperate 6/64, 9/64 1/8, 1/8
Table 1: pay-offs in the cartel game
If we look at the above table we can see that the best response to a cooperating player is to cheat on him. On the other hand, when the other player cheats the best response is again to cheat. Thus, the static Nash equilibrium is indeed characterized by a deviation of both firms, making both players worse off than when they both would cooperate. Knowing this, the firms can agree on the following trigger-strategy:
If the other firm sticks to the agreement, also stick to the agreement the next period.
If the other firm deviates from the agreement, start to compete forever by producing the standard Cournot duopoly quantity.
Now both firms face a more difficult choice each period. They have to trade off the one-time extra profits from deviation (9/64-1/8)m but losing the cartel profit forever, against keeping the cartel profit forever when it does not deviate. In other words, the choice it will make depends on the short-sightedness of the firm: does it value short-time extra profits more than the more distant cartel profits?
13
𝜋𝑡𝑐𝑒𝑎𝑡+ 𝛿𝜋𝑡+1𝑑𝑢𝑜+ 𝛿2𝜋𝑡+2𝑑𝑢𝑜+ ⋯ + 𝛿∞𝜋𝑡+∞𝑑𝑢𝑜 ≥ 𝜋𝑡𝑐𝑎𝑟𝑡𝑒𝑙+ 𝛿𝜋𝑡+1𝑐𝑎𝑟𝑡𝑒𝑙+ 𝛿2𝜋𝑡+2𝑐𝑎𝑟𝑡𝑒𝑙+ ⋯ + 𝛿∞𝜋𝑡+∞𝑐𝑎𝑟𝑡𝑒𝑙
Which we can rewrite into a shorter expression:
𝜋𝑐𝑒𝑎𝑡+𝛿 ∙ 𝜋𝑑𝑢𝑜
1 − 𝛿 ≥
𝜋𝑐𝑎𝑟𝑡𝑒𝑙
1 − 𝛿
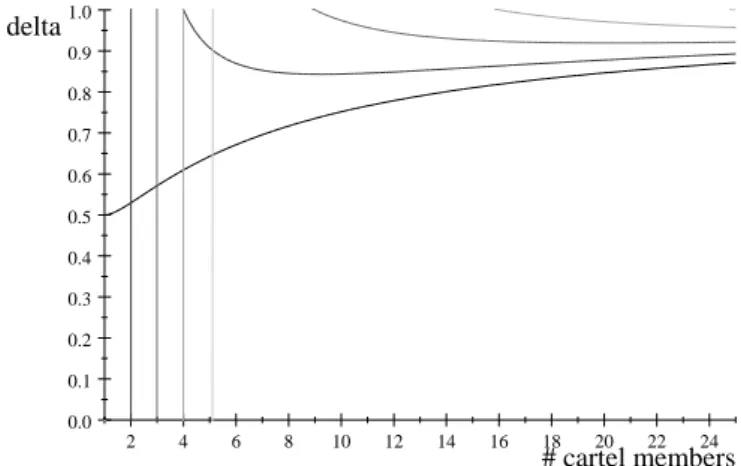
This expression shows the relation between the profit a firm gets when it deviates and the profit it will get when it cooperates. The discount factor δ plays an important role, since it determines under what condition the firm will choose to cheat and when it will cooperate. Because we know exactly the size of the profits received by the cartel, duopoly and when a firm cheats, we can calculate the discount factor:
9 64+
𝛿 9 1 − 𝛿 ≥
1 8 1 − 𝛿 𝛿 ≤ 9
17
Apparently, a firm is only willing to cooperate with the cartel when the discount factor is larger than 9/17. In other words, if the discount factor is too low, the firm values short term profits more than long term profits and it will cheat on the agreement. Generally speaking, the higher the discount factor δ is, the harder it is to keep the cartel stable. Suppose that cartel profits are only slightly higher than the profits that firms get when they compete with each other. The discount factor will then increase to almost 1 and firms have to be very patient (i.e. they value future cartel profits highly) in order not to deviate and break down the cartel.
The above explained formal model of collusion can be used to analyze the effect of various indicators on the stability of cartels. For example, is the minimum required discount rate for the existence of cartels higher or lower in larger markets? If we know what the effect of indicators on cartel stability is, we can use this knowledge do determine what kind of markets are most suspect to collusion. In section 2.3.2 we will extend the above model to analyze the effect on collusion of various indicators used by the Cartel Index.
2.2.
Existing Literature on Screening Methods
Now that we have defined what we‟re exactly looking for and know some more about the way cartels work, we are ready to examine previously developed models on cartel detection. According to Harrington Jr. (2005) the detection of cartels should involve three steps: screening, verification and prosecution. In the screening stage, relatively simple indicators are used to screen as much sectors of the economy, in a time- and data-efficient way. Grout & Sonderegger (2005) is representative for this approach. The goal of screening is to provide candidate sectors as input for the next step, the verification process. The verification method uses more complex indicators to check whether collusion is really present or not. Since it is by definition a more data- and time-intensive method, it can only be applied to a limited number of sectors or relevant markets. An example of such a method is the variance screen, developed by Abrantes-Metz et al (2006). The last step, prosecution, involves gathering proof of the illegal behavior. Although verification rules out any false positives that have been selected in the screening step, the results of verification often do not provide enough legal proof. Additional proof has to be obtained via for example raids and taps.
The benefits of Harrington‟s three-step approach are apparent. It allows us to find cartels in every sector in the economy, not just the ones that are most likely beforehand. The verification step makes sure that there are no false positives selected. This way, the method is both fast and accurate.
14 described in the working paper of the Netherlands Competition Authority (NMa), of which this research forms the first part (NMa, 2007).
2.2.1. What is Screening?
The goal of screening is to select in a relatively easy way the sectors in which the probability of collusive behavior is the highest. These selected sectors could then serve as input for the verification process, in which falsely selected sectors are ruled out.
In my view, screening has three important requirements: 1) as much sectors as possible have to be examined, 2) the accuracy of the method has to be as high as possible and 3) it should be possible to carry out the screening in limited time and with minimal data requirements. It is clear that these requirements conflict with each other: if you want to determine the existence of a cartel with high accuracy, you need a lot of detailed data about the market in which it operates. If one would carry out such an investigation for as much sectors in the economy as possible, this would take years to complete.
Therefore we need to strike a balance between these requirements. We need to search for indicators that provide valuable information on the likelihood of collusion, but for which data are easy to collect. By looking at theoretical pointers for collusion and by analyzing the characteristics of discovered cartels, we can obtain such indicators.
The actual screening method consists of two parts. The basis of the method is formed by measurable variables which indicate collusion. Examples of such variables are the degree of concentration and the existence of entry barriers. In the literature reviewed later on, I will discuss three sources of such indicators.
The first source is economic literature. A lot of research has been done on the impact of various market characteristics on the likelihood of collusion. Game theoretical models, such as mentioned above, are often used to explain collusion.
The second source of indicators is derived from the (market-) characteristics of discovered cartels. By analyzing in what type of markets they usually operate and what the characteristics are of markets in which no cartels are present, we can learn when it is easier for cartels to operate and when not. We can then look for sectors that show these characteristics, but in which no cartel has been found yet. The chance of finding a cartel in such as sector is higher than in sectors without these characteristics1.
A third source of indicators is obtained by examining previous screening methods. What indicators do they use and do these indicators prove successful? Studies such as those of Grout & Sonderegger (2005), de Bronett et al and NERA (2004) contain a list of possible indicators that can be used to screen the economy. Most of the indicators they use are collected from the other two sources, economic literature and empirical studies. The three sources of indicators provide us with an extensive list of possible indicators. Whether they can actually be applied in our screening method is dependent of the availability of sufficient data.
The second part of the screening method is a technique combine the single indicators into one number that describes how likely collusion is in a particular sector. In most screening methods a weighted average is used to aggregate the indicators. The weight each indicator gets in the calculation of the average is often based on the results of a regression on discovered cartels. A disadvantage of this approach is that it creates a bias towards discovered cartels, which may not always show the same characteristics of yet to be found cartels. Also, it neglects the effect one indicator can have on another indicator. Therefore, I will discuss an aggregation method that can account for the interdependencies between indicators.
1 Obviously, we only know the characteristics of cartels that have already been discovered. It could be the case that cartels that aren‟t discovered
15 The goal and final result of the screening method is an index that provides an estimate of the probability of collusion in a particular sector. I will call this index the „Cartel Index‟.
2.2.2. Current Literature on Screening
Only a small amount of articles has yet been written on screening. Most of these researches have been carried out by competition authorities, such as the Office of Fair Trading and the Netherlands Competition Authority and follow more or less the same approach. We will use these studies to provide us insight into the usefulness of the various methods. This allows us to use the good features of each method in our cartel index and helps us to avoid problems encountered by previous studies. Below I will discuss the existing studies on screening and highlight the pros and cons of each approach.
Grout en Sonderegger (2005) – Predicting Cartels
„Predicting cartels‟ written by Grout and Sonderegger (2005) is one of the most important articles that has been written on screening. Because the research is initiated by the UK‟s Office of Fair Trading, the focus of the research is on the practical applicability of the screening method. In contrast to some other more theoretical screening methods, this method can easily be applied to an economy in order to find cartels. The application itself, as described by Grout & Sonderegger, provides us with important information about the difficulties attached to the application of the method.
Grout & Sonderegger use, like we will with our cartel index, indicators to screen the economy for collusion. They obtain from various sources a list of indicators that can identify the existence of cartels. These indicators are then used to make an estimate of the probability of the existence of a cartel in a particular sector. Most of the indicators Grout & Sonderegger use are obtained from the economic literature on collusion. When an indicator is present in a sector, such as a small number of firms, it increases the probability of collusion in such a sector. When the number of firms is large, the chance of finding a cartel is lower. Another source of indicators is the analysis of case-studies of discovered cartels. If markets in which cartels operate share certain characteristics which are not found in sectors in which no cartels are present, these characteristics can be used as indicators. When markets have these characteristics, but in which no cartel is discovered yet, the probability of finding a cartel is higher than in markets without these characteristics.
In order to screen an economy for cartels we need, besides a list of indicators, also information on the strength and direction of each indicator. For instance, does the number of firms decrease or increase the likelihood of finding a cartel and is the effect stronger than another indicator, such as the presence of entry barriers? In other words, to construct an index that estimates the probability of a cartel we do not only need the variables, but also the weight of each variable.
Grout & Sonderegger obtain these weights by using a regression analysis. The regression is carried out on the 3-digit industry level2, with „the existence of a cartel‟ as the variable that has to be explained and the various indicators as explanatory variables. This allows them to determine which indicator is valuable in explaining the existence of cartels, and which indicators have only a small explanatory power. For our index this is valuable information, because it allows us to select only those indicators that are proven to be valuable in assessing the probability of finding a cartel.
In the last part of the study, Grout & Sonderegger apply the results of the regression analysis to the British economy. Their logit model resulted for each sector in a number between 0 and 1 that indicates what the probability of collusion in that sector is. If the sectors in which already a cartel has been found are discarded from this list, a list of sectors in which no cartel has yet been found results, together with the probability of the existence of a cartel. In the sector that has the highest probability value, the
16 likelihood of finding a cartel is greatest. This analysis provides a start in the detection of collusion in the British economy, although the accuracy isn‟t likely to be very high.
The low accuracy of Grout and Sonderegger‟s estimate is due to a few measurement errors in their analysis. First of all, the dependent variable (the existence of cartels) is based on data from the United States and the European Union, while the independent variables (the indicators) are based on British data. Clearly, this is a bit strange: British market characteristics are used to explain the location of cartels in the US and EU. The authors defend this methodology by stating that the locations of cartels in different countries are strongly correlated. If a cartel has been found in a particular sector in the US, the chance is 67.8% that there is a cartel present in the exact same sector in the EU. Because of this strong correlation, the location of cartels in the US can be used as an approximation for the location of cartels in Britain. This measurement error is further reduced, because the characteristics of the sectors are quite identical between the US and the EU. For example, turnover is correlated for 92% and the number of firms show a correlation of 98%. One reason for this approach could be that the dataset of discovered cartels is much larger when we look at the EU and US, instead of looking only at British cartels. If the location of cartels is strongly correlated and the market characteristics are also correlated, using the broader dataset decreases the chance that a sector is incorrectly marked as cartel-free. However, it is still unclear why Grout & Sonderegger didn‟t just use British data as input for the analysis, since it avoids the above mentioned measurement errors3.
Another measurement error is caused by the fact that the explained variable is measured using discovered
cartels, instead of the unknown existence of cartels. Using this dependent variable the regression analysis helps explaining the characteristics of found cartels. However, when we screen an economy we are not looking for discovered cartels, but for cartels which haven‟t been discovered yet. While it is likely that the discovered cartels have more or less the same features as the undiscovered ones, we‟re not sure whether this is actually the case. It could be that undiscovered cartels are more sophisticated and operate in a different way. Unfortunately, this measurement error is hard to avoid, because the only available data are that on discovered cartels. And, compared to the measurement errors in de explanatory variables, this error is probably quite small. Still, we can avoid this bias in our Cartel Index by trying not to rely too much on the results of regression-based analyses which have discovered cartels as the dependent variable.
NERA (2004) – Empirical Indicators for Market Investigations
The study carried out by NERA (2004) is an important source of indicators for the Grout and Sonderegger study. The Office of Fair Trading gave NERA, an economic research company, the assignment to scan the British economy for sectors that do not function well for consumers.
This study resulted in a large list of indicators that are identified by the theory as collusive markers. Examples of such indicators are the degree of concentration, the existence of entry barriers and the productivity of a sector. For each indicator the necessary data are obtained and an assessment of each sector based on the indicator is shown.
The results per indicator are not combined into one index in NERA‟s study. However, they provide some suggestions on how this could be done: by assigning the value „1‟ if a sector makes is to the top-10 for a particular indicator and then summing up these values for each sector over the various indicators. The sector with the highest score is then assumed to be the one which functions worst for consumers. Another method they suggest is to calculate a weighted average of the scores of each sector for each indicator. Although in the end no general index is calculated, the study of NERA provides us with important knowledge. Because they actually tried to obtain data for each indicator, we know which sources we could use for each indicators and which problems are related to these sources. Also, they give some warnings on
17 the explanatory value of an analysis on the 3- or 4-digit level, since a sector on this level is still not very close to the actual relevant market in which a cartel operates.
De Bronett et al (n. d.) – A Framework for Initiating Ex-Officio Cartel Investigations
A Framework for Initiating Ex-Officio Cartel Investigations by de Bronett et al (n.d.) is an attempt of the European Commission to develop a screening method. The method consists of two steps, as proposed by Harrington Jr. (2005): a screening step and a verification step. In the screening step a rough selection of the most suspect sectors is made, which are then verified for the existence of collusion in the second step. For our Cartel Index, the screening step is the most important one.
The EC‟s screening step uses more or less the same approach as the study of Grout and Sonderegger. From theoretical literature such as Motta (2004), but also from other detection methods such as NERA (2004) and Harrington Jr. (2005), a set of indicators is obtained. Examples of such indicators are the C4-ratio, the amount of symmetry between firms, price increases and the existence of entry barriers. The fourteen indicators are then grouped into four categories: price, transparency, concentration and entry. Furthermore, the indicators are also classified into primary and secondary indicators, based on their importance in the detection of cartels.
Each indicator is formulated as a question that can be answered with yes or no. When a question is true for a sector it scores a number of points, depending on whether it is a primary or a secondary indicator. If a primary indicator is true, it adds five points to the total score and if a secondary one is true it adds two. For example, if the question is: “Is the market highly concentrated?”, and the market is indeed concentrated, the sector under investigation scores five points. For all sectors under investigation the fourteen questions are answered. Those sectors that score at least 40 points in total and of which at least 25 are scored through primary indicators, will be marked as suspect and will be closely investigated in the second step with the help of more advanced methods.
In principle the article by de Bronett et al provides us with indicators that we can use for our cartel index. However, many of the indicators seem quite time- and data-consuming to measure. Concentration for example is quite easy to determine, but the correlation between price and demand is very hard to measure for more than 200 sectors. Since the authors do not apply the method on the real world the article has little practical value for us.
Van Bergeijk & Gerritse (2005) – Risks of Nonfunctioning Markets 2005 (transl.)
In 2005 the Netherlands Competition Authority has designed is own method as a first attempt to screen for nonfunctioning markets. The method makes use of three indicators: the number of firms in a sector, the per-firm profit in a sector and the price-cost margin. These indicators are, excluding the number of firms, considered inappropriate for use in methods that screen for cartels. High profits can have various alternate explanations and does not have to indicate a nonfunctioning market. Furthermore, a high price-cost margin points at market power, which does not always imply collusion.
In order to obtain a measure per sector that shows to what extent a sector is not functioning, van Bergeijk & Gerritse rank each sector per indicator. If a sector belongs to the top-10 it gets two points and when it belongs to the top-20 it gets one point. Thus, the maximum point a sector can score is six and the minimum is 0. The sectors that score the most points are considered to be least functioning. This method of aggregating the indicators can be compared to the one de Bronett et al use and is also suggested in NERA (2004).
18 Therefore, sectors that have a more narrow definition are more likely to be identified as nonfunctioning than broader ones.
Concluding, we can say that most methods on screening use the same approach. They all involve a set of simple indicators that can be used to identify collusive behavior in sectors of the economy. In some cases, an index is constructed from these indicators to provide a single judgment per sector on the probability of collusion. The described methods provided us with information on the type of indicators we can use for our cartel index and how we could aggregate the indicators into an index. Furthermore, the problems these studies came across with the collection of data and interpretation of the results increases our awareness of the difficulties involved with sector-based screening and helps us to avoid them.
2.3.
Indicators of Collusion
Like most screening methods do, we will make use of indicators to determine in which sector the likelihood of collusive behavior is largest. Indicators of collusion can be obtained from three types of researches: literature on existing screening methods, economic theory on collusion and empirical studies on the characteristics of cartels.
The most important studies of which we can derive useful indicators are described and an in-depth examination of a selection of the indicators is provided below. The full list of indicators identified by current literature is can be found in Appendix A: Overview of Available Indicators of Collusion.
2.3.1. Literature as a Source of Indicators
The literature that we use to derive useful indicators of collusion can be categorized into three groups. Theoretical literature examines using models and theories how collusion works and under what circumstances collusion is most likely. In other words, it predicts ex-ante which indicators can be used for our screening method. In contrast, empirical literature uses data on discovered cartels to determine which properties markets and cartels have and derives useful indicators from this information. One could say that this is an ex-post approach to finding indicators of collusion. Finally, the screening literature provides us with insight into which indicators are valuable in the use of a simple and quick screening method.
Screening Literature as a Source of Indicators
From the methods that other researchers have used to screen an economy for collusion we can learn which indicators are useful and which are not. These studies obtained their indicators from empirical and theoretical literature. For example, NERA (2004) compiled a large list of possible indicators together with an assessment of the availability of data for each indicator. They find that concentration, profitability, churn (the degree of entry and exit) and productivity are useful indicators.
Grout & Sonderegger (2005) use three ways of finding indicators for their screening method. First of all, they use theoretical literature on collusion to determine which indicators are useful. Based on this literature, they find that that the number of firms, the existence of entry barriers, stable demand and a transparent market are strong indicators of collusion.
Next, they also carry out case-studies to determine which characteristics market have in which cartels usually operate. Entry barriers, symmetries between firms and easy communication are factors that help cartels to exist. They also mention that cartels are often found in markets where a homogeneous product is sold, but this indicator is difficult to use in screening since it is hard to measure for a large number of sectors.
19 cartels are observed, it could be that those cartels broke down because of the non-existence of entry barriers.
The analysis of Grout & Sonderegger provides us with a large number of indicators. However, a drawback of the research is that the relation between the theoretical literature, the case-studies and the empirical regression analysis is not entirely clear. Some indicators that are found in the theoretical literature are not used in the regression analysis and the regression analysis uses indicators of which is not clear where they come from. Because the three sources come up with different indicators that are marked as important, it is hard to say which indicators we should use for our cartel index.
Droste & Zonderland (2006) carried out a research for the Netherlands Competition Authority on indicators that can be used to screen for breaches of the Dutch competition law. They use a number of theoretical sources to identify fourteen indicators. Many of these indicators are also found in NERA and Grout & Sonderegger, such as concentration and symmetry. With each indicator, they provide an overview of the theory behind the indicator and make an assessment of the practical applicability. At the end of the study a summary is given in which each indicator is assessed on three criteria: whether the indicator is unambiguous, its relevance for competition cases and the availability of data. While this helps us with the selection of indicators, I think that their view on data availability might be too optimistic.
Theoretical Literature as a Source of Indicators
Theoretical literature on collusion can provide us with insights on how collusion works and under what circumstances it works best. Economic models are used to predict, rather than to determine as with empirical literature, which indicators can be used to detect collusion.
The main theoretical source of indicators is Motta‟s book „Competition policy: theory and practice‟ (2004). He explains each indicator using the game-theoretical model discussed earlier and summarizes the currently available theoretical literature per indicator.
In the game-theoretical model, each firm makes a trade-off between the one-time extra profits the firm can get by deviating from the cartel agreement, against the infinite cartel profits it would get otherwise (see also 2.1.2: A Simple Model of Collusion). If these one-time profits are large compared to the extra profits that can be made through the cartel agreement, the firm has an incentive to break the cartel. Every indicator, such as concentration and the number of firms, is explained using this simple relationship between the profit of cheating and the cartel profits.
Some of the indicators are also explained in a formalized model. With the use of a Bertrand duopoly model of price-competition on a homogeneous product the way the indicators work is illustrated. Like us, using a model on price competition rather than our model on quantity competition, he finds that the number of firms reduces the incentive to stay in the cartel. So, the larger the number of firms, the less likely it is that a cartel exists in a market.
Although Motta‟s book sets the standard for competition authorities, it also has a disadvantage as a source of indicators. Because the indicators are very theoretical in nature, it could be that the effect of these indicators in reality is smaller than suggested by theory. It seems that many of the indicators Motta suggests do not show up in the case-studies on discovered cartels and regression analyses such as that of Grout & Sonderegger.
20
Empirical Literature as a Source of Indicators
Discovered cartels can provide us with valuable information on the characteristics of cartels and the markets they typically operate in. When we know what common features cartels and their markets share, we can search in the economy for markets that have these characteristics, but in which no cartel has been found yet. Examples of such indicators are the type of products cartels usually sell and what happened with the prices after the cartel formed.
There are four important articles in which the characteristics of cartels are studied. However, the methodology and object of study differs between the articles. One article tries to explain what factors have influenced the breakdown of a cartel, while other articles focus more on the formation of cartels. When we interpret the results of these studies in the right way, they form a good source of indicators. Below we will discuss the methodological approach of each study.
Connor (2003) has carried out the most extensive research on discovered cartels. In his study he analyzes 100 cartels that have been found in the world between now and 1990. The focus is on cartels that operated on an international level.
Connor‟s results have to be interpreted carefully. First of all, our Cartel Index is mainly focusing on Dutch national cartels. Because Connor‟s focus is on international cartels, this can create a bias. Another source of bias is that by studying the features of discovered cartels, we only get to know the characteristics of this type of cartels. It could be that „smart‟ cartels, or undiscovered cartels, have different properties. If we focus too much on discovered cartels, we could overlook the features of undiscovered ones. When we keep in mind these considerations, Connor‟s study is a great source of indicators.
Next to the study on the common properties of the 100 cartels, Connor also examines three well-known cartels in detail: the lysine cartel, the citric acid cartel and the vitamin cartel. Due to the use of an informant a lot of information is gathered on the daily operations of these cartels. Furthermore, a couple of common characteristics of the cartels are found. All three markets showed a very high degree of concentration, a low buyer-concentration, the firms sold a homogeneous product, barriers were high and the cartel consisted of a small number of firms.
In Bush, Connor, Flynn et al (2004) more characteristics of the vitamin cartel are described, which are seen as general properties of international cartels. The authors mention that most cartels operate in industrial sectors and that a surprisingly large part of them sells organic chemicals. A large proportion of turnover is made outside the United States and the European Union, while the headquarters of the cartel are often located in Japan or in the European Union.
Bush, Connor and Flynn also note that because of the often homogeneous nature of the products cartels sell, the cartel members have problems to prevent international arbitrage. If the market is geographically divided (that is, each member of the cartel sells exclusively to their assigned territory), the products are priced differently in each region. This creates an incentive for customers to buy the product in the cheapest country and import it to their home country. Such arbitrage creates pressure on the cartel, because it creates competition between them. Therefore cartels have to come up with a mechanism to prevent international arbitrage.
Symeonidis (2003) focuses on cartels that have been found in the fifties in the United Kingdom. He tries to find out under what market circumstances the formation of cartels is most likely. Through the use of a regression analysis, the influence of each factor on cartels is measured.
21 the Netherlands before the competition authority came into force, companies were required to register their agreements. On the basis of the amount of damage an agreement could do, a decision was made whether the agreement would be allowed or not. Because of the fact that firms notified the government of their agreements voluntary, the explained variable is much more accurate. Not only prosecuted cartels are measured, but almost all collusive behavior. According to Symeonidis, almost half of the 4-digit sectors he studied contained some form of collusion.
A disadvantage of his approach is that the dataset only contains industrial sectors and is based on data from the fifties. It is very likely that cartels have evolved over time and now work in a different way than fifty years ago. Although some characteristics are probably still the same, such as concentration and the number of firms, the internationalization of the economy and easier communication are likely to have their influences on the operation of cartels (Connor, 2003). Therefore, we have to be careful with the use of his results in the detection of modern cartels.
The main result of the Symeonidis‟ study is the observation that entry barriers play a large role in the formation of cartels. Factors that seem to be important in other studies, such as high concentration, seem to matter a bit less in Symeonidis‟ study. This could be due to the fact that the cartels that Symeonidis investigates were not completely illegal at that time. When price agreements are illegal, firms have to design a mechanism that makes sure no one is willing to deviate from the agreement (the trigger-strategy described earlier). In the fifties these agreements were legal, so the firms could just rely on an external court to enforce the agreement. This changes the game that is played by the cartel members, and cartels are very likely to have different characteristics in both situations. For example, it is easier to make an agreement with a large number of players when the agreements are externally enforced than when the cartel must rely on an internal mechanism, because in the former situation no firm has an incentive to deviate. Thus, concentration has a smaller influence on the existence of cartels. Entry barriers however, play an important role in both situations because the cartel can be broken by a large entrant that competes with the cartel.
Levenstein & Suslow (2002) carry out a meta-analysis of existing empirical studies on the properties of discovered cartels. The question they try to answer is what factors determine the success of a cartel. By comparing the results of previous studies they try to find out which characteristics come up strongly in most studies and seem to matter only in specific studies. Furthermore, Levenstein & Suslow also examine a couple of case-studies and they try to find out whether the cartels that have been found in the last years are different from older cartels.
The comparison of cross-section empirical analyses from the seventies all yield more or less the same result: cartels are often made up of only a few firms, the concentration in the market is high and the cartel sells a homogeneous product. Unfortunately the methodology, object of interest and chosen explanatory variables differ a lot between these researches. This makes it hard to make a consistent comparison and limits us to simple eyeballing of the data.
Levenstein & Suslow‟s case-studies don‟t provide us with many new indicators either. However, one interesting observation can be made based on their study: cartels often break down – almost 50% – because of a deviation from the agreement by one of the participating firms. This means that the game-theoretical model of collusion described earlier in reality does make sense. In markets where theory suggests that cartels are more likely to exist, the probability of finding a cartel is larger.