Breast Asymmetry Analysis employing Tree-Structured Wavelet Transform
E. Sorensen (a), L. A. Cairo (a), M. Santiago (a, b), E. Caselli (a, c), and L.P. Gutierrez (a)
(a) Instituto de Física Arroyo Seco, Universidad Nacional del Centro de la Provincia de Buenos Aires, Pinto 399, 7000, Tandil, Argentina
(b) Consejo Nacional de Investigaciones Científicas y Técnicas (CONICET)
(c) Comisión de Investigaciones Científicas de la Provincia de Buenos Aires (CICPBA), [email protected]
Keywords: breast asymmetry, wavelet transform, digital mammography, computer aided diagnosis
Abstract
1. Introduction
It is generally accepted that symmetrical development of paired body structures is an indicator of good health in bilaterally symmetrical organisms (Rasmusen, 1960). Deviations from symmetry appear either as major errors, such as conspicuous birth defects, or as minor randomly-distributed deviations (Ludwig, 1932), which are dubbed fluctuating asymmetry (FA). High FA has been found in several physical and mental diseases, such as Down's syndrome (Townsend, 1983), trisomy (Colasino, 1978), cleft lip and palate (Adams, 1967), autism (Campbell, 1978), schizophrenia (Markow, 1986), etc. Since breasts are also symmetrical body structures, investigations were carried out in order to determine whether cancer predisposition is related to breast asymmetry. In particular, it was found that dimensional (length, width and volume) and shape breast asymmetries are an indicator of the risk of developing breast cancer (Scutt, 1997). Apart from the physical features of breasts, mammography has become and important tool for early detection of breast cancer. Mammography has been applied successfully in screening programs on large populations of women and much effort has been given to the investigation of computer-aided methods for digital filtering of mammograms in order to detect incipient breast tumors (Gulsrud, 1996). Computer aided diagnosis (CAD) is by now a useful complementary tool which can be added to routine diagnosis protocols to improve radiologist's performance for detecting subtle, small, malignant masses in breasts. Although most of the reported methods for digital filtering relay on the isolation of punctual-shaped formations associated to microcalcifications and circumscribed masses, there has recently been an increased interest in the use of texture analysis to identify suspicious extended masses in mammograms. For instance, Gupta et al. applied a segmentation filter based on the Laws filter masks to improve the detection of stellate and regular masses (Gupta, 1995). Gulsrud et al. presented a method for texture segmentation of digital mammograms that uses a single filter which is optimal with respect to the Fisher criterion, instead of a filter bank approach (Gulsrud, 1996). Among the algorithms developed so far for characterization and classification of general textures, there has been an increasing interest in those based on wavelet transform. Wavelet transform uses a multiresolution approach for image decomposition, which allows for the information contained not only in the low-frequency channels, but also in the medium-frequency channels which often bear most of the information contained in textures (Chang, 1993). On this trend, Ferrari et al. recently reported the investigation of asymmetries in mammograms by employing wavelet-based directional filtering (Ferrari, 2001). In that work, non-orthogonal Gabor wavelets were used to compare directional structures appearing in the left- and right-breast mammograms in order to detect cancer-related abnormalities. Although the performance of the method is acceptable, it has the drawback of using a non-orthogonal basis, which generates redundant information through the decomposition process, and further the method is reported to be time-consuming.
In what follows, the TSWT is briefly explained, then its application to a practical case is presented, and, finally, the general results arising from the analysis of the aforementioned women population are shown and discussed.
2. Tree-Structured Wavelet Transform
The 2-D wavelet transform algorithm consists basically in the iterative decomposition of a 2n × 2n pixels image by means of a 2-D wavelet basis. A 2-D wavelet basis is built up by the tensor product of two 1-D wavelet basis along the horizontal and vertical directions (Chang, 1993). As a final result of a decomposition iteration of the original image, four 2 n−1× 2 n−1sub-images are obtained. The first one (HH or high channel) contains the information corresponding to the high-frequency components in both axes and the second one (LL or low-low channel) the information of the low-frequency components also in both axes. The two remaining sub-images bear the information of those components lying into the middle-frequency region, and are termed either LH or HL depending on the axis the low- and the high-frequency channels correspond to. Actually, as result of a one-iteration decomposition four sets of wavelet coefficients are obtained. Each set corresponds to each frequency channel, and from them the four mentioned sub-images can be later reconstructed.
The usual wavelet decomposition, known as pyramid-structured wavelet transform (PSWT), continues the process only on the LL sub-images, decomposing the original image into a set of frequency channels that have narrower bandwidths in the lower frequency region. This transform is suitable for images consisting primarily of smooth components. In contrast to the PSWT algorithm, the TSWT follows through the decomposition process on those channels that are significant, say, on those having the most of the information contained in the original image. This discrimination step is achieved by calculating the energy e of each sub-image. In this work we resorted to the averaged l1
-norm for this purpose:
( )
∑ ∑
= = = N i M j j i x NM e 1 1 , 1 ,where N and M are the dimensions of the sub-image, and x stands for its wavelet coefficients. Although there exist other norms, the l1-norm was chosen due to its simplicity and good
performance. Once the energy of each sub-image has been calculated, the next decomposition iteration is performed only on those channels which satisfy the condition e > CeMAX, where eMAX
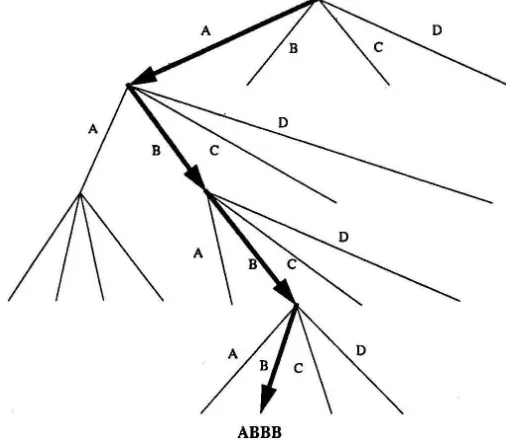
4-level channels appearing in the energy map will be ABBA, ABBC and ABBD, each at its corresponding position in the vector.
Fig.1: Example of the quadtree representation of a 4-level TSWT of an arbitrary image.
3. Measurement of breast symmetry
Chang and Kuo give three very sophisticated TSWT-based methods for classifying textures by using adaptive algorithms along with extensive databases (Chang, 1993). In the present work we adapted their algorithms for the purpose of measuring the asymmetry between the textures of two mammograms. Our method is straightforward and consists of the following steps: 1) digitalized images of the right and left mammograms must be obtained, and the constant C and the number J of features must be chosen. 2) The left mammogram is inverted along the vertical axis. In this way, both mammograms are oriented in the same direction. 3) A 2n× 2n pixels region of interest (ROI) is selected on the left mammogram and a TSWT is performed in order to obtain its energy map. 4) At this point, it is necessary to select on the right mammogram that part of the image that actually
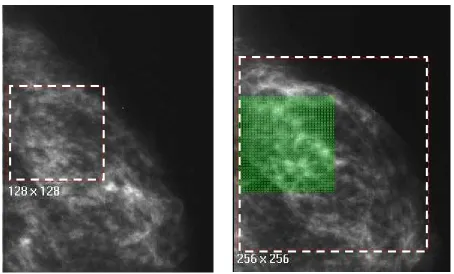
corresponds to the selected ROI. In other words, what we have to compare are the images related to equivalent positions in both breasts. Because of slight differences in breast compression and positioning during image capture, equivalent regions are not necessarily imaged in the mammograms at symmetrical positions. In order to guarantee that the region corresponding to the ROI is included a region of larger size than the ROI must be selected. Next, once the right region has been selected, it is scanned up-down and from left to right by a 2n× 2n window which moves at 2-pixel steps. At each position of the window, a TSWT is performed on the contained sub-image and its energy map is obtained. In Fig. 2 (a) the left-breast mammogram is shown, from which a 128 × 128 ROI has been selected. On the right-breast mammogram (Fig. 2 (b)) a larger scanning region has been also selected. The scanning window at a given position is shown in green. At this step, the energy maps of both the left-ROI and the scanning window are compared. To do this, the energy of the first J dominant channels of the ROI are picked up as features. Let us denote this feature set by e = (e1, …, eJ), e1 > … > eJ . Then the energies mi (i = 1, …, J) of the same channels
J channels of the window-energy map) and the distance D between both images is calculated according to:
(
)
∑
=
− =
J
j
j j m
x D
1
2
[image:5.595.70.524.255.529.2]The distance D is an indicator of the symmetry between the left ROI and that specific scanning window. Low values for D will correspond to breast symmetry, and high values to breast asymmetry. It is worth mentioning that if both images are quite different and the constant C is high enough not all the J more significant channels of the ROI will be present in the energy map of the scanning window. In this case the distance D cannot be properly evaluated and the textures of both images can be regarded as non-coincident.
Fig. 2: An example of the application of the method is shown. Further explanations can be found in the text.
After the scanning window has mapped the entire selected right region, usually many coincident regions are found, each with its own D value. Then, either the lowest D value or an average of all the D values can be taken as a measure of the texture symmetry.
4. An application
scanned on the right mammogram and all the coincident subimages were determined. Finally, all distances less than 1200 (maximum recognition distance) were averaged to obtain an estimate of the symmetry between both mammograms of each patient. In Table 1 the different cases were grouped by age and distance. In the sixth column those cases whose lowest distance was higher than the maximum recognition distance were grouped.
Average distance
Age [year] 0 - 300 301 - 600 601 - 900 901 – 1200 1201 or larger
Occurrence number
30 - 40 1 3 3 5 1 13
40 - 50 0 5 5 6 4 20
50 - 60 2 2 3 3 6 16
60 - 70 1 4 2 3 4 14
Occurrence number
[image:6.595.70.525.181.327.2]4 14 13 17 15 63
Table 1: The results of the analysis of the texture breast symmetry of the mammograms belonging to 63 healthy women.
Although it can be said that the number of high asymmetries slightly increases whit age, no general conclusions can be extracted from the results shown in Table 1. That is not surprising for several reasons. First, the analyzed population is too small for allowing a reliable statistics. Second, breast tissue does not have a well-established pattern. It not only changes drastically from women to women, but it also changes in time for the same woman. This characteristic of breast tissue introduces large dispersions among the mammograms of different patients, and, consequently, a serious difficulty for the analysis of mammograms. However, this example demonstrates that a quantification of the texture symmetry of a patient's mammograms is possible, besides the above reported breast asymmetry measurements, based mainly on dimensional analysis.
5. Summary
In this paper an additional method for quantifying the asymmetry between the left- and right-mammograms of a patient is reported. It is based on the algorithm developed by Chang and Kuo for characterizing and classifying quite general textures. The method reported in this paper was successfully applied to a small population of healthy women for the analysis of their breast texture asymmetries, showing the feasibility of the method. The study of larger populations of women in order to correlate breast asymmetries with the predisposition to develop breast cancer can be envisaged.
Bibliography
Adams MS and Niswander JD, Developmental noise and a congenital malformation, Genet. Res. Cambridge 10 (1967) 313.
Chang T and Kuo J, Texture analysis and classification with Tree-Structured Wavelet Transform, IEEE Transactions on Image Processing Vol. 2 (1993) 429.
Colacino SC, Petterson JC, Analysis of the gross anatomical variations found in four cases of trisomy, Am. J. Med. Genet. 2 (1978) 31.
Ferrari RJ, Rangayyan RM, Desautels JEL, and Frère AF, Analysis of Asymmetry in Mammograms via Directional Filtering With Gabor Wavelets, IEEE Trans. Med. Image 20 (2001) 953.
Gulsrud TO and Kjøde S, Optimal filter for detection of stellate lesions and circumscribed masses in mammograms. In SPIE's Visual Communications and Image Processing 1996, Orlando, FL, March 1996, pp. 430-440.
Gupta R and Undrill PE, The use of texture analysis to delineate suspicious masses in mammography, Physics in Medicine & Biology 40 (1995) 835.
Lange R, Gamba P, Saccomano C, Lester M, and Caselli E, Computer assisted diagnosis of mammograms employing wavelets, VIII RPIC Anales 2 (1999) 7-5.
Ludwig W, Das Rechts-Links Problem in Tierreich und beim Menschen, Springer, Berlin, 1932.
Markow TA, Wandler K, fluctuating dermatoglyphic asymmetry and the genetics of liability to schizophrenia, Psychiatry Res. 19 (1986) 323.
Rasmusen M, Frequency of morphological deviants as a criterion of developmental stability, Hereditas 46 (1960) 511.
Scutt D, Manning JT, Whitehouse GH, Leinster SJ, and Massey CP, The relationship between breast asymmetry, breast size and the occurrence of cancer, The British Journal of Radiology 70
(1997) 1017.