Available Energy and Cumulative Frequency Curves
for Parabolic Trough Concentrators with Alignment North-South,
in the Northwest of Mexico
Curvas de frecuencia acumulada para un concentrador solar de canal
parabólico con orientación Norte-Sur en el Noroeste de México
Álvaro Lentz-Herrea
Instituto de Ingeniería.
Universidad Nacional Autónoma de México. E-mail: solar_lentz@yahoo.com.mx
Rafael Almanza-Salgado
Instituto de Ingeniería.
Universidad Nacional Autónoma de México. E-mail: ras@pumas.ii.unam.mx
Serafín López -Ríos
Gerencia de Proyectos Geotermoeléctricos Comisión Federal de Electricidad. Morelia, Michoacán.
E-mail: slopezrios@gmail.com
Roberto Cadenas-Tovar
Gerencia de Proyectos Geotermoeléctricos Comisión Federal de Electricidad. Morelia, Michoacán.
E-mail: roberto.cardenas@cte.gob.mx
(Recibido: agosto de 2007; aceptado: abril de 2008)
Abstract
The Nort hwest of Mexico is a well known region with the highest ambient tempe -ra tures along the summer and the highest levels of ir-ra diance, which make it feasible to install solar field concen tra tors. This work provides beam irra diance data that can be used to design a solar north-south para bolic trough system. The varia tion between the value of beam solar irra diance esti mated by a pyra no meter and the direct irra diance received by the aper ture area of a para bolic trough concen trator (PTC) is well-known as cosq. This varia tion was evaluated every day of the year, obtai ning values of average irra diance for Cerro Prieto (CP) lat. 32º39’, long. 115º 21’, and San Luis Rio Colo rado (SLR) lat. 32º30’, long. 114º46’, with which they were elabo rated the avai lable energy and cumu la tive frequency curves (CFC). These are useful to know the number of hours of field solar concen tra tors which can operate at diffe rent levels of energy, as well as the steam produc tion of a solargeot -hermal hybrid system to produce elec tri city.
Keywords: Solar beam irra diance, para bolic trough concen trator, avai lable energy.
di rec ta de la irra dian cia so lar, la cual es uti li za da en el di se ño de con cen tra do res so la res ti po ca nal pa ra bó li co con orien ta ción Nor te-Sur. La va ria ción en tre el va lor de la irra dian cia so lar di rec ta ob te ni da por un pi ra nó me tro y al irra dian cia di rec ta re ci bi da por el área de aper tu ra de es tos con cen tra do res, que se en cuen tran en po si ción ho ri zon tal, se co no ce co mo cosq. Esta va ria ción se eva luó ca da día del año, ob te nién do se va lo res pro me dio de la irra dian cia pa ra Ce rro Prie to (CP), B.C.( lat. 32º39’, long. 115º 21’), así co mo pa ra San Luis Rio Co lo ra do (SLR) (lat. 32º30’, long. 114º46’); ade más fue ron ob te ni das las ener gías dis po ni bles mes por mes, así co mo las cur vas de fre cuen cia acu mu la da (CFC). Esta in for ma ción es útil pa ra co no -cer el nú me ro de ho ras que un cam po so lar de con cen tra do res podría operar con diferentes niveles de energía, así como la producción de vapor en un sistema híbrido solar-geotermia para la generación de electricidad.
Des crip to res: Irra dian cia di rec ta so lar, con cen tra do res ca nal pa ra bó li co, ener gía disponible.
Intro duc tion
The de sign of so lar con cen tra tor sys tems re quires a spe -cific pre sen ta tion of me te o ro log i cal data, namely so lar ir ra di a tion. The aim of this work is the study of the fre -quency dis tri bu tion of so lar ra di a tion as cu mu la tive fre quency curves of beam ir ra di a tion (CFCs) and the re lated con cept of avail able so lar en ergy from the so lar ir -ra di a tion mea sured in two cit ies in the north west of Mex ico: San Luis Río Col o rado, lat. 32º30’, long. 114º46’ in Sonora state and Cerro Prieto (CP) in Baja California state, lat. 32º39’, long. 115º 21’.
Cerro Prieto is the most im por tant geo ther mal field in Mex ico; this area also has the high est lev els of irradiance in the coun try (Almanza and López, 1978). These lev els of irradiance made it fea si ble to set up a so -lar col lec tor field in a geo ther mal field to cre ate a hy brid sys tem to in crease elec tric ity pro duc tion through out the day, Lentz et al., 2002; Lentz, 2005. The av er age peak beam irradiance through out the year is 734 W/m2. The hy brid sys tem is pro posed in or der to in crease the steam flow avail able for elec tric gen er a tion in the ac tual geo ther mal cy cle. The Mex i can elec tric ity com -pany (CFE), which be longs to the gov ern ment, has been in con tact with our group in or der to study the tech ni cal and eco nom i cal feasibility of a hybrid so lar-geo ther mal system.
San Luis Río Col o rado (SLRC) is a city near CP, with about 30 km be tween them with about the same me te o ro log i cal con di tions, and this place was con sid ered for a pro ject to build a com bined cy cle with a so -lar field (CFE, 2002); there fore, a pyrheliometer was in stalled.
The elec tric ity de mand in creases dur ing the sum -mer be cause the am bi ent tem per a ture can reach 50ºC.
One of the rea sons of this pro ject is to use the so lar re source to in crease the pro duc tion of elec tric ity by in creas ing the quan tity of steam com ing from the geo -ther mal wells, Lentz, 2002, which is a mix of brine and steam.
sun, this one is not com pletely nor mal to the sun’s irradiance. A PTC can be ori ented to one of three forms: in an east-west di rec tion with north-south track ing, a north-south and east-west track ing, and the well-known north-south po lar with east-west track ing.
The first two are on the hor i zon tal po si tion, which means that the di rec tion through out the par a bolic trough must take into ac count the cor rect mo ment to eval u ate the cosq. Some pre lim i nary cal cu la tions have been made in or der to know which ori en ta tion of the par a bolic troughs is most con ve nient to get the high est level of so lar beam irradiance into the ab sorber pipe of such con cen tra tors, and the north-south ori en ta tion is most con ve nient. Thus, the PTC so lar field pro posed is hor i zon tal north-south with track ing east-west, in -clud ing the cor rec tion of cosq (Almanza and Muñoz, 1994).
Use of real data for a spe cific place and year pro vides only a per for mance sim u la tion for that place and year, but its re li abil ity as a pre dic tion for the longterm av er -age is un cer tain. Af ter all, vari abil ity in monthly to tal irradiance from one year to the next com monly ex ceed ±10%, and the vari abil ity for ther mal col lec tors are even larger (Collares and Rabl, 1979).
Metho do logy
Yearly average
There is a weather sta tion in the geothermoelectric field of Cerro Prieto; in this field has been in stalled a ro tat ing shadowband pyranometer which mea sures glo -bal and dif fuse irradiance. The di rect irradiance data is cal cu lated by the same de vice, so that it is counted based on data from 2000 to 2003. With these data av er -ages, a yearly av er age was ob tained hourly for ev ery day of the year, since the sta tion makes mea sure ments ev ery 15 min utes. Four data were used to make the hourly av er ages for ev ery day of the year, which were di vided equally as well with their cor re spond ing year, with four years used to make the hourly av er age.
In San Luis Rio Col o rado, a pyrheliometer has been in stalled which mea sures di rect irradiance, which is mea sured on data from 2002 to 2003. With these data av er ages, an av er age year was ob tained. Four data were used to make the hourly av er ages for ev ery day of the year, which were di vided equally as well with their cor -re spond ing year, so that two years we-re used to make the hourly av er age. In gen eral the sea sonal vari abil ity of the weather may re quire a sep a rate cal cu la tion for each month of the year.
Normal direct irra diance by the captu ring surface (cosq)
When de vices take ad van tage of only the di rect com po -nent of irradiance and in par tic u lar the PTC, they are used be cause its move ment is only in one axis. This means that the sur face of the con cen tra tor re ceives so -lar rays that are not to tally nor mal to the sun, be cause is there an an gle be tween nor mal to the plane and the in ci dent irradiance (q). The co sine of the an gle q (cosq) is de fined as the vari a tion be tween the di rect and the nor mal one to the cap tur ing sur face. This is known as an ap er ture area; it means the pro jected area of PTC in -ter cept ing beam irradiance. The an gle is cal cu lated to eval u ate the losses gen er ated by this vari a tion. The fol -low ing equa tion (1) al -lows eval u a tion of the cosq for a PTC field for the north-south (Duffie and Beckman, 1991):
cos (cos cos sin ) /
q= 2 qz+ 2 d 2 w1 2 (1)
Where:
qz=sin sind f+cos cos cos d f w (2)
Once the fac tor cos q for the en tire year is ob tained, it is mul ti plied with the cor re spond ing val ues of DNI; the re sult of this is used for the ac com plish ment of cu mu la -tive fre quency curves and the avail able en ergy of the irradiance that can be taken ad van tage of the PTC.
Cumu la tive frequency curves and avai lable energy
time), di vided by the num ber of days of the cor re spond -ing months, in clud -ing the years of data where upon it counts. The CFCs of the di rect nor mal irradiance to the PTC were made for the 12 months of the year, hav ing sep a rated the data of ev ery month in the fol low ing way: since it has been seen that so lar irradiance reaches the max i mum val ues on days to tally cleared of clouds, this means 1200 W/m² in sites with greater in so la tion. Then the in ter val will in clude from 0 to 1200 W/m², which is sub di vided into crit i cal lev els (thresh olds) of the global or beam so lar irradiance, in agree ment with the prac ti cal in ter est that it is had for dif fer ent ap pli ca -tions that in volve the ad van tage of so lar en ergy. In this case the in ter val from 0 to 1200 W/m² was sub di vided into 25 in ter vals of W/m². Once this sub di vi sion is made, a cer tain crit i cal level is cho sen and it is come to count the num ber of times that this level was ex ceeded dur ing each in ter val of 60 min utes, one hour, through out ev ery day and of ev ery month of the years that in -clude the in for ma tion upon which it is mea sured. This is re peated for all the lev els in which the in ter val of max i mum ir radi an ces has been di vided and for the site of ob ser va tion. The cu mu la tive fre quency curves dis -play the num ber of hours’ av er age in which dif fer ent lev els from irradiance in W/m2 are had. In this case, they ap pear to be the hours of di rect irradiance for the north-south field con cen tra tors of Cerro Prieto. If the thresh old irradiance Ic of a so lar sys tem is known, the CFC makes it pos si ble to ob tain the col lec tor op er at ing time di rectly as nh(Ic).
The area de lim ited by the CFC, the ver ti cal axes and hor i zon tal axes or Ic line, rep re sents the so lar en ergy avail able above the crit i cal flow of irradiance, Ic. The so -lar en ergy avail able is given by the sim ple in te gral in equation 3:
HC IC n Ih dI
lc lm ax
( )=
ò
( )* (3)As noted, for a zero thresh old HC = 0. The in ter cept with the ver ti cal axis rep re sents the max i mum so lar irradiance (Imax) which can be achieved dur ing the month on the plane con sid ered, Imax is gen er ally ob -served at so lar noon on clear days.
Compa rison of the data
With the pur pose of val i dat ing the data, that is to say, to ver ify that they are so re li able, the cu mu la tive fre -quency curves and so lar avail able en ergy of beam irradiance in Cerro Prieto are com pared with the curves of San Luis Río Col o rado.
Results
Next the Cerro Prieto cu mu la tive fre quency curves (figs. 1, 2, 3 and 4) are shown, which dis play the num -ber of hours that, on av er age, are mea sured for dif fer ent lev els of irradiance in W/m2. Fig ures 5, 6, 7 and 8 show the so lar en ergy avail able. In this case, the hours of di -rect irradiance reg is tered in the geo ther mal Cerro Prieto field ap pear, tak ing into ac count the data from nor mal beam irradiance av er aged from four years, and the value of the cosq fac tor.
Fig ures 9, 10, 11 and 12 are cu mu la tive fre quency curves for San Luis Río Col o rado, which dis play the num ber of hours in W/m2 of beam irradiance av er age from two years and the value of the cosq factor.
Fig ures 13, 14, 15 and 16 show the so lar en ergy avail able. In this case, the hours of di rect irradiance reg is tered in San Luis Río Col o rado ap pear, tak ing into ac -count the data from nor mal beam irradiance av er aged from three years and the value of the cosq factor.
CFC Cerro Prieto
0 200 400 600 800 1000
0 2 4 6 8 10 12
average hours
K
W
/m
2
January February March
Figure 1. January, February and March Cerro Prieto cumu la tive frequency curves.
CFC Cerro Prieto
0 200 400 600 800 1000
0 2 4 6 8 10 12
average hours
K
W
/m
2
April May June
CFC Cerro Prieto
0 200 400 600 800 1000
0 2 4 6 8 10 12 14
a verage hours
K
W
/m
2
July August Sept ember
Figure 3. July, August and September Cerro Prieto cumu la tive frequency curves
CFC Cerro Prieto
0 200 400 600 800 1000
0 2 4 6 8 10 12
average hours
K
W
/m
2
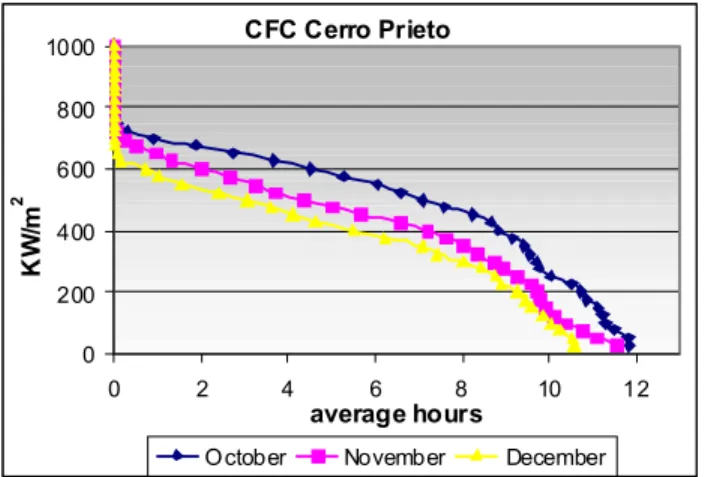
O ctober November December
Figure 4. October, November and December Cerro Prieto cumu la tive frequency curves
Availa ble energy CP
0 2000 4000 6000 8000
0 200 400 600 800 1000
W/m2
W
h
/m
2
January February March
Figure 5. January, February and March Cerro Prieto solar energy avail able
Available energy CP
0 2000 4000 6000 8000 10000
0 200 400 600 800 1000
W/m2
W
h
/m
2
July August September
Figure 7. July, August and September Cerro Prieto solar energy avail able
Availab le energ y C P
0 2000 4000 6000 8000 10000
0 200 400 600 800 1000
W/ m2
W
h
/m
2
April May June
Figure 6. April, May and June Cerro Prieto solar energy avail able
Available energy CP
0 2000 4000 6000 8000
0 200 400 600 800 1000
W/m2
W
h
/m
2
October November December
CFC SLRC
0 200 400 600 800 1000
0 2 4 6 8 10 12
a verage hours
K
W
/m
2
January February March
Figure 9. January, February and March SLRC cumu la tive frequency curves
CFC S LRC
0 200 400 600 800 1000
0 2 4 6 8 10 12 14
average hours
K
W
/m
2
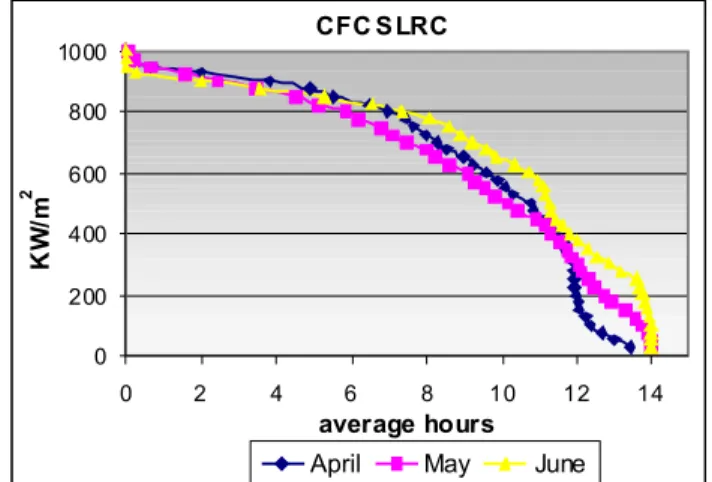
April May June
Figure 10. April, May and June SLRC cumu la tive frequency curves
CFC S LRC
0 200 400 600 800 1000
0 2 4 6 8 10 12 14
average hours
K
W
/m
2
July August September
Figure 11. July, August and September SLRC cumu la tive frequency curves
CFC SLRC
0 200 400 600 800 1000
0 2 4 6 8 10 12
average hours
K
W
/m
2
October November December
Figure 12. October, November and December SLRC cumu la tive frequency curves
Available ene rgy SLRC
0 2000 4000 6000 8000 10000
0 200 400 600 800 1000
W/m2
W
h
/m
2
January F ebruary March
Figure 13. January, February and March SLRC solar energy avail able
Available energy SLRC
0 2000 4000 6000 8000 10000 12000
0 200 400 600 800 1000
W/m2
W
h
/m
2
April May June
When the cu mu la tive fre quency curves and so lar avail able en ergy of beam irradiance in Cerro Prieto com -pared with the curves of San Luis Río Col o rado, they do not have im por tant vari a tions that could dis qual ify ei -ther set of mea sure ments.
The CFC’s are use ful to con sider the monthly pro -duc tion of a so lar field. If it is re quired, it is pos si ble to do them with greater de tail, mak ing a greater num ber of di vi sions at the in ter vals of the crit i cal lev els. The CFCs of June in CP and SLRC, which were ob served over 800 W/m2 had six hours, im ply ing that a con cen -tra tor will work with those lev els or over if higher irradiance can be ob tained dur ing that num ber of hours. This im plies that dur ing this pe riod the steam pro duc tion can be ob tained for that power or over this pe riod if the irradiance is higher, de pend ing on the area of the PTC so lar field. If the equip ment works over 400 W/m2, it will op er ate for around 11 hours. Fol low ing with an other ex am ple now with the month of Jan u ary, such equip ment will only op er ate for around two hours over 400W/m2, not ar riv ing at one hour over 800W/m2. In this case the di vi sion through out the year was made by month, but it can be made by an other form, for weeks or every 10 days throughout the year.
Nomen cla ture
q: An gle of in ci dence of beam irradiance on a sur face [de grees]
d: So lar dec li na tion [de grees] f: Lat i tude [de grees]
w: Hour an gle [de grees] b: Slope [de grees]
g: Sur face az i muth an gle [de grees] nh: Time [hours]
Ic: so lar irradiance on a given plane. [W/m2] Imax max i mum so lar irradiance. [W/m: 2] Z: zenital
Conclu sions
The data pro vided in Cerro Prieto of di rect so lar irradiance are cal cu lated from the data of global and dif -fuse irradiance mea sured by a pyranometer of ro tat ing shadowband pyranometer type; these data of di rect nor mal irradiance have the dis ad van tage of not be ing mea sured di rectly by a pyrheliometer, but for eval u at -ing the tech ni cal fea si bil ity are suf fi cient. The data do not pres ent great vari a tions al low ing con fi dence in them, al though the com pared data were of global irradiance. It is ad vis able to count with a pyrheliometer in Cerro Prieto to mea sure the nor mal di rect irradiance, and not to cal cu late it since one has be come in this case. The CFC shows that the months with the greater num ber of hours at the high est lev els of irradiance are the months of April to July and, at the other ex treme, those of mi nor level are the months of No vem ber to Jan u ary. With the use of these curves it is pos si ble to ob serve in which month the greater steam pro duc tion is pos si ble. If a so lar field of so lar con cen tra tors were used, this one would be the month of June and the one with the smaller pro duc tion would be the month of Jan u ary. The dis ad van tage of the CFC is that it is not pos si ble to know with ex ac ti tude to the hour when the dif fer ent lev els of irradiance are ob tained. The amount of en ergy is known in the num ber of hours’ av er age per
Ava ilable energy SLRC
0 2000 4000 6000 8000 10000
0 200 400 600 800 1000
W/m2
W
h
/m
2
July August Sept ember
Figure 15. July, August and September SLRC solar energy avail able
Available energy SLRC
0 2000 4000 6000 8000
0 200 400 600 800 1000
W/m2
W
h
/m
2
October November December
month, but not in which mo ment these ap pear, which is im por tant in an elec tri cal gen er a tion plant when is re quired in de tail. This can be done only in real-time if a pyrheliometer is avail able or, in the fu ture, with sat el -lite images, if a good methodology is available.
The so lar field with north-south align ment in the so lar-geo ther mal hy brid sys tem is a good op tion to cover the de mand peak in sum mer due to air con di tion -ing in Cerro Prieto and San Luis Río Col o rado.
Acknow ledg ments
To CONACyT by the schol ar ship granted to the first au thor, the DGAPA by sup ported eco nomic for the de -vel op ment of the pro ject, to the Fed eral Com mis sion of Elec tric ity by the eco nomic sup port, the asked for in -for ma tion and the fa cil i ties.
Refe rences
Almanza R., López S. Total Solar Radia tion in Mexico Using Suns hine Hours and Meteo ro lo gical Data. Solar Energy,
21:441-448. 1978.
Almanza R, Muñoz F. Inge niería de la Energía Solar. Mexico DF. Colegio Nacional. 1994. Pp. 87-103.
Bourges B. Climatic Data for Hand book Europe, Kluwer. Nether -lands. Academic Publis hers. 1992. Pp.15 -18.
Comi sión Federal de Elec tri cidad (CFE). Internal Report Bid 13164093-002-02, CFE-23-CC-MI-II. (in Spanish). México. 2002.
Comi sión Federal de Elec tri cidad (CFE). Private Commu ni ca -tion. Morelia Michoacán. 2003.
Collares-Pereira M., Rabl A. Simple Proce dure for Predic ting Long Term Average Perfor mance of Noncon cen tra ting and Concen tra ting Solar Collec tors. Solar Energy, 23:235. 1979.
Duffie J., Beckman W. Solar Engi nee ring of Thermal Processes. Second Edition. New York, USA. Wiley Inters cience. 1991. Pp. 13-27.
Lentz A., Almanza R., Ruiz V. A Hybrid Solar-Geot hermal System to Increase the Quan tity of Steam in Cerro Prieto, Baja Cali fornia, Paul Sche rrer Institut. In: Proc 11th SolarPACES 2002, Inter na tional Sympo sium, Zurich, Swit zer land, 2002, p. 553.
Lentz A. Incre mento en la cantidad de vapor de los ciclos geoter moe léc tricos mediante concen tra dores solares de canal para bó lico. Tesis (Ph. D. disser ta tion). Posgrado de las Inge nie rias UNAM. México, 2005.
Perrot. La houille d’or, Éditions Fayard. Paris. 1963. Pp. 32-36.
About the authors
Alvaro Eduardo Lentz-Herrea. Ph. D. in Energy Engi neering, UNAM 2005. Engi neering Masters in Energy, 1998. Mechan -ical-Elec trical Engi neering, UNAM 1995. Research-Professor at the Program of Energy of the Mexico City Auton o mous Univer sity.
Rafael Almanza-Salgado.Full Research Professor at the Engi neering Insti tute, UNAM, working in projects of solar energy for 35 years. Level 3 in the National System of Researchers. NATIONAL UNIVERSITY PRIZE 2006 in Tech no log ical Inno va tion and Indus trial Design.
Serafín López-Ríos.He is Mechan ical engi neer of the Michoacan Univer sity; he has been professor in thermal power plants for more than 20 years at the same univer sity. He got his Masterful in Admin is tra tion at the Vasco de Quiroga Univer -sity; at the moment holds the posi tion of Assis tant Manager of Projects of Renew able Energy in the Manage ment of Geothermal elec tric Projects of CFE, where he has spent 25 years to the devel op ment of geothermal and new renew able energy projects.