Atherosclerosis and air pollution: understanding traffic-related exposure and its effects.
225
0
0
Texto completo
(2)
(3) A mis padres, Quienes han estado siempre tan cerca en la distancia..
(4)
(5) ACKNOWLEDGEMENTS I would like to thank all the people who contributed to my thesis project both with scientific and personal support. Thanks to my thesis director Nino Künzli, for giving me the opportunity to redirect my career towards Epidemiology and Public Health. His guidance during the project development and his confidence has been determinant for the success of this thesis. It was a privilege to work with him; I learned a lot and enjoyed it very much too. I also had the luck of having a senior statistician and young researcher as a co-director, Xavier Basagaña. He taught me a good deal of the very hard to grasp concepts in statistics. Thanks for your advice Xavi! I thank my tutor, Jordi Sunyer who has guided me in all the administrative issues of research and who has supported me in taking some of the core courses in my training. Mercè Medina, who was key in order to start working in a very productive research group; she also helped me extensively with the papers’ first drafts. Many thanks to my paper coauthors and my research group: Maria Foraster, Inma Aguilera, Laura Bouso and David Agis. Of course, this project would not have been done without their hard work. Thanks to the REGICOR team, especially to Jaume Marrugat, Roberto Elosua, Pascual Solanas, Rafael Ramos, Martina Sidera, Núria Pagès and Dave MacFarlane. Gerard Hoek, for his support during my stay in the IRAS institute, Utrecht, and for making that stay not only very productive, but also very nice. I would come back any time! A special thanks to Agustin Lobo, who really looks for the interests of his students and helped me finding an opportunity in a field merging the two topics I wanted to work with, but on which I had the narrow experience of a Chemical Engineer: Air pollution and Public health. Tom Burke and Alvaro Muñoz (Profesor, me quito el sombrero después de cada seminario suyo) your classes and the talks we had came in moments when I really needed an extra motivation to go on with a process that is not exciting at every stage. Very special thanks to my professors from the Chemical Engineering faculty at the Universidad Nacional de Colombia. I ended up in a complete. v.
(6) different world but I would not have devoted my work to research if it weren’t for the inspiring work and classes of Carlos Ariel, Jose Hernán Jaramillo, and Miguel Ángel Gómez. I want to thank my dearest friends and classmates from whom I learned just as much: Lida Marcela, Yeny, Juan Felipe, Julian, Leo (Leandro), Natalia, Wilmar… I would also like to acknowledge the people I have run into and who, in one way or another, have helped me in this path: Gerry Poster; Laurel Blair; Charlotte and Rudy Braun-Fahrländer for making the stays in Basel much more enjoyable. All the people at CREAL, especially Talita, Lidia (I would repeat a congress in Dublin whenever you want), David (así los abarco a todos, no?), Eileen, Irene, Solymar, Laurel Kincl, Kyriaki, Anna Schembari, Iris, Nadine, Dania, Joan, Alicia, Raquel, Anne Ellie, Anna Espinosa. Maria for scientific support, and for sharing with me much of the pre-doctoral experiences, hard work, and also fun -and Basel and Rotterdam. Mark Nieuwenhuijsen, Audrey de Nazelle, Marta Cirac, Michelle Mendez, Josep Maria Antó and Manolis Kogevinas for scientific advice; Anna Sillero, Natàlia Ras and Nora Bauer for administrative support. Thanks to the REGICOR participants. There’s no epidemiology without them. This project tries to give back to society a little of what society has given to us as scientists. I will always remember the warmth of the Gerundenses who welcomed us sometimes at their own homes. Thanks to the beautiful Girona. I hope Air Quality continues being a priority there. Thanks to Barcelona and its people. After a long time abroad, I have felt like I am at home again. Mi mayor gratitud es para mi Mamá y mi Papá quienes me han apoyado siempre y han creído en mi incluso antes que yo misma. Mis hermanos quienes los han cuidado mientras estoy fuera y me dan tantos momentos de alegría. Vanessa, quien me animo a perseguir este nuevo sueño. Antes de llegar al final, quiero darle las gracias a Bilbo, te voy a compensar por los paseos tan cortos que te di últimamente ;) Y por supuesto a David, quien ha hecho por momentos de estadístico, editor, experto y coach en mi proyecto de tesis, y en lo que sigue de aquí en adelante, espero que por mucho tiempo –eso si, sin deadlines-. Gracias, totales.. Barcelona. December, 2011. vi.
(7)
(8)
(9) PROLOGUE This thesis project focused on the assessment of long-term exposure to traffic-related air pollution and its association with atherosclerosis. This is the first study that evaluated such association among the Mediterranean population. This doctoral thesis contributes to the characterization of the spatial distribution of nitrogen dioxide, heavy metals and ultrafine particles in Girona, to the methodology in air pollution exposure assessment studying different markers of traffic-related air pollution, measurement instruments and protocols, as well as to the development of the LUR technique, identifying potential bias in the resulting coefficients of the health model and practical solutions to avoid them. Finally, this thesis added to the evidence that long-term exposure to traffic-related air pollution is associated with atherosclerosis and identified potential susceptibility factors for the Mediterranean population. This doctoral thesis is based on the following original publications: I. Monitoring of heavy metal concentrations in home outdoor air using moss bags II. Spatial distribution of ultrafine particles in urban settings: a land use regression model III. Effect of the number of measurement sites on Land Use Regression Models in estimating local air pollution IV. Long-term exposure to traffic-related air pollution and subclinical atherosclerosis Based on original research and guided by her thesis directors, the doctoral candidate’s contribution included the exposure assessment design; participation and coordination of fieldwork and data collection; data management; training and supervising five technicians on data collection, data entry and quality control for the traffic and ultrafine particle monitoring; linkage of traffic intensity data to the digital road network; statistical analysis and reports writing; communications of results in internal meetings and international conferences; and writing the four scientific articles that constitute this doctoral thesis.. ix.
(10)
(11) ABSTRACT Epidemiological evidence on the effects of long-term exposure to air pollution on the chronic processes of atherogenesis is limited. Given the widespread exposure to traffic-related pollutants and the large and rising global burden of cardiovascular diseases, elucidating and quantifying the association of exposure to air pollution with atherosclerosis is of great relevance for public health. The aims of this thesis were to characterize people’s exposure to long-term traffic-related pollution and evaluate its association with subclinical atherosclerosis in the adult population of the Mediterranean Spanish region. We used data of the re-examination (2007-2010) of 2780 participants, 32 to 86 years of age, from the REGICOR study. REGICOR is a population-based prospective cohort from Girona, Spain. The main health outcome was the carotid artery intima media thickness (IMT), a validated marker of subclinical atherosclerosis, added to the study protocol at the 2007-2010 re-examination. To characterize local-scale pollution we conducted measurements of heavy metals for eight weeks -using mosses as biomonitors-, nitrogen dioxide (NO2) for four weeks -using passive samplers- and simultaneous measures of traffic counts and ultrafine particles (UFP) using mobile condensation particle counters- for 15-minute periods. To assess the spatial variability of these markers of traffic-related pollution, we developed land use regression (LUR) models. We also conducted a methodological study on the effects of the number of measurements on the performance of LUR models. From the characterized markers, NO2 and traffic intensity were used to assign exposure to participants. Long-term exposure was calculated as the time-weighed average of NO2 estimates across all residences of each participant in the last 10 years. The cross-sectional association between air pollution and IMT was investigated using multivariate linear regression analyses. (i) The best predictor of heavy metals was the number of bus lines in the nearest street. Metals were not highly correlated with NO2 and showed higher spatial variability than NO2. LUR models explained between 40 to 85% of metals and 72% of NO2 variability. Given the higher toxicity, stronger association with local traffic and higher spatial variability of heavy metals compared to NO2, monitoring with mosses is an appealing alternative for long-term exposure assessment. (ii) The best predictors of UFP were traffic intensity, xi.
(12) distance to nearest major crossroad, area of high density residential land and household density. The LUR models of UFP explained between 36 to 51% of UFP total variation. For a subset of sites, using the mean of two repeated measurements improved the LUR model R2 to 72%. The distribution of UFP can be modeled with fair performance based on short-term mobile monitoring. (iii) Models based on a small number of sampling sites, e.g. 20-30, result in artificially high adjusted R2 and leave-one-out cross-validation R2. The differences between these estimators and the “true” validation R2 could be as high as 60% for small samples sizes (≤20) and of around 10% for sample sizes above 100. The selection of predictor variables for the LUR model introduces classical measurement error resulting in bias of the health effect estimates. The magnitude of the error depends on the number of sampling sites and variables offered to the model. LUR models for complex urban settings should be based on a large number of measurement sites (>80) and the number of potential predictor variables should be restricted. (iv) Average residential traffic (load and intensity) was associated with 2% thicker IMT. Associations of residential NO2 with IMT were weak and reached statistical significance in the subgroups of people with high education level and men above 60 years (a difference of 25µg/m3 in NO2 was associated with a 4.6 and 4.3% increase in IMT respectively). Long-term exposure to traffic-related air pollution is associated with carotid subclinical atherosclerosis in a random healthy population. This thesis contributes to the characterization of the spatial distribution of NO2, heavy metals and UFP in Girona, to the methodology in air pollution exposure assessment studying different markers of traffic-related air pollution, measurement instruments and protocols, as well as to the development of the LUR technique, identifying potential bias in the resulting coefficients of the health model and practical solutions to avoid them. Finally, this thesis added to the evidence that long-term exposure to traffic-related air pollution is associated with atherosclerosis and identified potential susceptibility factors for the Mediterranean population.. xii.
(13) RESUMEN La evidencia epidemiológica de los efectos de la exposición a largo plazo a la contaminación atmosférica sobre el proceso aterogénico es limitada. Dada la exposición generalizada de la población a contaminantes procedentes del tráfico y la elevada y creciente carga de morbilidad que suponen las enfermedades cardiovasculares a nivel mundial, entender y medir la asociación entre la exposición a contaminación atmosférica y la aterosclerosis es de gran relevancia para la salud pública. Los objetivos de esta tesis son caracterizar la exposición a largo plazo a contaminantes derivados del tráfico y evaluar su asociación con aterosclerosis subclínica en la población adulta de la región Mediterránea de España. Utilizamos datos del re-examen (2007-2010) de 2780 participantes con edades entre 32 y 86 años procedentes del estudio REGICOR. REGICOR es una cohorte poblacional prospectiva de Girona, España. El principal indicador de salud fue el grosor de la íntima media de la arteria carótida (IMT), un marcador validado de aterosclerosis subclínica que se adicionó al protocolo del estudio para el re-examen de 2007-2010. Para caraterizar la contaminación a escala local medimos las concentraciones de metales pesados durante ocho semanas –usando musgos como biomonitores-, NO2 durante cuatro semanas –mediante muestreadores pasivos- y medimos simultáneamente la intensidad de tráfico y la concentración de partículas ultrafinas (UFP) –usando contadores de partículas por condensación portátiles- durante periodos de 15 minutos. Para evaluar la variabilidad espacial de estos marcadores de contaminación por tráfico, aplicamos modelos de regresión “land use” (LUR). Además, desarrollamos un estudio metodológico sobre el efecto del número de medidas sobre la bondad de ajuste de los modelos LUR. Entre estos marcadores, el NO2 y la intensidad de tráfico se utilizaron para calcular la exposición. La exposición a largo plazo se calculó mediante el promedio ponderado en el tiempo de las predicciones de NO2 en todas las residencias de cada participante en los últimos diez años. La asociación transversal entre contaminación atmosférica e IMT se investigó mediante análisis de regresión lineal múltiple. (i) El mejor determinante de los metales pesados fue el número de líneas de autobús en la calle más cercana. Los metales no estaban altamente correlacionados con el NO2 y mostraron mayor xiii.
(14) variabilidad espacial que este último. Los modelos LUR explicaron entre el 40 y el 85% de la variabilidad de los metales y el 72% de la variabilidad del NO2. Dada la elevada toxicidad, la fuerte asociación con el tráfico local y la mayor variabilidad espacial de los metales pesados en comparación con el NO2, el monitoreo con musgos es una alternativa atractiva para la evaluación de la exposición a largo plazo. (ii) Los mejores predictores de UFP fueron la intensidad de tráfico, distancia al cruce más cercano y el área de alta densidad residencial. Los modelos LUR de UFP explicaron entre el 36 y el 51% de la variabilidad total de UFP. Para un subconjunto de los puntos de muestreo en que se utilizó el promedio de dos medidas repetidas, la R2 alcanzó el 72%. La distribución de las partículas ultrafinas puede modelarse con una bondad de ajuste aceptable basándose en monitoreos móviles de corto tiempo. (iii) Los modelos basados en pocos puntos de muestreo (de 20 a 30 puntos), resultan en R2 ajustados y R2 de “leave-one-out crossvalidation” artificialmente elevados. Las diferencias entre estos estimadores y el R2 verdadero puede llegar a ser del 60% para tamaños de muestra pequeños (≤20) y de alrededor del 10% para tamaños de muestra mayores a 100. La selección de las variables predictoras para el modelo LUR introduce un error de medida clásico que resulta en estimaciones sesgadas del efecto de la exposición sobre la salud. La magnitud de dicho error depende del número de puntos de muestreo y del número de variables ofrecidas al modelo. Los modelos LUR para áreas urbanas complejas deberían basarse en un tamaño de muestra grande (>80) y el número de variables independientes iniciales debería ser limitado. (iv) La intensidad de tráfico residencial promedio en los últimos 10 años se asocia con un engrosamiento del 2% de la íntima media. Las asociaciones entre el NO2 residencial con la IMT fueron débiles y alcanzaron la significación estadística en los subgrupos de población con alto nivel educativo y hombres de más de 60 años (una diferencia de 25µg/m3 en NO2 se asoció a un incremento del 4.6 y el 4.3% de IMT respectivamente). La exposición a largo plazo a contaminantes atmosféricos provenientes del tráfico se asocia a un incremento del riesgo de aterosclerosis subclínica en una muestra aleatoria de individuos sanos. Esta tesis contribuye a la caracterización de la distribución espacial del NO2, los metales pesados y las UFP en Girona, a la metodología de la evaluación de la exposición a contaminación atmosférica habiendo estudiado diferentes marcadores de contaminación por tráfico, instrumentos de medida y protocolos, así xiv.
(15) como al desarrollo de la técnica de modelos LUR para los que se identificaron sesgos potenciales sobre la estimación del efecto sobre la salud de dicha exposición y aporta soluciones prácticas para evitarlos. Finalmente, esta tesis añade a la evidencia de que la exposición a largo plazo a la contaminación procedente del tráfico se asocia a la aterosclerosis e identifica factores de susceptibilidad potenciales para la población mediterránea.. xv.
(16) RESUM L’evidència epidemiològica de l’efecte de la contaminació atmosfèrica sobre el procés crònic de l'aterogènesi és limitada. Donada l’exposició generalitzada de la població a contaminants procedents del trànsit i a l’elevada i creixent càrrega de morbiditat que suposen les malalties cardiovasculars a nivell mundial, entendre i quantificar l’associació entre l’exposició a contaminació atmosfèrica i l'aterosclerosi és de gran rellevància per la salut pública. Els objectius d'aquesta tesi són caracteritzar l'exposició a llarg termini a contaminants derivats del trànsit i avaluar la seva associació amb l'aterosclerosi subclínica en la població adulta de la regió mediterrània d'Espanya. Vàrem utilitzar dades de la re-avaluació (2007-2010) de 2780 participants amb edats entre 32 i 86 anys procedents del estudi REGICOR. REGICOR és una cohort poblacional prospectiva de Girona, Espanya. El principal indicador de salut va ser el gruix de la íntima mitjana de l'arteria caròtida (IMT), un marcador validat d'aterosclerosi subclínica que es va afegir al protocol de l'estudi en la re-avaluació del 2007-2010. Per a caracteritzar la contaminació a nivell local vàrem mesurar les concentracions de metalls pesats durant vuit setmanes -mitjançant molses com a biomonitors-, diòxid de nitrogen (NO2) durant quatre setmanes -mitjançant mostreig passiu- i vàrem mesurar simultàniament la intensitat de trànsit i la concentració de partícules ultra-fines (UFP) -mitjançant comptadors portàtils de partícules per condensació- durant períodes de 15 minuts. Per avaluar la variabilitat espacial d’aquests marcadors de contaminació per trànsit, vàrem aplicar models de regressió “land use” (LUR). Així mateix, vàrem desenvolupar un estudi metodològic sobre l'efecte del nombre de mesures sobre la robustesa dels models LUR. D'entre aquests marcadors, el NO2 i la intensitat de trànsit es van utilitzar per calcular l'exposició. L'exposició a llarg termini es va calcular com la mitjana de NO2 ponderada pel temps viscut en totes les residències en els darrers deu anys. L’associació transversal entre contaminació atmosfèrica i IMT es va investigar mitjançant anàlisi de regressió lineal múltiple. (i) El millor determinant dels nivells de metalls pesats va ser el nombre de línies d'autobús al carrer més proper. Els metalls no estaven altament correlacionats amb NO2 i varen mostrar major variabilitat espacial que el NO2. Els models LUR varen explicar entre el 40 i el 85% de la variabilitat dels metalls i el 72% de la variabilitat del NO2. Donada la seva elevada toxicitat, la forta associació amb el trànsit local i la major variabilitat espacial dels xvi.
(17) metalls pesats en comparació amb el NO2, el monitoratge amb molses és una alternativa atractiva per l'avaluació de la exposició a llarg termini. (ii) Els millors predictors de UFP varen ser intensitat del trànsit, distància a l’encreuament més proper, àrea de gran densitat residencial i densitat d’habitatges. Els models LUR de UFP varen explicar entre el 36 i el 51% de la variabilitat total de UFP. Quan per a una mostra de punts de mostreig amb dues mesures repetides es va utilitzar la mitjana de les dues mesures, la R2 va arribar al 72%. La distribució de partícules ultra-fines pot modelar-se amb una bondat d'ajust acceptable basant-se en un monitoratge mòbil de curta durada. (iii) Els models basats en un nombre petit de punts de mostreig (de 20 a 30 punts), resulten en R2 ajustats i R2 de validació creuada artificialment elevats. Les diferencies entre aquestes estimacions i el verdader R2 pot arribar a ser del 60% per grandàries de mostra petites (≤20) i del voltant del 10% per grandàries de mostra per sobre de 100. La selecció de les variables predictores per al model LUR introdueix un error de mesura clàssic que resulta en estimacions esbiaixades de l'efecte. La magnitud d’aquest error depèn del nombre de punts de mostreig i de les variables ofertes al model. Els models LUR per a espais urbans complexos haurien de basar-se en una gran mostra de punts (>80) i el nombre de variables independents inicials hauria de ser petit. (iv) La mesura d'intensitat i volum de trànsit a les residències dels últims 10 anys s'associa amb un engruiximent del 2% de la íntima mitjana. Les associacions entre el NO2 residencial dels últims 10 anys amb IMT varen ser febles i varen assolir la significació estadística en els sub-grups de població amb alt nivell educatiu i homes de més de 60 anys (una diferència de 25µg/m3 en NO2 es va associar a un increment del 4.6 i el 4.3% de IMT respectivament). L'exposició a llarg termini a contaminants atmosfèrics provinents del trànsit es va associar a un increment del risc d'aterosclerosi subclínica en una mostra aleatòria d'individus sans. Aquesta tesi contribueix a la caracterització de la distribució espacial del NO2, els metalls pesats i les UFP a Girona, a la metodologia de l'avaluació de l'exposició a contaminació atmosfèrica utilitzant diferents marcadors de contaminació per trànsit, instruments de mesura i protocols, així com al desenvolupament de la tècnica LUR per identificar biaixos potencials sobre l’estimació de l'efecte en salut d’aquesta exposició i solucions pràctiques per a evitar-los. Finalment, aquesta tesi contribueix a l'evidència que l’exposició a llarg termini a la contaminació procedent del trànsit s'associa a l'aterosclerosi i identifica factors de susceptibilitat potencials per a la població mediterrània. xvii.
(18) INDEX. xviii.
(19) xix.
(20)
(21) Atherosclerosis and cardiovascular diseases. 1. ATHEROSCLEROSIS AND CARDIOVASCULAR DISEASES. Cardiovascular diseases (CVD) are a group of disorders that affect the cardiovascular system, including heart diseases, and diseases of the blood vessels. Although they can be due to several causes, the more prevalent are related to atherosclerosis, a progressive disease characterized by the accumulation of lipids and fibrous elements in the large arteries (Lusis, 2000) (Figure 1). CVD not related to atherosclerosis include congenital heart disease, rheumatic heart disease, cardiomyopathies, cardiac arrhythmias and inflammatory heart diseases (myocarditis, pericarditis, endocarditis and cardiomyopathy). Those related to atherosclerosis include ischaemic heart disease (heart attack), cerebrovascular disease (stroke or ictus) and diseases of the arteries (hypertensive heart disease and peripheral vascular disease). The latter cause 83% and 86% of total mortality due to CVD in women and men respectively. The process of atherosclerosis begins in childhood (McGill et al., 1998) and there is a long induction period until evolving to clinical stages of the disease in middle and advanced ages. By measuring atherosclerosis, instead of cardiovascular events, the subclinical stages of the disease can be studied.. 21.
(22) Atherosclerosis and cardiovascular diseases. Figure 1. Illustration of the progression of atherosclerosis in the coronary arteries. Adapted from (Wikimedia Commons, 2007). 1.1. Burden of disease. Cardiovascular diseases (CVD) accounted for 17.3 million deaths worldwide in 2008 (World Health Organization, 2011). This represents 31% of all-cause mortality (32% in women and 27% in men), making CVD the leading causes of death worldwide. The elderly population is the most affected by CVD. It is however estimated that more than 3 million of the global deaths due to CVD occurred before the age of 60 (2008). CVD were responsible for 151 million Disability Adjusted Life Years (DALY), accounting for 10% of the total DALY estimated on a global scale for the year 2004. More than half of this burden involved people aged less than 60 years (World Health Organization, 2008). In Spain, CVD are the main cause of death accounting for 120.053 deaths in 2009, which represents 44% of all-cause death in women and 32% in men (INE, 2011), i.e. 31.2% of overall total deaths. In the recent decades, the incidence of CVD has doubled in low- and middle-income countries. This and the aging of population will lead. 22.
(23) Atherosclerosis and cardiovascular diseases. to an increase in the global cardiovascular deaths in 2030 to a projected estimate of 23.4 million (World Health Organization, 2008).. 1.2. Mechanisms and Risk factors. Atherosclerosis is a complex disease and its mechanisms are not fully elucidated. Biological pathways include systemic inflammation, endothelial dysfunction, alterations of extracellular matrix metabolism and hyper-reactivity of smooth muscle cells. Inflammation is triggered after injuries in the arterial wall. Such injuries are caused mainly by LDL molecules that are deposited on the wall and then oxidized by free radicals, becoming toxic. In response, inflammatory cells produce cytokines that activate the endothelium, shifting completely its antiadhesive and anticoagulant properties into adhesive and procoagulant properties (Angiolillo et al., 2004). Monocytes and T lymphocytes are then allowed to migrate from the blood stream into the arterial wall. Monocytes acquire characteristics of macrophages and foam cells and secrete reactive oxygen species, cytokines, metalloproteinases growth factor and tissue factor increasing the local inflammatory response (Figure 2). Over time, accumulation of macrophages, foam cells and cellular necrotic debris form atherosclerotic plaques that are covered by a fibrous cap. The plaque development results in arterial wall thickening. In late stages of the disease arterial stenosis (abnormal narrowing) may occur. Also, macrophages can secrete metalloproteinases that degrade the fibrous cap until its rupture. Blood enters in contact with tissue factor, a pro-coagulant protein, and thromboses are formed. Procoagulant properties of activated endothelial cells may alternatively lead to thrombi formation, which eventually leads to acute clinical manifestations, such as myocardial infarction, stroke or vascular dementia. The evolution of atherosclerosis follows a life-long pathway and may or may not lead to an acute event. Many patients with atherosclerosis remain stable all through their life, while others, even with less severe atherosclerosis, develop an acute event as the first symptom of CVD. Thus, the mechanisms and also the risk factors for the process of atherogenesis and those for the development of an acute event are not necessarily the same (Angiolillo et al., 2004; Künzli et al., 2011).. 23.
(24) Atherosclerosis and cardiovascular diseases. Current concepts assume that the degree of atherosclerosis depends both on genetic factors and the total cumulative exposure to endogenous and exogenous (environmental) risks factors. Risk factors for acute events are the presence of atherosclerosis and circumstances occurring within one hour and up to ten days before the event, such as, a transient thrombotic change due to an infection (Künzli et al., 2011), use of cocaine, heavy meals, physical exertion, stressful situations or high levels of air pollution (Nawrot et al., 2011). Established risk factors for atherosclerosis development are high cholesterol levels, hypertension, diabetes, overweight and obesity, metabolic syndrome (Iglseder et al., 2005), sedentary lifestyle, unhealthy diet, smoking, high intake of alcohol, family history of atherosclerosis or CVD, poverty, psychological factors (e.g. hopelessness) (Whipple et al., 2009) and long-term radiation therapy (close to the heart) (Wittig et al., 2011). Unmodifiable risk factors are sex –with men being at higher risk for development of clinically relevant atherosclerosis- and age. In fact atherogenesis is inherently related to aging. Artery walls get thicker continuously and disease progression depends on the overall level and duration of exposure to the mentioned risks factors.. Figure 2. Illustration of the dynamic pathophysiology of atherosclerosis showing relationships between potential metabolic, cellular, and inflammatory biomarkers. Reproduced from Hansson (2005).. 24.
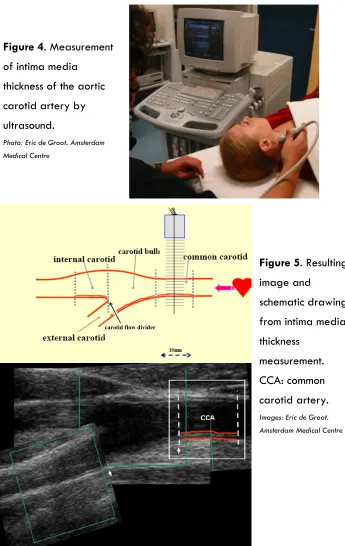
(25) Atherosclerosis and cardiovascular diseases. 1.3. Measurements of atherosclerosis. A review of the surrogate measures of atherosclerosis in air pollution research was presented by Künzli et al. (2011). A brief description of the most common surrogates and a detailed description of the ones used in this thesis, namely carotid intima media thickness and ankle brachial index, are provided. Carotid intima media thickness (IMT) measures the thickness of the artery walls, which is used as a marker of subclinical atherosclerosis. IMT is widely used in clinical trials and epidemiological studies and relies on non-invasive high-resolution ultrasound imaging coupled with automatic data processing systems (see Figures 4 and 5). It is associated with increased risks of CVD and with risk factors correlated with development and progression of carotid atherosclerosis in both population-based samples and high-risk populations (de Groot et al., 2008; Mancini et al., 2004). IMT predicts coronary heart disease, cardiovascular (MI, coronary death) and cerebrovascular events, such as stroke (Revkin et al., 2007), in both patients and asymptomatic individuals (Holewijn et al., 2010). Several studies report that IMT measurements are reliable and reproducible, although there is not a standardized measurement protocol and the optimal site of measurement remains controversial (common carotid, bifurcation, internal carotid, posterior (far) or anterior wall). Comparison between studies can thus be difficult. Longitudinal studies to assess the effect of clinical interventions have found that a reduction in cholesterol (total and LDL) is associated with regression of IMT in most cases and with inhibition of IMT progression in other cases (de Groot et al., 2008). Regarding prediction of clinical outcomes, it has been suggested that the reduction in CV risk factors is not always associated with reduction in IMT progression (Mancini et al., 2004), however, research in this topic is not conclusive. For example, angiotensin-converting enzyme (ACE) inhibitors reduce CV events in high-risk patients. However, several but not all clinical trials suggested that ACE inhibitors reduce IMT progression (Lonn et al., 2009). This could be explained by differences in measurements protocols, observational period, or by a pathway that is not mediated by IMT or atherosclerosis reduction (lower blood pressure, reduced left ventricular mass or reversal of endothelial dysfunction has been suggested (MacMahon et al., 2000)).. 25.
(26) Atherosclerosis and cardiovascular diseases. Arterial stiffness is a measure of the vessel elasticity during systole after applying pressure. This measurement relies on non-invasive ultrasound imaging or tonometry and measurement of blood pressure simultaneously. It predicts cardiovascular events, cardiovascular morbidity and all-cause mortality (Cavalcante et al., 2011). Ankle brachial index measures the ratio of blood pressure in the peripheral arteries (in the legs) to that in the proximal segments (in the arms). Low blood pressure in the legs, compared to the arms, indicates narrowing or blockage of the peripheral arteries. ABI is thus a marker of the degree of subclinical peripheral atherosclerosis and the severity of stenosis. Low ABI at rest predicts cardiovascular outcomes both in persons with underlying CVD and low-risk population. An index lower than 0.9 is associated with higher morbidity and mortality risks and is used as a cutoff point to diagnose peripheral arterial disease (PAD). An index higher than 1.3 has also been associated to higher mortality, calcification of the arterial wall and CVD risk factors. It relies on blood pressure measurements using Doppler technique. It is a simple, non-invasive and inexpensive test (Holewijn et al., 2010). Angiography is the former “gold standard” measurement of atherosclerosis (Revkin et al., 2007). It consisted in injecting a radiopaque contrast media in the blood vessels followed by x-ray imaging. The lumen of the vessels could then be measured from the images. The invasive nature of this technique with its inherent risks and limitation to symptomatic patients, and the exposure to radiation drove innovations toward non-invasive imaging techniques. Coronary artery calcification and aortic artery calcification are measures of coronary and systemic atherosclerosis, respectively, that predict clinical cardiovascular events (Pletcher et al., 2004). They rely on electron-beam or multi-detector computed tomography, noninvasive techniques that, however, expose to radiation. Retinal vessel diameter measure the micro-vascular atherosclerosis, which is related to cerebrovascular diseases, coronary calcifications, coronary morbidity and mortality, and risk of heart failure, and stroke (Mimoun et al., 2009). It relies on non-invasive retinal photography that poses no risks.. 26.
(27) Atherosclerosis and cardiovascular diseases. The use of these and other measurements in air pollution research has been discussed by Künzli et al. (2011). A summary table is provided in Table 1.. 27.
(28) Table 1. Scoring with regard to 5 criteria determining the usefulness of the outcome measure to investigate long-term atherogenic effects of ambient air pollution in epidemiological studies. Reproduced from (Künzli et al., 2011).. 28.
(29)
(30)
(31) Exposure to air pollution associated to atherosclerosis. 2. EXPOSURE TO AIR POLLUTION ASSOCIATED TO ATHEROSCLEROSIS. 2.1 Previous evidence The American Heart Association recently concluded that there is a causal relationship between traffic and combustion related air pollution and cardiovascular mortality and morbidity (Brook et al., 2010). Most of the evidence is on the associations between shortterm exposure to air pollution and clinical cardiovascular outcomes, such as acute myocardial infarction (AMI), stroke, all cause- and cardiovascular-mortality (Dominici et al., 2003; Katsouyanni et al., 2001; Ostro et al., 2011), and with subclinical measures or surrogates of CVD, such as increase in oxidative stress and systemic inflammation. There is epidemiological evidence on the association of long-term exposure with cardiovascular mortality and ischaemic heart disease, but more investigation on its association with subclinical measures or surrogates of CVD is needed. Particularly, it is not yet clear to what extent long-term exposure to air pollution contributes to the chronic processes of atherogenesis and how the observed acute effects due to short-term exposures may contribute to the chronic effect (Brook et al., 2010). There is evidence that long-term exposure to ambient particulate matter (PM) (Sun et al., 2005), ultrafine particles (UFP) (Araujo et al., 2008), and diesel and gasoline exhaust cause atherosclerosis and enhance plaque vulnerability in animals (Brook et al., 2010). But there are only a few human exposure studies. The first study was carried out in Los Angeles in a heterogeneous sample of 798 volunteers participating in two clinical trials (Künzli et al., 2005). A cross-sectional difference of 10 μg/m3annual residential PM2.5 was associated with a 4.2% increase in IMT (95%CI -0.2 to 8.9). This association was confirmed afterwards in a longitudinal study (Künzli et al., 2010; Künzli et al., 2005a) on 1503 participants of five clinical trials including those mentioned before. An increase of 10 μg/m3 PM2.5 was associated with an IMT progression rate of 2.53um per year (95%CI -0.31 to 5.38). Annual cross-sectional differences of 4.2 μg/m3 PM2.5 were associated with 4.3% increase (95%CI 1.9 to 6.7%) in IMT while no association was found for PM10 in 3380 population-based participants of the Heinz Nixdorf Recall study in Germany (Bauer et al., 2010). In a related study from the same 31.
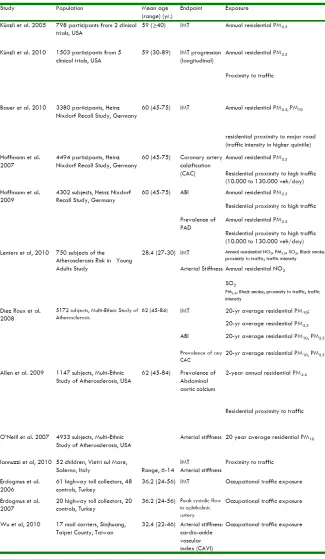
(32) Exposure to air pollution associated to atherosclerosis. cohort, PM2.5 was nonsignificantly associated with higher coronary artery calcification (Hoffmann et al., 2007). A population-based study in 750 young adults in the Netherlands found no association of annual residential NO2, PM2.5, SO2, black smoke, proximity to traffic and traffic intensity with IMT. Among the same measured pollutants, NO2 and SO2 were associated with arterial stiffness (Lenters et al., 2010). In a population-based sample of 5172 participants from the US Multi-Ethnic Study of Atherosclerosis (MESA) 20-yr average contrast in 2.5 µg/m3 PM2.5 and 21 µg/m3 PM10 were associated with 1% increase (95%CI 0 to 2%) and 3% increase (95%CI 1 to 5%) in IMT, respectively, while no association with carotid artery calcification was found (Diez Roux et al., 2008). In a cross-sectional study in 1147 participants of the same cohort, a difference of 10 μg/m3 of PM2.5 was associated with higher prevalence of abdominal aortic calcium (OR 1.06, 95%CI 0.96 to 1.16). In an occupational health study in Turkey, 61 highway toll collectors had 0.8mm thicker IMT (SD 0.2) on average, while 41 controls had IMT of 0.6mm (SD 0.1) (Erdogmus, 2006). Among the mentioned studies, four investigated the associations of subclinical atherosclerosis with proximity to traffic. Additionally, a cross-sectional study on children in Salerno, Italy (Iannuzzi et al., 2010) also evaluated this association. Only one of these studies found an association between residential proximity to traffic and IMT. In the study on volunteers of clinical trials, for participants living within 100m of a highway, representing 1.55% of the total sample, the progression of atherosclerosis was 5.46µm/yr (95%CI 0.13 to 10.8) faster than among those living further away. No association was found between exposure to PM and ABI. Neither 20-yr residential exposure to PM2.5 nor PM10 (Diez Roux et al., 2008) in the MESA study and one year exposure to PM2.5 (Hoffmann et al., 2009b) in 4302 participants from the Recall study, were associated with ABI. The Recall study also investigated associations with residential proximity to high traffic. This variable was associated with both ABI and prevalence of PAD. An odds ratio for PAD of 1.77 (95%CI 1.01 to 3.10) was found for participants living within 50m of a major road (10.000 to 130.000 veh/day) compared to those living more than 200m away (Hoffmann et al., 2009b). The characteristics of the study population, exposure assessment, main results and effect modifications of the mentioned studies, as 32.
(33) Exposure to air pollution associated to atherosclerosis. well as published studies on other subclinical markers of CVD are summarized in Table 2.. 33.
(34) Table 2. Population characteristics, exposure assessment, main results and effect modifications of the published epidemiological studies on subclinical markers of CVD. Adapted from Künzli et al. (2011). 34.
(35) 35.
(36) Exposure to air pollution associated to atherosclerosis. 2.2 Potential mechanisms involved Exposure to air-pollutants can mediate CVD through direct and indirect effects. Direct effects include systemic transmission of signals and translocation of gaseous pollutants, particle soluble constituents and possibly ultrafine particles into the blood and cardiovascular system, mediating acute effects within hours of pollutants inhalation. The direct pathway is thoroughly explained by Simkhovich et al. (2008) and Brook et al. (2010). The indirect effects include perturbations to the autonomic nervous system, which increases the low- and high-frequency heart rate variability, and pulmonary and systemic oxidative stress and inflammation, which is relevant to the atherogenic process. Pulmonary oxidative stress causes the release of pro-inflammatory mediators (e.g., cytokines, activated immune cells, or platelets) or vasculoactive molecules (e.g., circulating endothelin , possibly histamine, or microparticles) (Brook et al., 2010). But the inflammatory responses go beyond the lungs: exposure to particulate matter increases the serum levels of IL-6, which determines the synthesis of C-reactive protein, a marker of systemic inflammation directly associated with higher risk of CVD. The latter is also positively associated with exposure to total suspended particles (TSP) and PM. Inflammation through cytokines and C-reactive protein promotes atherosclerosis via the mechanisms previously described (Section 1.2).. 36.
(37)
(38)
(39) Measurement of traffic-related air pollution. 3. MEASUREMENT OF TRAFFIC-RELATED AIR POLLUTION. 3.1 Surrogates of traffic-related exposure The effects of traffic-related pollution on health started to be studied in the 1920’s as part of more general studies of the effects of air pollution (Henderson Y, 1921; Sayers et al., 1924). In 1931, the New York academy of medicine reported on the deleterious effects of prolonged exposure to heavy traffic presumably due to carbon monoxide levels (The New York Academy of Medicine, 1931). Exposure to traffic-related pollutants is, most of the times, still measured indirectly, for example, using atmospheric concentrations of one or a few components of the traffic-emitted mixture used as surrogates. The complex mixture of pollutants emitted by traffic is mainly generated in the fuel combustion process, but also in the resuspension of dust particles and brake and tire wearing. The most commonly used surrogates are NO2, NOx, particulate matter and SO2, among others. The most widely used surrogate in health effect studies is nitrogen dioxide (NO2). This is because affordable samplers have been developed for its passive measurement (based on diffusion without the need for air pumping); NO2 is regulated with standards available worldwide (See Appendix 1) and standardized measurement protocols; most NO emitted in combustion processes – traffic exhaust and industry- is converted to NO2; and it is the main contributor to the formation of tropospheric ozone (Brook et al., 2004). Particulate matter (PM), a mixture of solid and liquid particles generated by direct emissions (primary PM) and particle formation (secondary PM), is also widely used as a marker of traffic emissions. Primary particles are mainly composed of elemental carbon (EC, also called soot and black carbon), polycyclic aromatic hydrocarbons and metals. Secondary particulate matter is produced by the oxidation in the atmosphere of precursor pollutants such as NOx (53%), SO2 (22%) and NH3. Its composition depends on time (hour, day, season), climate variations, geographical position and emission sources. Sources of particulate matter include vehicle emissions, tire fragmentation and resuspension of road dust, fossil 39.
(40) Measurement of traffic-related air pollution. fuel combustion, metal processing, construction agriculture, domestic heating, wood burning, forest fires, cigarette smoke, natural trees, windblown soil, pollens and molds, forest fires, volcanic emissions, and sea spray. PM is classified depending on the diameter of the particles in PM10 the fraction with diameter less than 10 µm, coarse particles (PM2.5–PM10, diameter 2.5–10 µm), fine particles (PM2.5, diameter <2.5 µm), and ultrafine particles (UFP or PM0.1, diameter <0.1 µm). Nowadays, traffic contributes to approximately 15% (with a range of 4% to 25%) of PM2.5 at seven U.S. EPA supersites (Watson et al. 2008). In Barcelona, traffic was the main source of PM2.5 (vehicle exhaust contributed 30% of total mass) and PM10 (vehicle exhaust contributed18%, and road dust 17% of total mass) in weekly measurements, since 2003 to 2007 in an urban background monitoring station (Ostro et al., 2011). Measurements of particulate matter are obtained using a pump to draw ambient air at a constant flow rate into a specially shaped inlet, where particulate matter is separated into size fractions, and through a filter. Airborne particulate matter is then collected on the filter. The concentration of particles in the air is calculated dividing the particulate matter weight by the total volume of air filtered. Air quality guidelines of the European Union for these pollutants are presented in Appendix 1. Ultrafine particles (UFP) acquired relevancy in the last years due to their high proportion in the number of particles within PM, their high toxicity and capacity to reach the alveolar area in the lungs and, potentially, the circulatory system (Brook et al., 2010). Main sources of UFP include fuel combustion, wood smoke, industrial sources, and formation of new particles (nucleation) by chemical reactions with sulfate, nitrate and organic PM as precursors. The atmospheric lifetimes of UFP are short, and their concentrations decrease rapidly with distance from the source –such as roads- (Zhu et al., 2006). Between 52 to 86% of UFP (size range 20-800 nm) annual average (2003-2004) was emitted by vehicles at an urban background monitoring station in Barcelona (Pey et al., 2009). UFP can be measured as mass concentration in a similar way as described above for PM measurements or as number concentration by optical instruments that count the number of particles in a given volume of air pumped. These instruments have been used for short-term personal monitoring. Technology is, however, not yet ready for large-scale applications in epidemiologic studies because of the cost. 40.
(41) Measurement of traffic-related air pollution. of the monitors and the burden for the subjects (HEI Panel on the Health Effects of Traffic-Related Air Pollution, 2010). Specific constituents of particulate matter have also been used as traffic markers due to their high chemical reactivity and toxicity. Heavy metals are highly biorreactive elements –some of them, such as chromium, lead and arsenic can induce carcinogenic effects- that get bound to particulate matter of all size fractions. More toxic metals, however, show higher concentrations in the finer fractions of PM, for example lead, nickel, cadmium, copper, zinc and arsenic (Moreno et al., 2006). Due to specificity of metals as constituents of e.g. catalytic converters, brake pads or fuel additives, some are used as markers of emissions from those sources, for example, vanadium, chromium and nickel are related to fuel combustion; copper, antimony and molybdenum are markers of brake emissions. Metal concentrations for air pollution studies have been measured in tailpipe emissions, brake and tire wear emissions, roadway dust, roadway tunnel and ambient air. Only the latter have been used in epidemiological studies in humans. Heavy metal measurements consist in collecting particulate matter followed by chemical elemental analysis to identify the concentrations of metals in the PM collected. Exposure to traffic-related pollutants can also be assessed indirectly by measuring nearby traffic as a surrogate for pollutants from vehicle exhausts and/or resuspended dust (dust deposited on the road that is resuspended by passing traffic, wind and turbulences). Traffic measures include vehicle mix (i.e. diesel and gasoline-fueled or light and heavy-duty vehicle intensity), traffic intensity also called traffic density/volume/count (daily number of vehicles) in a given street or within a given buffer (e.g. 100m), traffic load (sum of traffic intensity multiplied by length of road segment in all segments of a given buffer), length of street segments in a given buffer and self-reported traffic exposures (e.g. nuisance of road traffic). All these approaches attempt to characterize exposure to near-road pollutants, thus, the term ‘proximity models’ is often used. Figure 3 shows the GIS maps and information used to calculate these measurements.. 41.
(42) Measurement of traffic-related air pollution. Figure 3. Example of GIS maps and information layers used to measure traffic proximity markers as surrogates of air pollution exposure. Red dots are monitoring sites. Purple circles are buffers around the monitoring sites.. 3.2 Exposure assessment As explained above, atherogenesis is a long-term process that develops over life time. The degree of atherosclerosis reached at any point in time is the cumulative sum of all pro- and antiatherogenic exposures. Accordingly, from an air pollution perspective, the relevant time-window for exposures leading to atherosclerosis development is as well the accumulated life-time exposure. Whereas life-time exposure is ultimately the sum of exposures over time – e.g. the sum of all daily exposures – the degree of atherosclerosis measured at some point in time point is not dependent on ‘yesterdays’ pollution’. The latter is informative to investigate the role of short-term exposure in triggering acute events. Instead, studies investigating the atherogenic role of pollution. 42.
(43) Measurement of traffic-related air pollution. need to assign some measures of long-term exposure. Being practically impossible to measure exposure during lifetime, studies have used estimates of pollution over shorter ‘long-term windows’, such as the average ambient concentrations of one or a few years, as a proxy. The detailed interplay between long- and short-term exposure in the development of atherosclerosis remains to be explored. However, there is no evidence of short-term pollution events such as isolated peaks (e.g. due to peaks in emission levels– e.g. traffic rush hours, unusual meteorological conditions, travelling to places with very contrasting pollution levels or compositions, or a smog episode etc.) and/or independent relevance for the chronic health effects. Therefore, studies on long-term effects of air pollution assume that the long-term mean concentrations (which include those peak conditions as well) reflect well the accumulated exposure. From a study design perspective, it is important to distinguish temporal and spatial variability of ambient air pollutants. Temporal variability is mostly driven by meteorological factors, which cause simultaneous variations in air pollution components, including those from different sources (Brauer, 2010). Since general meteorological conditions usually influence larger regions simultaneously, the temporal variability of air pollution within one urban area (or air shed) is typically rather homogeneous across space. In other words, the daily fluctuations are usually paralleled across larger areas. Spatial variability is instead due to the change in pollution levels from one place to another. Within a city or town the spatial variability is mainly driven by local sources of pollution such as industry, residential heating and in particular road traffic with its major influence at a very local spatial scale. The spatial contrast between different locations within an area as usually considered to be rather stable over several years, as empirically shown in a few studies (Hoek et al., 2008a). In the long run, the spatial variability within an urban area is often larger than the temporal variability (Hoek et al., 2008a). The differences in long-term exposure between individuals are thus well characterized by spatial variability in the average pollutant concentrations. The exposure assessment methods that are described next are focused on characterizing spatial variability in air pollution, although some could be extended or modified to capture temporal variability. Each of the surrogates described in the previous section was historically measured at specific locations, such as, near industries or at routine monitoring stations with the purpose of controlling levels to 43.
(44) Measurement of traffic-related air pollution. comply with limits set to protect humans and the environment from adverse effects. Environmental epidemiology studies on the effects of air-pollution made use of such measurements to compare populations exposed to different levels. Ecological estimates constituted one of the early exposure assessment methods of environmental epidemiology (Morris, 1981). Some pollutants -in particular primary pollutants such as NO and ultrafine particles- are unequally distributed across different areas within one town. Assignment of the same concentration, measured at a single monitor, to all people living within a city or community (Dockery et al., 1993), does not characterize differences in personal exposure to such pollutants (Carnow et al., 1969). Thus, the development of personal exposure monitoring within the environmental monitoring field (it has already been extensively used in industrial hygiene) was recommended by the National Academy of Sciences (Study Group on Environmental Monitoring, 1977). Personal monitoring is based on measuring air pollution levels with devices that are worn or carried by the participants. It is still considered today the method providing the most accurate estimates of actual personal exposure to specific pollutants per se. However, it has several practical disadvantages that limit its use particularly in long-term and also in large studies: it is expensive, labor intensive, the measurement period is limited to a few hours or days, and carrying the equipment and completing the time-activity diary, that is usually required, lead to respondent burden and the difficulty of ensuring compliance. Moreover, from a policy perspective, one is interested in the effects and burden related to pollution from a specific source, e.g. traffic, rather than a single pollutant per se (e.g. NO2). As long as there is no unique source-specific marker of pollution available, personal exposure measurements of a pollutant may not necessarily be more informative then some ambient monitoring or modeling approaches. E.g. a life-time measurement of personal exposure to NO2 will not enhance our understanding of the effects of traffic-related pollution given that the total personal exposure to NO2 is dependent on exposure to gas cooking, traffic, tobacco smoke and other sources of combustion. Thus, proper characterization of the ambient conditions, combined with information on the time people spend in these conditions remains a highly important approach to estimate personal exposure to outdoor air pollution.. 44.
(45) Measurement of traffic-related air pollution. Accordingly, refinements to the use of the pollution concentration at one or a few monitoring station started to get developed. Modeling to estimate pollution at unmeasured sites based on measurements at fewer sites was applied (Horie et al., 1976; Namekata et al., 1979; Sidorenko et al., 1972) and time activity patterns were incorporated to weight the pollution levels at different locations by the time spent at each location (Dockery et al., 1981; Moschandreas et al., 1979; Ott, 1982). Consequently, to characterize exposure at different locations, monitoring at indoor and outdoor residential environments, microenvironments and while commuting (Holland, 1983; Lambert et al., 1992; Ott et al., 1973; Ott, 1982) were implemented. Exposure assessment based on residential or personal monitoring alone is not efficient and even unrealistic for long-term studies. Although in the last decades the monitoring equipment have evolved and more accurate portable devices have become available nowadays, the biggest innovations in the exposure assessment field have been modeling techniques and software, which have been largely benefited from the development of GIS tools.. 3.3 Modeling approaches for the assessment of exposure to local pollutants. Economic and logistic constraints make it unfeasible to collect measurements from every participant (or his/her residence) of epidemiological studies. Thus several modeling techniques have been applied to estimate concentrations of pollutants based on information that is easier or less expensive to collect for all the study areas on a relevant scale (resolution). Models can be developed at every scale, from the very local (10’s of meters) to the regional and even country wide areas. For pollutants with high concentration variability on the intra-urban scale, such as NOx –including NO2 and in particular NO– and UFP, methods providing enough resolution are needed. The methods more widely used at the local-scale will be described. More detailed evaluation and comparison of methods, is given by Jerrett et al. (2004), Briggs (2005) and the Health Effects Institute (HEI Panel on the Health Effects of Traffic-Related Air Pollution, 2010). The latter two references describe the modeling on the regional scale. Proximity models estimate exposure as the concentration near by sources weighted by the distance from each source –e.g. distance to. 45.
(46) Measurement of traffic-related air pollution. traffic). For example distance to a road. Since emissions or concentrations levels at the roads are not available most of the time, the traffic intensity might be used as a surrogate. In cases where traffic intensity is neither available, the type of road (major road, highway, etc.) might be used instead. Distance cut-offs are also used to define exposure as a categorical variable; those living in the nearest buffer are more exposed than those living further away. Since these measures are based on source’s location and are unspecific to any single pollutant, they are advantageous when exposure to the source, rather than to an individual pollutant, is of interest (Briggs, 2005). Dispersion models are based on Gaussian dispersion equations, physicochemical laws and mass balance laws to estimate the concentration at a point for a specified time period given the background pollution levels, emissions, meteorological conditions and topography in the surrounds. They require thus an exhaustive quantity of input data that may not be available for many locations and are/or may be expensive. Emissions are usually specified as daily or annual means and thus, unmeasured temporal variability can introduce exposure measurement error. On the other hand, they incorporate spatial and temporal variability and can be applied at different spatial scales ranging from the regional (100–1000 km) to the micro (10–100 m) scale (Jerrett et al., 2004). (Geostatistical) Interpolation models provide predictions estimated by interpolating the concentrations at the nearest locations where the concentration is known (monitors). They rely on geostatistical techniques, ranging from the most simple such as inverse distance weighting to more complex such as, splines (fit n-order equations as a function of coordinates x and y) (Wood, 2003), kriging, universal kriging. A major advantage of kriging is that they provide the standard error of every predicted value, an indicator of its reliability. Universal kriging takes into account a global trend in the spatial variability in addition to the local variability. These models require a relatively dense monitoring network and a level of expertise to develop the analyses (Jerrett et al., 2004) but are attractive tools to apply e.g. to existing health data to assign exposure to individuals Künzli et al. (2005a). They assume a homogeneous spatial variability determined by distance, and do not take into account that dispersion is also determined by topography and buildings. It is also possible to include covariates measuring such determinants. The method is called co-kriging. 46.
(47) Measurement of traffic-related air pollution. Land use regression (LUR) models also called GIS-based pollution mapping, regression mapping or regression modeling are stochastic models that explain the spatial variability of air pollutants. In such equations, the measured concentration of a pollutant is the dependent variable and several predictors are tested as independent variables. Regression analysis is applied to find the set of independent variables that best describe the variability in the pollutant levels. The independent variables are potential determinants of the pollution levels, i.e. selected based on knowledge of physicochemical processes that govern pollutants formation and distribution. They could go from proximity variables, like distance to the nearest major road or distance to the nearest bus stop, to a description of the surroundings in terms of emission sources e.g. traffic intensity or area of ports, population density and built environment e.g. area of buildings or area of green spaces in a 100m radius. These variables are commonly derived using geographical information systems (GIS). LUR models do not require emission inventories and are a practical approach for the assessment of exposure to traffic-related pollution (Jerrett et al., 2004). Where sufficient measurements exists, LUR area-specific models can be developed locally offering an extremely high resolution (Briggs, 2005). This method also requires a dense monitoring network to obtain robust models (Basagaña et al., In press.). A detailed revision of LUR model performance and application is given by Hoek et al. (Hoek et al., 2008a). Space-time models also called dynamic modeling integrate models measuring spatial distribution of pollution with temporal patterns of pollution and/or time-activity patterns of people. Examples of models with time varying patterns linked to residential history have been used in epidemiological studies by Oosterlee et al. (Oosterlee et al., 1996) based on dispersion models and by Diez Roux et al. (2008) based on trend, cyclic and autoregressive components to derive the time variability and thin-plate splines to characterize the spatial variability. Space-time models integrating time-activity patterns have been implemented by Jensen et al. (2001) and Gulliver and Briggs (2005), who derived a dispersion model for different microenvironments coupled with people’s aggregated timeactivity data and individual-level data from activity diary surveys, respectively. Künzli et al (1997) adopted similar approaches to characterize long-term exposure to ozone where a Californian ozone surface was combined with time-activity information. Effect 47.
(48) Measurement of traffic-related air pollution. estimates of ozone on lung function in college students were however not sensitive to the inclusion or exclusion of personal time-activity information. Hybrid models combine different modeling techniques to determine local, urban and regional contributions/components of air pollution, and may also couple them with personal monitoring. Hoek et al. (2002) and Beelen et al. (2007a) derived hybrid models for application in epidemiology. They made separate estimates of local traffic-related, urban background and regional background concentrations of elemental carbon, NO2 and SO2 using inversedistance weighting and regression modeling. These models could also integrate time-activity patterns as in the so-called hybrid individual-exposure models (HEI Panel on the Health Effects of Traffic-Related Air Pollution, 2010). There is nothing that can be considered a generalized best approach or one that serves all purposes. Choosing which model or measure of exposure to use in an epidemiological study depends on 1) defining what is the exposure time-period relevant for the health effect under investigation, e.g. long-term or short-term; 2) the relevant pollutant, or the marker of a mix of pollutants to be characterized, which depends on the source or sources investigated; 3) The scale relevant to the exposure distribution, which should be determined based on the previous points and the geographical characteristics of the study area (see discussion in Section 9) and 4) the availability of information and resources (time, money and expertise) to be invested in the exposure assessment. Finally, it should be borne in mind that “All models are wrong” (Sterman, 2002), i.e. they are an estimate of a measure limited by what they were designed for. For example, routine monitoring is designed with regulatory purposes; models based on such measurements are thus not necessarily representative of the population’s exposure. Models account for only part of the total exposures (e.g. estimates for known and inventoried sources, individual pollutants rather than mixes, pollutants mass rather than components, average exposure rather than integrated exposure (Ott, 1982)) and part of the total variability of such exposures (e.g. unmeasured temporal variability from scattered events such as dust episodes or spatial variability not taken as a continuum but averaging pollution in microenvironments). Models are tools to guide decisions, to inform decisions, but it should be the researcher who 48.
(49) Measurement of traffic-related air pollution. makes those decisions taking into account the uncertainties inherent to the exposure model.. 49.
(50) Sant Joan les Fonts. Photo: Pere Crosas.
(51) Rationale. 4. RATIONALE. Since the 1990’s, numerous studies investigated the short-term effects of air-pollution on cardiovascular health. However, the evidence on the effects of long-term exposure on cardiovascular chronic processes, pathologies or diseases in humans is based on far fewer studies. The association of exposure to air pollution with markers of the degree of atherosclerosis has been investigated in 13 studies (see Table 2). Most, but not all of them, have found positive associations of air pollution with atherosclerosis (see Section 2.1). All except one study (Diez Roux et al., 2008) relied on 1-year estimates of residential pollution used as a proxy for long-term exposure. Besides, all studies relied on residential outdoor pollution levels derived from models based on measurements at a few monitoring locations. One study used a chemical dispersion model at a 1Km scale. Model-derived estimates of pollutant markers for longer term, e.g. 10-years, based on a dense network at the residential level would provide more precise exposure measurements, of added value to the assessment of their association with atherosclerosis. The REGICOR population-based cohort study conducted in the Girona region is a unique resource to investigate the atherosclerosisair pollution hypothesis in a Mediterranean region. The Girona region is particularly interesting given that the cardiovascular mortality rates are among the lowest in Europe while the established risk factors are among the highest. This is known as the French paradox (Masiá et al., 1998). This thesis is the first study on atherosclerosis and air pollution in the Mediterranean region. Considering the widespread exposure to traffic-related pollutants and the large, and rising, global burden of CVD, measuring the risks associated with long-term exposure to air-pollution is of great relevance for public health.. 51.
(52) Olot. 52. Photo: Pere Crosas.
(53) Objectives. 5. OBJECTIVES. General Objectives I. Assess the long-term exposure to traffic-related air pollution in Mediterranean towns. II. Evaluate the association of long-term exposure to trafficrelated air pollution with subclinical atherosclerosis. Specific Objectives 1. Develop spatial models to characterize the spatial distribution of NO2 based on long-term measurements at participant’s residences. 2. Characterize the long-term local distribution of heavy metals using mosses. Identify the main determinants of the spatial distribution of heavy metals in Girona, Spain. 3. Develop a traffic intensity road network database for the REGICOR-Air towns based on a short-term traffic count protocol. 4. Evaluate a monitoring strategy based on short-term UFP measurements in a highly dense monitoring network using mobile condensation particle counters to characterize the spatial variability of UFP. Test the performance of LUR models for ultrafine particles based on such short-term measurements in the region of Girona, Spain. 5. Investigate the effect of the number of measurement sites on the LUR model performance. 6. Investigate the association between long-term exposure to traffic-related air pollution and subclinical atherosclerosis in Spain.. 53.
(54) Llagostera. Photo:Z. Cochrane.
(55) Hypothesis. 6. HYPOTHESIS. This thesis developed and evaluated methods and tools for exposure assessment to ultimately investigate the following main hypothesis: Long-term exposure to traffic-related air-pollution is associated with subclinical atherosclerosis.. 55.
(56) Historical quarter and Onyar River, Girona city.. Photo: Albert Marin (www.graph.cat).
(57) Methods. 7. METHODS. This section provides a brief summary integrating the methods used for the different papers included in this thesis. Further methodological details can be found in the results section (Section 8).. 7.1 Study population and health assessment The REGICOR study is a series of population-based cohorts of randomly selected adults living in Girona province. This study’s main objective is to determine the prevalence, incidence and risk factors of the ischaemic heart disease in Spain (www.regicor.org). Within its framework, the REGICOR-Air project is an ongoing study that aims to determine the long-term effects of local traffic-related air pollution on cardiovascular health, including atherosclerosis. (Künzli et al., 2005a). This thesis is part of the REGICOR-Air project and is based on the follow-up of the cohorts originally enrolled in 1995, 2000 and 2005. The follow-up of such cohorts was conducted in 2007-2010 and included a complete reassessment of the health status and collection of address history linked to time period during the last 10 years. It also included measurements of the IMT of the carotid artery by ultrasound (Figures 4 and 5), which constitute the main health outcome in this thesis. A detailed description of the methodology is presented in Paper IV (page172). The study area of REGICOR-Air includes 12 towns of the province of Girona, Spain. These towns include settings like the average mid-size Mediterranean city of Girona and adjacent Salt, tourism getaways on the beach, industrial centers, maritime ports, historic quarters and small villages in the valleys and mountains. Most of these towns have a historical quarter used for residences and businesses with narrow streets and less than three-story buildings. The architecture in the downtown is also compact –high buildings and narrow streets– especially in the biggest towns. The façade of buildings and houses is separated from the road only by a narrow sidewalk and in a few cases also by a hallway or garden. Figures 6 and 7 are pictures of different areas of these towns. Other pictures are provided at the beginning of each section.. 57.
(58) Methods. A map of the study area is provided in Appendix 2 (KLM files can be viewed in Google Earth).. 58.
(59) Methods. Figure 4. Measurement of intima media thickness of the aortic carotid artery by ultrasound. Photo: Eric de Groot. Amsterdam Medical Centre. Figure 5. Resulting image and schematic drawing carotid flow divider. from intima media thickness measurement. CCA: common carotid artery. Images: Eric de Groot. Amsterdam Medical Centre. 59.
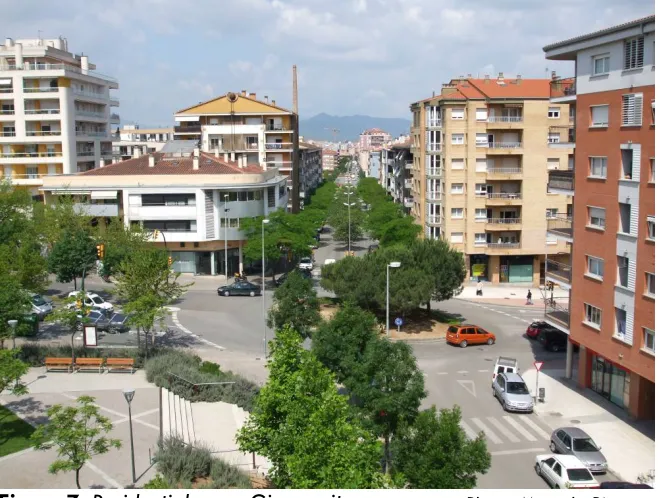
(60) Methods. Figure 6. Downtown Girona city.. Figure 7. Residential area. Girona city.. 60. Photo: Jesus (http://www.dzoom.org.es). Photo: Marcela Rivera.
Figure


+7


Documento similar
On the other hand, some research studies have also confirmed the under-representation of female journalists, especially in the categories of special reporters and
Given the short length of voice frames, the legacy DCF operation results extremely inefficient and the voice quality is highly vulnerable to data traffic.. On the one hand,
We have empirically studied the impact of packet sampling on the open-source Skype traffic detector Skypeness, which is based on three statistical features of Skype traffic:
In the European Community Respiratory Health Survey (ECRHS), in a previous analysis the assessment of the association between home outdoor NO2 (as a surrogate of traffic) and
In the previous sections we have shown how astronomical alignments and solar hierophanies – with a common interest in the solstices − were substantiated in the
The broad “WHO-ICF” perspective on HrWB provided at Figure 1 has a significant implication also for HRQoL. The develop- ment of ICF and its conceptual approach has challenged to
On the other hand, making use of equations (4) and (6), which account for the nonlinear contributions in the bias voltage, we have computed the power dissipated in the source
Tailings are frequently source of pollution in mining areas due to the spread
