DECISION SUPPORT SYSTEM FOR SEISMIC RISKS
María J. Somodevilla mariasg@cs.buap.mx Angeles B. Priego belemps@gmail.com Esteban Castillo ecjbuap@gmail.com
Ivo H. Pineda ipineda@cs.buap.mx
Darnes Vilariño darnes@cs.buap.mx
Angélica Nava jesusangie@gmail.com
Benemérita Universidad Autónoma de Puebla Facultad de Ciencias de la Computación
Av. San Claudio 14 Sur Col. San Manuel, 72000, Puebla, México
ABSTRACT
This paper focuses on prediction and prevention of seismic risk through a system for decision making. Data Warehousing and OLAP operations are applied, together with, data mining tools like association rules, decision trees and clustering to predict aspects such as location, time of year and/or earthquake magnitude, among others. The results of the data mining and data warehouse application help to confirm uncertainty about problems behavior in decision making, related to the prevention of seismic hazards.
Keywords: earthquake, Data Warehouse, OLAP, data mining.
1.
INTRODUCTION
Earthquakes are sudden movements of the Earth caused by the sudden release of energy accumulated over a long period of time. These are one of the leading causes of deaths and injuries associated with a natural event, that adversely affect the development of many populations, and these are threats that result in the deterioration of the countries and environment economy [1].
Given uncertainty of earthquake occurrence, finding relevant patterns to reduce the impact of earthquakes is of vital importance. Therefore, the technologies used to access and manipulate large volumes of data, to find relevant patterns, are data warehouse and data mining. The first technology is a collection of historical data related to a particular field-oriented, integrated, nonvolatile and time variant [2], which provides operations that can manipulate data through hierarchies. Data mining is a no trivial process to identify valid, novel, potentially useful and ultimately understandable patterns from the data [3]. The basis
of data mining is artificial intelligence and statistical analysis. The models obtained are in two lines of analysis:
Descriptive model: The fundamental mission of data mining is to discover rules; a set of relationships between variables may be established, allowing benefit in analysis and description of the model. In this category are techniques such as correlation and factorizations, clustering and association rules [3].
Predictive model: Once you have established a number of important rules of the model through the description. Rules can be used to predict some output variables. It may be in the case of sequences over time, future fluctuations in the bag, to prevent catastrophic events such as earthquakes, likes the ones studied in this paper. Working with this model considers tasks like classification and regression [3].
The goal of a decision support system that utilizes data mining techniques is to use a model in order to generate predictions. For this work, we make assumptions based on earthquakes around the world, taking into account the main characteristics of the earthquake magnitude and location.
2.
DATASETS DESCRIPTION
The main external sources of information were: U.S. Geological Survey (USGS), National Seismic System of Mexico (SSN) and National Earthquake Information (NEIC).
The U.S. Geological Survey is a scientific organization that provides unbiased information on the health of ecosystems and its environment, natural disasters are a threat, the natural resources that are based on the impact of climate change and land use that help providing timely, relevant and useful information [4].
The National Seismological Service of Mexico is an organization that provides timely information on earthquakes in the country. It is responsible for providing the information needed to improve the ability to evaluate and prevent the risk of earthquakes [5].
The National Earthquake Information Center determines the location and size of all destructive earthquakes worldwide, it also disseminates this information to national and international scientists and organizations. Moreover, it maintains an extensive global database on seismic parameters of the earthquake and its effects, and it serves as a solid foundation for basic research and applied earth sciences [6].
This project uses data from these organizations, in order to preprocess them and obtain all relevant features to be used for the data mining stage. Table 1 shows information structure from these organizations. Data Visualization: Correlations & Factorizations
[image:2.595.325.538.242.326.2]For this work we consider one fact, since an area has experienced many major earthquakes in the past, it is more likely that an earthquake will happen again.
Table 1. USGS, SSN and NEIC Data.
Organization No. of Registres
No. of attributes
Attributes
USGS 12790 10 Size, Date, Location, Depth, Region, Country, No. dead, No. injuries, Losses, Distances
SSN 11981 7 Size, Date, Location, Depth, Region, Country, Distances
NEIC 13948 6 Size, Date, Location, No. dead, No. injuries, Losses
In another consideration, after an earthquake, with a high level of dissipated energy and/or with a high level in the scale, has occurred data shows that region is classified as a low risk area; but unfortunately this has not always been met and in many areas designated as low risk, earthquakes have occurred. Analyzing data we came up with a pattern of occurrence that suggests some sort of correlation between latitude and longitude with earthquake occurrence. Looking at both figures separately, from Figure 1, it can be seen that the greatest number of earthquakes are concentrated between the latitude 63.220 ± 300, and in longitude, between [-179.460,179.80].
Figure 1. Latitude & Longitude.
In Figure 2 it can be seen earthquakes ranging from 4.45 to 9.0 on the Richter scale concentrating most of them between 4.45 and 6.4. The average value of the earthquakes selected for this study is 6.16 on the Richter’s scale. This value gives an idea of the magnitude of the phenomenon.
[image:2.595.81.304.590.776.2]Recorded data (fig. 3) suggests a relationship between a numbers of earthquakes with the hour and day of an earthquake, the histograms show a higher concentration of earthquakes around the sixteen day of a month and before 4 clock in the morning . However there is no scientific reason for the occurrence of a seismic event in the morning. In fact it is considered a myth; several strong earthquakes have been in the morning, having surprised the people sleeping in their homes, even though people believe that most of the big earthquakes happen at that time, but reality that earthquakes can occur at any time of day.
[image:2.595.329.532.621.731.2]Figure 3. Days of month and time of day.
3.
DECISION SUPPORT
SYSTEM DESIGN
[image:3.595.320.542.149.407.2]Data warehouses and OLAP systems help to interactively analyze huge amounts of data. These data, extracted from transactional databases, frequently contains spatial information that is useful for the decision-making process [7]. In this process, the information collected is used to create a data warehouse using SQL server technology. Then, the data warehouse gives us the ability to add data according to defined hierarchies, in order to apply data mining techniques. Figure 4 shows the decision support system proposed in this work for seismic risks.
Figure 4. Architecture of the decision support system for seismic risks.
Load Manager Process
The load management process is also known as ETL system (Fig. 4), which stands for Extraction, Transformation, and Load consists of:
Extraction: Once the data were obtained from the USGS, NEIC and SSN, it is analyzed efficiently. As shown in Table 1 the attributes: size, date and
location are repeated in the three organizations and attributes number of injuries, deaths and losses are in two organizations. As a part of the extraction process, a dataset is generated to be used in the data warehouse creation (Table 2), avoiding duplication in order to ensure data integrity.
Transformation: Records of seismic events containing five or more null values were eliminated; records with an attribute out of range (values not adjusted for the overall behavior of the data) were also eliminated. To fill the empty data in some measures, it was necessary to exhaustively search in order to have complete events; available attribute values were averaged to complete the records. For
[image:3.595.87.300.362.467.2]seismic event occurrence time, the UTC (Coordinated Universal Time) format was adopted where; time is represented in hours, minutes and seconds. Date format is represented as year, month and day and depth in kilometers.
Table 2. Integrated Dataset.
Attribute Instance
Magnitude 9.0
Date Localization
Friday, March 11, 2011 05:46:23 38.322°N, 142.369°E
Depth 32 km
Region Honshu Coast
Country No. deads No. injuries Losses Distance
Japan 6,539 10,259 143,000,000
129 km from Sendai, 177 km from Yamagata,
177 km from Fukushima, 173 km from Tokio
Load: At this stage, the transformed data were loaded into the system by using SQL Server1 technology for data warehouse and Weka2 for data mining. So far, it has only been carried out the initial charge and plans to update the data warehouse annually.
Multidimensional Schema
To develop the data warehouse, we used Kimball’s methodology [8,9] based on a bottom-up multidimensional modeling, which will use a snowflake pattern as shown in Figure 5.
Figure 5. Multidimensional schema for seismic events prevention.
1SQL Server database management system 2
[image:3.595.324.538.600.692.2]OLAP Operations
[image:4.595.333.530.205.325.2]OLAP tools present to the user a multidimensional view of data (multidimensional scheme) for each activity which should be analyzed. In doing so, some attributes of the scheme are selected without knowing the internal structure of the data warehouse, creating a query and sending it to the manager consultation system. These tools were implemented to generalize the acquired information. The more significant type of OLAP queries that were made in this work are listed in Table 3.
Table 3. OLAP Queries.
The results in Table 3 confirm that the higher the magnitude of a seismic event, it corresponds more human and monetary losses. Such operations consisted on obtain measures on the parameterized facts for each attributes of the dimensions and restricted by conditions imposed on the dimensions.
4. TECHNICAL DESCRIPTION OF
DATA MINING APPLIED TO DATA
SOURCES
The first task of mining is pre-processing data, which can ensure better results during the experiments. This process was already done building the data warehouse.
Application of Data Mining Techniques
As we already mentioned, the techniques of data mining comes from artificial intelligence and statistics, these techniques consist on algorithms which are applied to a set of data for results. These techniques are classified into descriptive and predictive, and those which were used in this work are explained in the following sections.
Descriptive Techniques
For this particular case, a clustering technique was used, as in fig. 3, we have some sense of grouping, the histograms suggest that and it is briefly described below:
[image:4.595.83.308.229.359.2]Clustering: It is a process of grouping a series of vectors according to criteria routinely away, which will try to arrange the input vectors so that they are closer those who have common features [3]. K-Means: It was the first technique used to preview the dataset, suggesting 3 groups of types of earthquakes according to magnitude, as shown in Figure 6. Since all data is numeric, K-Means fits perfectly. This technique also allows partitioning the data into groups taking into account the Euclidean distance criterion.
Figure 6. Earthquakes´ clusters by magnitude.
Association Rules: Among the different methods of data mining to find interesting patterns are association rules (AR). AR can provide features that at first glance may not be visible in a large data set , since its ease of understanding and effective in time to find interesting relationships. In the case of earthquakes some features bear a significant relationship at the time of submission, as is the depth given the magnitude of a seismic event or location of a seismic event given its magnitude and position. So, the use of the technique on seismic data set allows us to find useful rules (logical expressions composed of attributes and connective) in earthquakes analysis tasks. The Apriori algorithm is based on prior knowledge of frequent sets, this serves to reduce the search space and besides increase efficiency.
Predictive Techniques
Classification trees: A set of conditions is organized in a hierarchical structure, so the final decision can be determined according to the conditions to be met from the path from root to some of its leaves. One of the great advantages of classification trees is that, choices from a given condition are mutually exclusive [3]. In particular, J48 algorithm generates a classification tree from data taken by performing a recursive data partition. The tree was constructed using depth-first strategy [10]. The classification trees were used to answer the question, can you determine the depth of a seismic event due to its magnitude?
Naïve Bayes: A probabilistic classifier based on the application of Bayes theorem considering each event as independent. In simple terms Naïve Bayes
Query´s Results
No. of deaths from year 1900 to 2011 4,389,402
No. of deaths in earthquakes with magnitude >= 8 ° Richter
448,727
Monetary losses from year 1900 to 2011 $641,514,875
classifier assumes that the presence or absence of a particular characteristic of a particular class is not related to the presence or absence of other property in another class. The classifier works with the maximum likelihood method where Bayes model can be used without believing in the Bayesian probability. Naïve Bayes has proven to be very efficient when using a supervised learning and having a small set of elements for training, so in the case of earthquakes is useful because it is not possible to keep track of all earthquakes that occur daily in all the world.
Linear Regression: It is a method, which predicts the numerical value for a variable from the known values of others. The definition of this method is somewhat similar to the classification with the difference that in the regression are predictive variables and a numeric class variable. For the case of earthquakes, it is useful because this type of method can calculate or predict important elements of earthquakes by means of other more visible variables, as is the case of obtaining the monetary losses associated with a seismic event as a dependency of the earthquake magnitude, location, depth and more. One difference between simple regression and linear regression is that in the simple regression there is only one dependent variable while in the linear regression more than one dependent variable.
5. DISCUSSION
This section shows the results of the execution of each data mining technique described in section 4.
Descriptive Techniques Clustering
A first experiment, K-Means was applied to the dataset, with k = 3 clusters. As a result we have that
magnitude, time and depth, which are discriminatory variables, they help to determine seismic events specially those that occurred during a period of [07, 15] hrs. Moreover, it can be noticed, that most of the earthquakes, has a depth in the range of 63.71 km, indicating that they are shallow earthquakes (occurring in the crust). In table 4, centroides of each cluster, are shown.
Finally, it can be verified according to Figure 7, in terms of economic losses, deaths and injuries, that
they are properly classified since the parameters are usually similar to the seismic events of similar
[image:5.595.322.540.71.254.2]magnitude.
Table 4. K-Means results.
Figure 7. Clusters comparison.
Association Rules
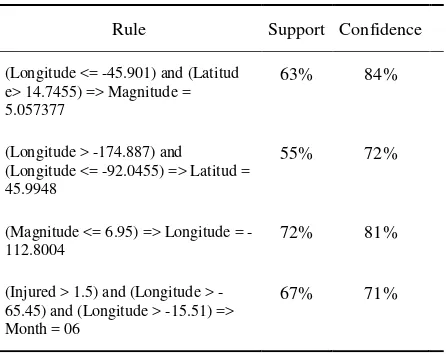
[image:5.595.320.543.591.768.2]To run this method were considered the attributes present in a seismic event such as latitude, longitude, depth, size, number of deaths, number of injuries, time and monetary losses. The measures used in association rules to determine the threshold of significance and interest of a particular rule are greater than 55% support and 70% confidence. Below are shown in Table 5 the rules found.
Table 5. Association rules results.
Attribute Cluster 1 Cluster 2 Cluster 3
Magnitude 3.7034 4.1582 3.2767
Month Day Hour
07 18 17
07 16 15
07 18 12
Depth 71.5534 63.8709 45.8167
No. deads No. injuries Losses
40.069 248.8136 115438.3873
33.7273 590.7082 221675.1252
22.7667 256.7512 134580.22789
Rule Support Confidence
(Longitude <= -45.901) and (Latitud e> 14.7455) => Magnitude = 5.057377
63% 84%
(Longitude > -174.887) and (Longitude <= -92.0455) => Latitud = 45.9948
55% 72%
(Magnitude <= 6.95) => Longitude = -112.8004
72% 81%
(Injured > 1.5) and (Longitude > -65.45) and (Longitude > -15.51) => Month = 06
Predictive Techniques J48
[image:6.595.319.544.174.580.2]The first step in solving complex problems is to divide them into smaller sub-problems. The classification tree was used to determine a base model according to the patterns. The input to this model is the depth attribute allowing determination of the magnitude. Figure 8 is a graphical representation of this tree. According to the question stated, it is indeed possible to determine the depth of the seismic event based on its magnitude. This technique has a 6% classification error, therefore correctly classified 94% of instances.
Figure 8. Classification tree of seismic events.
Naïve Bayes
[image:6.595.90.299.225.314.2]To use this classifier 6 classes were taken, minor, light, moderate, strong, major and large, which represent the magnitude of an earthquake regarding seismic Richter scale, which ranges from 1 to 10. The results obtained by applying Naïve Bayes with a cross validation of 10 show the means of each class with respect to latitude, longitude, depth and magnitude. Table 6 shows the average size of each type of earthquake and the depth associated with it, or the average area which every type of earthquake (i.e. by latitude and longitude) could have occurred. For this case the classification error rate is 11% and the percentage of correctly classified instances is 89%.
Table 6. Naïve Bayes Results.
Latitude Longitude Depth Magnitude Type of quake
35.359 -99.607 42.0262 2.9388 Minor
17.353 19.1996 69.5031 4.6011 Light
12.112 63.0489 108.537 8
5.3045 Moderate
31.9981 26.6038 67.7557 6.4602 Strong
11.0425 115.259 50.0155 7.6481 Major
10.3523 113.012 29.5174 8.1944 Large
Linear Regression
To implement this model data from the database earthquakes was used, making a previous debug data by discriminating the string data, which are not useful for the implementation of this model. Table 7 presents the final data set.
Table 7. Dataset for Lineal Regression
Attribute Type Used
Year Nominal SI
Month Nominal SI
Day Nominal SI
Hour Nominal SI
Minute Nominal SI
Second Real SI
Latitude Real SI
Longitude Real SI
Depth Real SI
Country String NO
Region String NO
Population String NO
Deaths Real SI
Injuries Real SI
Losses Real SI
Magnitude Real SI
Type Nominal SI
[image:6.595.81.307.565.750.2]Table 8. Linear Regression Results.
6. CONCLUSIONS
According to the results, we discovered relationships among different sets. As a result of this analysis, it has been highly correlated with indicators to predict earthquakes; example is the identification of areas where there is a high level of seismic activity and identification of areas with high probability of having a new event. When spatial coordinates, magnitude and time are used we noticed that Pacific coast is an area with high occurrence of earthquakes, also it is important to mention that other areas are also considered.
Predictions of great importance were made, in order to make decisions to greatly reduce the damage and effects on vulnerable areas, thus achieving a beneficial impact to minimize the risk factors as the number of deaths, injuries and losses in construction. In the same way and based on the magnitude of the earthquakes predictions were obtained that will make immediate decisions after the earthquake.
A set of appropriate data and tools i.e. Weka, it allows us drawn conclusions, that at first glance would be difficult to discover. Results reached after various analyses shown, that earthquakes tend to have an average magnitude of 6.16 on the Richter’s scale being mostly superficial. Besides, days with increased occurrence of a seismic event were found from 15 to 18 of the month.
7. REFERENCES
[1] Sivakumar Harinath, Stephen R. Quinn, Professional SQL Server Analysis Services 2005 with MDX , Inox, 2005
[2] Red Sísmica del CICESE:
http://sismologia.cicese.mx/resnom/principal/ [3] José Hernández Orallo, María José Ramírez Quintana, César Ferri Ramírez: Introducción a la Minería de Datos, Pearson/Prentice Hall, 2004 [4] El Servicio Geológico de EE.UU.
http://www.usgs.gov/
[5] Sistema Sismológico Nacional http://www.ssn.unam.mx/
[6] Centro Nacional de Información sobre Terremotos
http://earthquake.usgs.gov/regional/neic/
[7] Franklin, C. An introduction to Geographic Information Systems: Linking Maps to databases. Database. 1992.
[8] Kimball & Ross, The Kimball Group Reader; Relentlessly Practical Tools for Data Warehousing and Business Intelligence, Indianapolis, Wiley, 2010.
[9] Kimball et al., The Data Warehouse Lifecycle Toolkit. 2nd Edition. New York, Wiley, 2008. [10] Daniel Santin González, Cesar Pérez López : Minería de datos: Técnicas y Herramientas, Madrid, Thompson , 2007.
.
Rule
Magnitude = -0.0045 * Latitude + 0.0089 * Longitude + 5.2109
Deaths = 40.6026 * Magnitude -9.4977
Losses = 237852638041.0203 * Day =18 + 2.4974
Losses = 2040547794867.1268 * Year =1989 +1.1715