Challenges of Streaming in the Visualization Process
*Sebastián Escarza1, 2 - Silvia M. Castro2 - Sergio R. Martig2
1
Consejo Nacional de Investigaciones Científicas y Técnicas (CONICET)
2VyGLab - Dpto. de Ciencias e Ingeniería de la Computación - Universidad Nacional del Sur
Av. Alem 1253 - 8000 Bahía Blanca - Buenos Aires - Argentina {se,smc,srm}@cs.uns.edu.ar
Abstract
In visualization applications, the data has been increasing its size at very big rates. Processing of the whole data in main memory becomes impossible due to size limitations. A way of dealing with this constraint is to apply streaming to the visualization. The key idea is to exploit data locality in relationships to produce constant and continuous streams of data flowing through the visualization process. Issues like data dependencies, stream re-arranging, use of progressive algorithms, etc. have to be taken in consideration. In this paper we outline the main issues derived from the application of streaming in visualization. Our main objective is their identification as a previous step to define a general streaming framework for visualization. Some of the results presented here arose during the design and development of ad-hoc prototypes that we made as an initial approximation to the problem.
Keywords: Visualization, Streaming, Streaming Data Visualization
*
1 INTRODUCTION
An important issue in Visualization is the efficient processing of an ever increasing data volume. The processing of the whole data in main memory becomes impossible due to size limitations and new techniques have to be applied. A way of dealing with this constraint is the implementation of secondary memory data structures. However, it is not always necessary to keep access to the entire dataset to perform the processing. In Visualization, almost invariably, a localized portion of data is used during data analysis, cleaning and filtering, attribute selection, layout calculations, visual mapping, rendering, etc.
This locality can be exploited in order to avoid the storage of the entire dataset in each processing stage. If each stage’s incoming dataflow is arranged in such a way that the processing can start before the whole data is received, the processed data items could be transferred to the next stage and then released when they are not longer needed. This strategy saves computational resources and allows performing data processing in a streamed and potentially pipelined fashion.
Streaming has been widely used to deliver audio, video and multimedia. End-user constantly receives the media while it is delivered by the provider, without download it completely before playback begins. Multimedia streaming requires media formats and protocols specifically designed to support it; time locality is exploited along subsequent video frames or audio fragments. Although streaming on data sets is a relatively new matter, the same elements can be identified. However, data streaming may lead to many issues. In general, the locality does not arise trivially from the data and there is not a time scale that guides the communication between stages. Thus, other relationships among data items have to be found to establish their transfer order and attain a localized processing.
Structuring the visualization pipeline for streaming poses several challenges. It is necessary to arrange the data in order to send it to the next stage. Data dependencies have to be analyzed and solved in order to process related data items together. It is desirable to have the required data before the stage’s processing begins to reduce the required amount of memory. Another important issue is the requirement for progressive algorithms that could perform operations step by step over the dataset. These algorithms should run when new data arrive and perform their activities without re-execute previous computations that were done as consequence of previously received data items. In this way, these received items would not be longer needed and could be deallocated.
This paper outlines the key aspects in applying streaming in visualization. Apart from theoretical research, we have been done some preliminary design and implementation efforts as a first approach to the problem. Visualization tool prototypes allowed us to get a more concrete view of the problem and to draw some of the conclusions presented here.
consequence of interactions. Finally, we address related work about streaming in visualization and present our conclusions and future work.
2 STREAMING IN VISUALIZATION
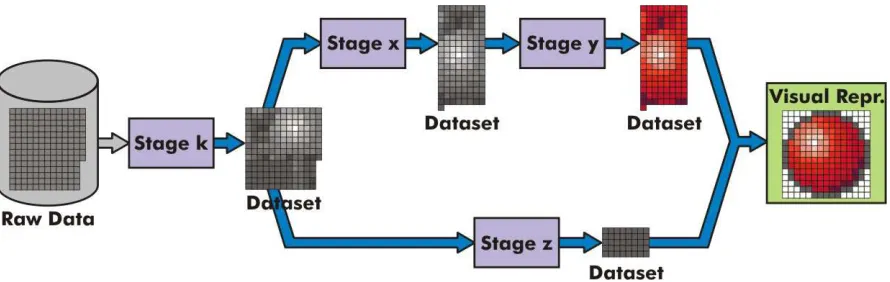
[image:3.595.77.522.389.530.2]A common practice in Visualization is structuring the process in pipeline or, more generally speaking, in execution networks (we will use both terms interchangeably along this paper). We have connected stages, where transformations and calculations are performed, and, between them, some buffering mechanism to maintain entities until they be further processed (figure 1). By processing data concurrently in several stages, this architecture leads to a greater flexibility and performance. However, visualization stages usually transform the entire dataset in order to make available their output to further stages instead of sending data items one by one through the pipeline. This simplifies the design and implementation of the visualization because stages that receive those outputs can presume complete access to datasets. The two major drawbacks of this approach are the performance penalty that arises when the receiving stages have to wait for intermediate data to proceed, and the fact that the whole output must be kept in memory while receiving stages process it.
Figure 1: A traditional visualization network. After the processing at each stage, a dataset is generated as output. This dataset is the input of the next stage and is maintained until the next stage process finishes. Only when these datasets are completely built, next stages can proceed. Intermediate datasets can be stored to avoid their regeneration or released to save memory when they are no longer needed. Anyway, enough storage for them is always required.
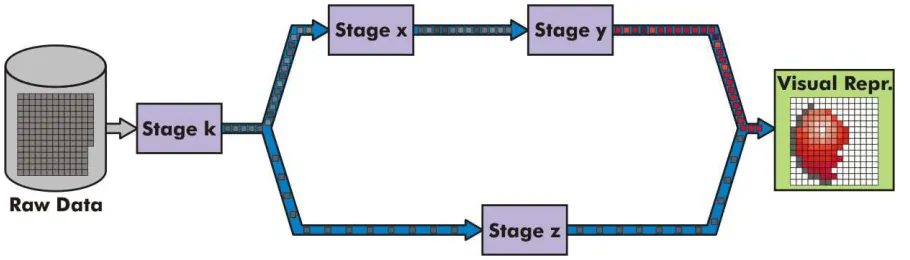
Figure 2: The streamed version of the previous visualization network. This figure shows an intermediate state in the processing. In contrast with figure 1, data items are flowing through the visualization and there are no intermediate buffered datasets in the process. Each data item is processed on the fly and routed to the correct stage. Reader should notice how the visual representation is built as long as processed data items arrive.
Nevertheless, streaming imposes its own challenges. Items in a visualization pipeline could be processed isolated or linked together. The former case occurs when the computation over some data item does not require any others to be completed. For example, maximum, minimum or average calculations, and non-topological filtering like attribute value based filtering can be solved by taking each data item one at a time without any dependency from others. By contrast, a linked process is the only alternative when there are dependencies between data items. For example, calculating tree metrics such as tree depth or any graph based metric requires knowing in advance the metric values from neighbor nodes and, consequently, the node and its neighbors must be processed together.
In the presence of isolated items, the pipeline can progress without restrictions. Items can enter into stages as soon as the stages are freed. However, when some items are involved in the processing of some others, the processing cannot continue until all these items are available. This may lead to an excessive accumulation of pending items inside stage buffers producing an increment in the overall memory consumption. Also, performance bottlenecks may arise because stages have to wait the required data in order to complete their processing. Therefore, if no measures are taken to avoid these problems, performance gains because of streaming could not be obtained.
3 REQUIREMENTS FOR STREAMING
As was stated in the previous section, introducing streaming in visualization is not an easy task. There are requirements that must be met to achieve higher performance and significant reductions in resource consumption.
Another essential requirement is the modification to the visualization algorithms. Deal with data streams instead of full accessible datasets stands new design challenges. Items have to be forwarded as soon as they are processed. Little or no auxiliary storage has to be used. An algorithm cannot simply collect the whole stream and rebuild the entire dataset to perform its calculations because this would frustrate the entire streaming effort. Visualization algorithms have to make do with only the tiny part of the total dataset that is available through the input stream. Also, they have to contribute to the output stream as soon as possible to do not delay the process.
In the following sections we give a detailed discussion about these requirements and provide some examples about the impact of the streaming in visualization.
4 DATA DEPENDENCIES
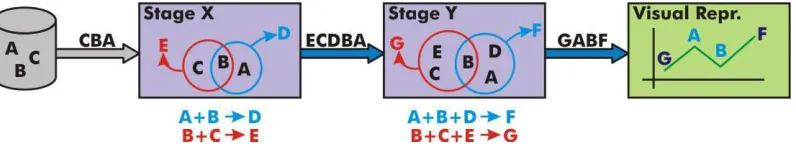
[image:5.595.102.500.404.478.2]The visualization process involves many data calculations from its input up to the building of the visual representation. Those calculations require some data items as input and produce other items as output. The dependences established among data items constrain how they flow through the visualization pipeline. The goal of data dependency analysis is the identification of locally related sets of items to process together. As result of this analysis, a partial ordering of the pipeline flow of items that exploit data locality is obtained (figure 3).
Figure 3: A schematized streamed visualization pipeline showing data dependencies. Raw dataset have 3 items: A, B and C. In stage X, the calculation of D depends on A and B, and the calculation of E depends on B and C. In stage Y something similar occurs. F depends on A, B and D; and G depends on B, C and E. These dependencies arise from each stage processing. Between stages the ordered streams of items can be appreciated. Reader should also notice that C, D and E are filtered and they are not present in the final visual representation.
Data dependences may vary in term of the performed operations. In some dataset, some items can be related from the perspective of some calculation but can remain unrelated from the viewpoint of another. For example, two graph nodes linked by an edge, should be processed together by a graph traversal algorithm which calculates some path based metric. However, if the computation changes some graphical attribute such as color to provide feedback to user about a node selection, the processing order of these two graph nodes is negligible. These variations on data dependencies, as a function of the processing, stand a key issue because some kind of coordination between stages becomes necessary in order to agree about what data items transfer together.
some way. This causes these relationships had to be considered during visualization process. As a result, the way in which data items are processed and transferred through the visualization pipeline is constrained by the associations among them.
Another problem with dependencies embedded in raw datasets occurs during the reading or parsing of the input data. No matter whether the data comes from a file or through the network, it cannot be ensured that the order in which items are received was a function of existing dependencies in dataset. Datasets that were not conceived for streaming do not ensure any order while are serialized and complicate the visualization input. For that reason, avoiding complete dataset loading not always is possible without reordering the dataset.
By contrast to dependencies embedded in raw datasets from scratch, some dependencies are originated in the visualization process itself. This occurs when some stage in the visualization process establishes links between data items and it is desirable to perform some further processing following these links. Clustering algorithms define groups of similar entities and add new dependencies to layout algorithms because cluster members have to be drawn close together. Interpolating and approximating algorithms and, in general, every algorithm that derive new data from the existing one, establish new data items and new relationships. These dependencies, despite arising later in the visualization process, impose the same constraints and stand the same challenges that those embedded in datasets from beginning.
Another aspect that has great impact in determining relationships among items is the structure of the input dataset. In the presence of a heavily structured data set, for example a rectilinear grid, related data items are implicitly stated. The ordering in which transfer these nodes can be directly obtained from the underlying topology. However, if an unstructured dataset such as a graph is considered, dependency analysis becomes cumbersome. In these cases, it is usual to have some basic or “atomic” items that do not reference any other, and a family of items that reference the “atomic” ones. After that, other items reference these last ones and so on. Thus, if these pseudo-layers of dependencies are identified, it is possible to exploit them to decide the order in which send the nodes. However, sometimes the structure does not have layers at all or contains loops making difficult the design of general approaches to deal with the dependency problem.
Along this section we have examined the main issues that are involved in dependency discovering. It is important to notice that dependencies, despite their existence, do not care until they are considered for some stage processing. Dependencies neglected by visualization do not constrain the streaming at all. By taking into account the dependencies involved in the visualization process and reordering the dataflow accordingly, the data locality can be exploited to get more benefits from the streaming.
5 ARRANGING THE DATAFLOW
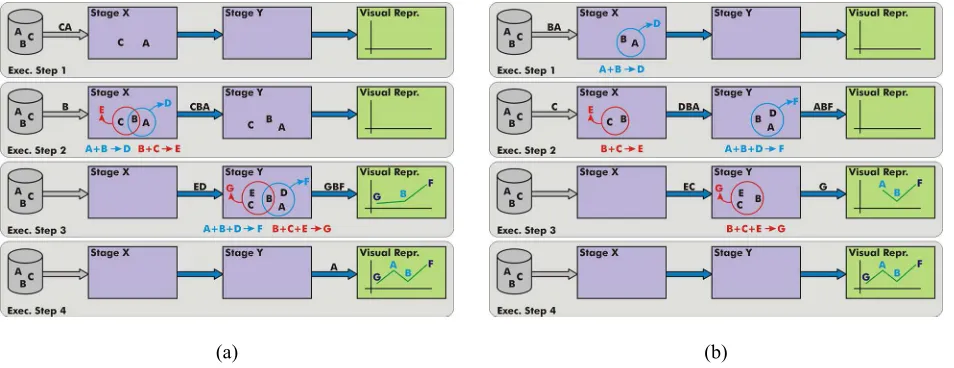
(a) (b)
Figure 4: Flow ordering issues. Both sub-figures show four steps in the execution of the visualization pipeline of the figure 3. In the figure 4(a) an improper item ordering is showed. Initially, A and C are transferred to Stage X and nothing can be done there. When B arrives to X in step 2, both D and E can be calculated. However, the items sent to Y are A, B and C and this stage can also do nothing. In the third step D and E arrive to Y and F and G can be computed. Then, F, B and G are transferred to the visual representation stage where a partial view is built. Finally A is sent from Y to the last stage and the process finishes. In the figure 4(b) the same transferences occur (the same overall bandwidth is used between stages), but in a better order. Notice how each stage can compute values as soon as possible avoiding assigning storage for idle items (in figure 4(a), A and C in step 1 in X and A, B and C in step 2 in Y are wasting storage). Also, the computation is better spread in time because each stage performs one calculation in each step (against the two from the other figure). Observe the communication between X and Y in figure 4(b). The stream between these stages is A, B and D and is according to calculation dependencies. X needed some information about the calculations of Y to decide sending DBA instead of other items. Another aspect to consider is the construction of the visual representation. This construction occurs while items arrive. Here it is necessary a progressive algorithm that does not have to restart when a new item arrive. In 4(b) could be seen that positions of items A, B and F are conserved when G arrives. If this were not the case, the algorithm should recalculate the layout for all the four items instead of only for G. However, in figure 4(a), despite this algorithm were progressive or not, B has to be re-laid out due to a bad ordering.
However, dependencies rely on further processing. Some indication of what processing will be performed over data items is needed to correctly group items by locality. This implies that there should be coordination between the sender and the receiver stages on the order in which items will be transferred. Traditionally, sender stages own the control flow of information in visualization streamed pipelines. Each stage generates output and next stages process it as a reflex mechanism when their inputs are ready. In this scheme, that we call push pipeline, the control logic relies on sender stages and it is necessary for these stages to know the ordering restrictions of further stages in order to send the data accordingly. Otherwise, the opposite scheme called pull pipeline can be adopted. In this case, each stage requests for needed items to previous stages. The control logic relies on receiver stages and the problem with this approach is that knowledge about information that has not arrived yet to the stage is needed in order to build the request. Intermediate solutions can be applied in which the control is delegated to other components that act as mediators. In either case, some agreeing mechanism to match constraints among stages is always required.
based on density values to suppress inner tissue, and the second does some interpolation among contiguous voxels. Clearly, the first stage should know that second stage operates with contiguous voxels in order to use some traversal mechanism that enforces the transference of neighbor voxels together. Also, the second stage should know how many neighbors have each voxel in order to begin the processing as soon as all the neighbors arrive and, after that, release completely the processed voxels. This exchange of information between adjacent stages becomes a major issue in designing modular streamed visualization networks.
Figure 5: Streaming coordination among stages in the presence of dependencies. Against the main data stream, there is a backflow for coordinating ordering issues. The major drawback with this approach is that each stage must be aware of their neighbor stages. For example, stage y must be designed to be after stage x. This kind of issues limits the design modularization.
A way to mitigate the impact of streaming in pipeline modularization is building each stage over an abstraction layer. This layer should provide a standard interface to recover and transfer data items and should hide communication and streaming details to the processing stages (figure 6). However, this is not an easy task. Although each stage recovers its independence from others, it needs to communicate their constraints to the abstraction layer in some way. This requires that processing constraints be explicitly represented in the interface between each stage and the abstraction layer. With these constraints, the abstraction layer could enforce a correct data items distribution. Unfortunately, design and implement a model for constraints (i.e. data dependencies) is not a trivial task. Representing data dependencies in the interface is the price that has to be paid to get back the modularization in visualization design.
[image:8.595.68.533.565.732.2]6 PROGRESSIVE ALGORITHMS
Progressive algorithms are those who can operate in little steps. In each execution step some portion of the overall calculation is performed. When they finish, the whole work is done. This feature makes them suitable for being used in streaming. As was stated before, the key issue in streaming is to avoid the complete reconstruction of datasets for processing data. Thus, this kind of algorithms becomes essential to work with the data flow on the fly, without unnecessary dataset reconstructions. Their ability of continue their work while items arrive and without restart the whole process is their main advantage.
In visualization, we can identify two main applications of such algorithms. One is item processing in middle of the dataflow. Items arrive, are processed and, as soon as possible, are transferred to the next stages. In this case, the key issue is to keep a constant flow of items through the pipeline avoiding unnecessary accumulation of data. For this kind of application, algorithms that can work with little portions of the dataset are required. For example, attribute value based filtering algorithms belong to this category. For each item, its attribute value is analyzed and a decision is taken. The algorithm can perform its job getting one item at a time without additional storage.
The other application for progressive algorithms is item processing at the end of the dataflow (see visual representation discussion in figure 4) or when intermediate results must be generated. In this case, the functionality varies because these algorithms act collecting data items to compose them in an intermediate result or a final representation. The key issue is resuming the process each time a new item arrive without repeat any calculation previously done. This application of progressive algorithms represents a dataflow endpoint, i.e. the finalization of a stream. This could be either an intermediate dataset after whom the process continue in other stream or the end of the whole visualization pipeline.
Some algorithms have not constraints about their input. They simply receive data items in arbitrary order. In this context, we call them free algorithms. Force directed graph layouts, for example, only adds new nodes to the force system and re-executes the simulation. The order in which nodes arrives is negligible. Other algorithms impose restrictions over their input. We call them
constrained algorithms. For example, multi-resolution algorithms receive a low detailed
representation first to perform an approximated render well suited for overview purposes. After that, more and more details are received and the visual representation progressively gains resolution. In these cases, there are constraints in the order in which level of details are received. Free algorithms are easier to design and implement because they are insensitive to dependencies. In contrast, constrained algorithms present many more difficulties in their application.
7 DISTRIBUTION AND THE INTERACTION LOOPBACK
In previous sections we discuss the aspects involved in streamed visualization pipelines but we only have considered the transformation of the data in visual entities. However, visualization is an inherently interactive process. Once the first visual representation is shown, user can interact with visualization by triggering processes that re-execute several parts of the visualization execution network. This feedback involves many implications from the streaming viewpoint.
[image:10.595.58.539.360.551.2]Due to visualization interaction, some data items are usually updated. For example, a selection of elements may change in response to user requests and, thus, the visual mapping for these elements could be modified in order to provide selection feedback to user. The problem is that there is not a centralized dataset in which apply such modifications. Items are spread over the whole execution network and a minor change of some item attribute could involve the reinsertion of such item in the data flow to be reprocessed. If this item were linked to others in order to solve data dependencies, the others also should be reinserted. Something similar occurs in figure 7 where the re-calculation of a value produces the reinsertion of related items. Updates that are solved without troubles in a standard visualization pipeline, becomes really hard problems in streamed pipelines due to these issues.
Figure 7: Interactions on streamed visualization. User modifies the calculation of D in stage X by some kind of interaction. As a result, a new value D’ is obtained and propagated toward the end of the pipeline. However, because streaming, items A and B needed for D’ calculation could not be present in X. Then, the interaction must re-insert these items into the incoming stream of X. This reinsertion is originated by the dependency between A, B and D’.
8 RELATED WORK
Streaming in visualization is increasingly used as a natural response to an ever rising size in datasets scales. Due to the inability of dealing with huge in-memory datasets, the processing of non-completely accessible data arises as a need. However, nowadays we only have ad-hoc streamed implementations. They cover particular cases and often deal with highly parallelizable data (i.e. data with little dependencies or without dependencies at all). In particular, two main areas are being addressed: point based data processing and polygonal meshes processing. Little work has been done with streaming in information visualization or graph visualization where datasets have higher linking rates.
Point based data related work includes stream based point processing frameworks such as in [6] and surface reconstruction schemes like the approach presented in [3] which start from scanned points and uses a multi-level streaming representation. Additionally, some work in progressive point processing algorithms has been performed. In [8] a view-dependent progressive transmission scheme is presented for splat volume rendering. In [7] a similar result is examined and two concrete application cases are given: the progressive visualization of a scattered data set and a real time visualization of dynamic streaming sensor data.
Geometric and topological mesh processing applications also have been moving to streaming with novel mesh transmission techniques and new simplification and remeshing algorithms. In [4] and [5] streaming representation formats for meshes and conversion algorithms to these formats are presented. A progressive remeshing algorithm is proposed in [1] and a streamed simplification method for unstructured tetrahedral meshes is presented in [9].
In our knowledge, only non interactive streaming in visualization is well addressed. Streaming is covered as a way to deal with large data chunks of processing and not as a general resource optimization method. Interactions in visualization are also not well covered yet, mainly because when the user feedback loop is introduced, many problems arise.
Streaming in visualization is just emerging as a set of isolated applications. However, in all the previously mentioned work, some kind of data rearranging, local processing or progressive computation is always present. The existence of these concepts in specific but very different scenarios validates them as general elements involved in the application of streaming in visualization. This is a first and necessary step toward the application of streaming in a more generalized fashion. Consequently, we think that introducing streaming as a general approach is a very promising improvement in the development of visualization systems.
9 CONCLUSIONS AND FUTURE WORK
data streams in either intermediate results or final representations. Finally, distributed visualization topics, data replication aspects and interaction support issues were presented.
Like every new research topic, streaming in visualization is evolving from ad-hoc approaches to more general techniques. In this work, we have advanced with minor ad-hoc implementations. However, these initial efforts allowed us to get some of the interesting results presented here. Thus far the results are very encouraging and we definitely will proceed along this way and develop streaming in a more generalized way. We are interested in the inclusion of the abstraction layer discussed in section 5 as a general framework for streaming visualizations.
We believe that streaming stands as a valid alternative to process huge amounts of data without completely load them in memory. There is a tendency toward streaming in many areas. However, if streaming either has limited applicability in visualization (i.e. there is some case when streaming application is not possible) or can be applied in every application is a question that remains open.
REFERENCES
[1] Ahn M., Guskov I., and Lee S. Out-of-Core Remeshing of Large Polygonal Meshes. IEEE Transactions on Visualization and Computer Graphics, September/October 2006 (Vol. 12, No. 5), pages 1221-1228.
[2] Ahrens J., Brislawn K., Martin K., Geveci B. Law C., and Papka M. Large-scale data visualization using parallel data streaming. Computer Graphics and Applications, IEEE -
Jul/Aug 2001 - Volume: 21, Issue: 4 - Pages: 34-41.
[3] Bolitho M., Kazhdan M., Burns R. and Hoppe H. Multilevel Streaming for Out-of-Core Surface Reconstruction. Eurographics Symposium on Geometry Processing (2007) - Alexander Belyaev, Michael Garland (Editors).
[4] Hoppe H. Progressive meshes. In SIGGRAPH ’96: Proceedings of the 23rd Annual Conference
on Computer Graphics and Interactive Techniques, pages 99–108, New York, NY, USA, 1996.
ACM Press.
[5] Isenburg, M. and Lindstrom P. Streaming Meshes. IEEE Visualization 2005 Proceedings. Pages 231-238.
[6] Pajarola R. Stream Processing Points. IEEE Visualization 2005 Proceedings. Pages 239-246.
[7] Park S., Linsen L., Kreylos O., Owens J., and Hamann B. A framework for real-time volume visualization of streaming scattered data. In Proceedings of Tenth International Fall Workshop
on Vision, Modeling, and Visualization 2005 (2005) Pages 225-232. Stamminger M., Hornegger
J., (Eds.), DFG Collaborative Research Center.
[8] Rusinkiewicz S. and Levoy M. Symposium on Interactive 3D Graphics - Proceedings of the
2001 symposium on Interactive 3D graphics - Pages: 63 – 68. 2001.
[9] Vo H., Callahan S., Lindstrom P., Pascucci V., and Silva C. Streaming Simplification of Tetrahedral Meshes. IEEE Transactions on Visualization and Computer Graphics,