Rapid separation of tetracycline derivatives and their main degradation products by capillary zone electrophoresis
7
0
0
Texto completo
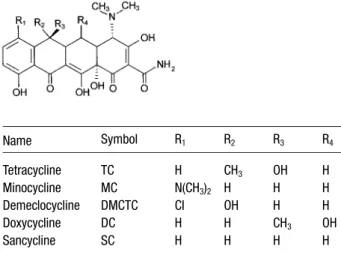
(2) 2776. C. García-Ruiz et al.. achieved using phosphate buffer at pH 7.5 because under these conditions three of them (MC, DC, and TC) were practically overlapped [7]. Also, the separation of DMCTC from MC or DC has only been performed using basic pH values with analysis times higher than 14 min [12–14]. On the other hand, some of the TCs have not been separated still from their degradation products. As an example, no reports have been found on the separation of sancycline (SC) from other TC derivatives or from its degradation products. In this work, the rapid separation of five TCs (TC, MC, DMCTC, DC, and SC) and of each of these TCs and its main degradation product by CZE is presented. The influence of the pH, concentration and nature of the background electrolyte (BGE), and the presence of EDTA on the separations have been investigated. After optimization of the separation conditions, the analytical characteristics of the method have been investigated and a study of the stability of the five TCs has been performed.. Electrophoresis 2001, 22, 2775–2781 of the five TC antibiotics employed (DC, MC, and TC) were supplied by Sigma (St. Louis, MO, USA); DMCTC was from Fluka (Buchs, Switzerland), and SC was supplied by Hovione Sociedade Quimica (Lisbon, Portugal). Figure 1 shows the basic structure of these compounds. Three pharmaceutical preparations were analyzed in this work: MC in capsules, which contain MC (100 mg) with corn starch and magnesium stearate as excipients; DC in capsules, which contain DC with lactose, magnesium stearate, sodium lauryl sulfate, corn starch and alginic acid as excipients; DC in suspension, which contains DC with saccharin sodium, sodium hydroxide, calcium chloride, antifoam AF, apeline, eritrosine, carmine solution, sodium metabisulfite, butylparaben, propylparaben, polyvinyl pyrrolidone, veegum K, 70% sorbitol, glycerin, aroma of raspberry, and water. The three pharmaceutical preparations were acquired in chemists in Madrid (Spain).. 2 Materials and methods 2.1 Apparatus An HP3D CE system (Hewlett-Packard, Waldbronn, Germany) equipped with an on-column diode array detector and an HP 3D-CE Chemstation software was used. Separations were performed on fused-silica capillaries of 50 mm ID and 375 mm OD, purchased from Composite Metal Services (Worcester, England). Capillaries had a total length of 33.5 cm and 25 cm to the detector. Capillary temperature was adjusted to 257C. Finally, detection was performed at 265 nm. Electrolytic solutions were degassed in an ultrasonic bath KM from Raypa (Barcelona, Spain). A model 654 pH-meter from Metrohm (Herisau, Switzerland) was employed to adjust the pH of the BGEs.. 2.2 Reagents and samples All reagents employed were of analytical grade. Sodium dihydrogen phosphate dihydrate, trisodium phosphate dodecahydrate, dimethyl sulfoxide (DMSO), sodium hydroxide (NaOH) and hydrochloric acid (HCI) were supplied from Merck (Darmstadt, Germany); disodium hydrogen phosphate dodecahydrate and EDTA disodium salt dihydrate were from Panreac (Barcelona, Spain); formic acid was obtained from Riedel-de Haën (Seelze, Germany); acetonitrile was from Lab Scan (Dublin, Ireland); water used to prepare solutions was purified through a Milli-Q system from Millipore (Bedford, MA, USA). Three. Name. Symbol. R1. R2. R3. R4. Tetracycline Minocycline Demeclocycline Doxycycline Sancycline. TC MC DMCTC DC SC. H N(CH3)2 CI H H. CH3 H OH H H. OH H H CH3 H. H H H OH H. Figure 1. Chemical structures of the TC derivatives studied.. 2.3 Procedure Solutions of 200 mM formic acid or 100 mM phosphate buffer were prepared either by adding appropriate aliquots of concentrated formic acid or by dissolving the appropriate amount of phosphate salt into water. The different pHs for 100 mM phosphate buffers were adjusted as required by adding aliquots of 100 mM phosphoric acid solution. The concentrations 25, 50, and 75 mM, in phosphate buffer were obtained by diluting the 100 mM solution with water. The pH desired for the diluted solutions was adjusted with 1 M or 1 M NaOH. All electrolyte solutions were filtered prior use through 0.45 mm pore size disposable nylon filters from Scientific Resources (Eatontown, NJ, USA). Standard solutions were prepared by dissolving each TC antibiotic in DMSO.
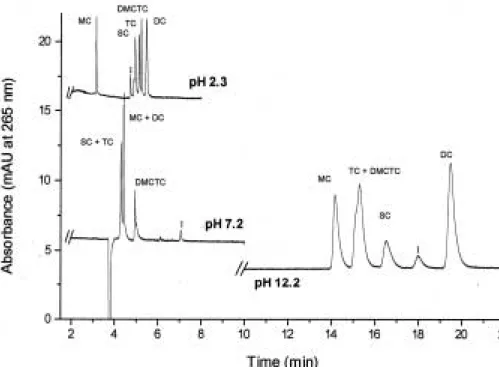
(3) Electrophoresis 2001, 22, 2775–2781. CZE of tetracycline derivatives. 2777. Figure 2. Separation of a mixture of the five TCs studied at acid, neutral, and basic pHs. BGE, 100 mM phosphate buffer; injection by pressure, 30 mbar for 2 s of sample followed by 30 mbar for 2 s of BGE; capillary, 33.5 cm (25 cm to the detector)650 mm ID; temperature, 257C; applied voltage, 15 kV; current intensity, * 40 mA; UV detection, at 265 nm. I, impurity.. to achieve the desired concentration. In order to obtain the degradation products of these compounds a solution of 0.1% phosphoric acid with acetonitrile (50:50, apparent pH 2.6) was employed. The solid products were dissolved in this solution and sonicated for 6 h before the analysis of the diluted solutions in water. Sample solutions for MC and DC were prepared dissolving in 10 mL of DMSO the total content of one capsule. These solutions (10 000 mg/mL) and the suspension of DC (50 mg/ 5 mL = 10 000 mg/mL) were diluted in DMSO in order to obtain a final concentration of 50 mg/mL. These solutions were analyzed by the CZE method. Before first use, a new capillary was rinsed with 1 M NaOH for 30 min, 0.1 M HCI for 5 min followed by 30-min rinse with BGE. Between consecutive injections the capillary was only conditioned with the BGE for 4 min, but when the pH or the nature of the BGE was changed, before first injection a conditioning for 30 min with the new BGE was made. This conditioning method was used to obtain reproducible migration times. Injections were made by pressure: 30 mbar for 2 s of sample followed by 30 mbar for 2 s of BGE to improve the shape of the peaks.. 3 Results and discussion 3.1 Method development The separation of TC antibiotics can be highly influenced by the pH of the medium due to the fact that these substances are amphoteric compounds with isoelectric points ranging between 4 and 6. In a preliminary study,. we investigated the effect of pH using 100 mM phosphate buffer (acid, neutral, and basic pHs corresponding to the pKa’s of the phosphoric acid, pH 2.3, 7.2, and 12.2). As shown in Fig. 2, the separation of a mixture of the five TCs was only possible at acid pH for which the best efficiency and the shortest analysis time were obtained. At pH 2.3 four concentrations of phosphate buffer were then considered (25, 50, 75, and 100 mM). A 25 mM phosphate buffer gave the lowest values of migration times and current intensity (~ 40 mA) without a significant loss in the resolution among the five TCs studied due to the small selectivity changes obtained when the concentration of BGE was increased. Therefore, a 25 mM phosphate buffer was selected. On the other hand, results showed that only with a 25 mM phosphate buffer a resolution higher than 1.5 (baseline resolution) was obtained for each TC derivative and its respective degradation product (the resolution between MC and its degradation product decreased when increasing the buffer concentration). In order to improve the resolutions obtained, the influence of the nature of the BGE on the separation was investigated. Formic acid and phosphate buffer without or with EDTA were compared. Results showed that resolutions increased when 25 mM phosphate buffer (pH 2.3) instead of 200 mM formic acid (pH 2.2) was used. Moreover, the addition of 1 mM EDTA to 25 mM phosphate buffer enabled an improvement in the resolutions corresponding to the separation of TC and DMCTC and of each TC derivative and its respective degradation product..
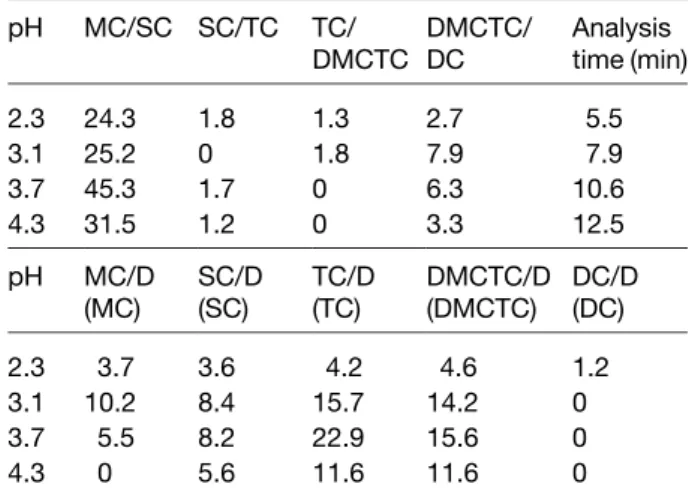
(4) 2778. C. García-Ruiz et al.. Electrophoresis 2001, 22, 2775–2781. Finally, a more exhaustive study on the influence of the pH (ranging from 2.3 to 5.3) was achieved when using 25 mM phosphate buffer with 1 mM EDTA. Table 1 shows the resolutions obtained for the separation of the five TCs studied at different acid pHs (from 2.3 to 4.3). It can be observed that only at pH 2.3 it was possible to obtain a baseline resolution of the five TCs whereas at pH 3.1, 3.7, or 4.3 only four of them were separated. On the other hand, at pH 5.3 no peaks were detected for tetracyclines because of their comigration with the electroosmotic flow (i.e., with the peak of DMSO, which was the sample solvent). In addition, the analysis time increased when increasing pH values. Table 1 also shows that only at pH 2.3 it was possible to perform the separation of each TC derivative and its respective degradation product, while at pH 3.1 and 3.7 no resolution was observed for DC and its degradation product, and at pH 4.3 neither DC nor MC were resolved from their respective degradation products.. Figure 3. CZE of a mixture of five TCs. BGE, 25 mM phosphate buffer (pH 2.3) with 1 mM EDTA. Other conditions as in Fig. 2.. Table 1. Resolution obtained at different acid pHs for each two consecutive TCs in a mixture of the five studied and for each TC derivative and its main degradation product pH. MC/SC SC/TC. TC/ DMCTC/ DMCTC DC. Analysis time (min). 2.3 3.1 3.7 4.3. 24.3 25.2 45.3 31.5. 1.8 0 1.7 1.2. 1.3 1.8 0 0. 2.7 7.9 6.3 3.3. 5.5 7.9 10.6 12.5. pH. MC/D (MC). SC/D (SC). TC/D (TC). DMCTC/D DC/D (DMCTC) (DC). 2.3 3.1 3.7 4.3. 3.7 10.2 5.5 0. 3.6 8.4 8.2 5.6. 4.2 15.7 22.9 11.6. 4.6 14.2 15.6 11.6. 1.2 0 0 0. BGE, 25 mM phosphate buffer-1 mM in EDTA. Experimental conditions: injection by pressure, 30 mbar for 2 s of sample followed by 30 mbar for 2 s of BGE; capillary, 33.5 cm (25 cm to the detector)650 mm ID; temperature, 257C; applied voltage, 15 kV; current intensity, 40 mA; UV detection, at 265 nm.. In conclusion, the study performed enabled to select 25 mM phosphate buffer (pH 2.3) with 1 mM EDTA as the most appropriate conditions for the rapid separation of TC derivatives studied and their degradation products. Under these selected conditions, the electropherogram of a mixture of the five TCs studied in this work has been obtained (Fig. 3). On the other hand, Fig. 4 shows the electropherograms obtained for the five TC derivatives. Figure 4. Separation of each TC derivative and its main degradation product by CZE. Experimental conditions as in Fig. 3..
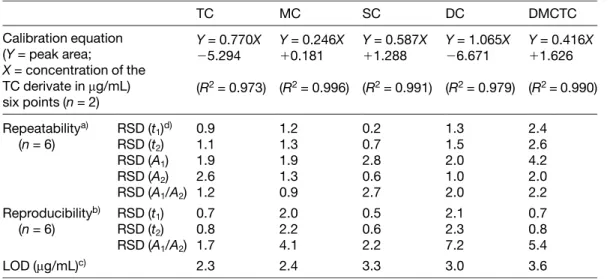
(5) Electrophoresis 2001, 22, 2775–2781. CZE of tetracycline derivatives. 2779. Table 2. Analytic characteristics of the CZE method TC. MC. SC. DC. DMCTC. Calibration equation (Y = peak area; X = concentration of the TC derivate in mg/mL) six points (n = 2). Y = 0.770X 25.294. Y = 0.246X 10.181. Y = 0.587X 11.288. Y = 1.065X 26.671. Y = 0.416X 11.626. Repeatabilitya) (n = 6). RSD (t1)d) RSD (t2) RSD (A1) RSD (A2) RSD (A1/A2). 0.9 1.1 1.9 2.6 1.2. 1.2 1.3 1.9 1.3 0.9. 0.2 0.7 2.8 0.6 2.7. 1.3 1.5 2.0 1.0 2.0. 2.4 2.6 4.2 2.0 2.2. Reproducibilityb) (n = 6). 0.7 RSD (t1) 0.8 RSD (t2) RSD (A1/A2) 1.7. 2.0 2.2 4.1. 0.5 0.6 2.2. 2.1 2.3 7.2. 0.7 0.8 5.4. 2.3. 2.4. 3.3. 3.0. 3.6. LOD (mg/mL)c). (R2 = 0.973) (R2 = 0.996) (R2 = 0.991) (R2 = 0.979) (R2 = 0.990). a) Measured from six consecutive injections of a solution of the same degraded TC derivative b) Measured from two consecutive injections with three different capillaries c) Calculated from the peak height based on a signal-to-noise ratio of 3 t1, migration time corresponding to the degradation product of the TC derivative, t2, migration time corresponding to the TC derivative, A1, peak area corresponding to the degradation product of the TC derivative, A2, peak area corresponding to the TC derivative, BGE, 25 mM phosphate buffer (pH 2.3)-1 mM EDTA, other experimental conditions as in Table 1. d) in %. and their respective degradation products when the above-mentioned conditions were used. It can be observed that all TCs studied show a main degradation product, their epimeres. In order to show if the TC derivatives were stable during the time of the analysis, the percentage of degradation of each TC derivative studied, when dissolved in the 25 mM phosphate buffer at pH 2.3, was measured. Degradations lower than 3% were obtained after 60 min in phosphate buffer, therefore, the degradation of the TCs during the analysis by CZE (less than 6 min) is not significant.. 3.2 Analytical characteristics of the method After the development of the method for the rapid analysis of TCs, its analytical characteristics were examined, the results are shown in Table 2. The parameters involved were linearity, precision (repeatability and reproducibility), and limit of detection (LOD). The linearity study showed that linear relationships with good correlations in all cases (R2 4 0.99) were obtained for the variation of the peak area or peak height as a function of the concentration of TC derivative (working range from 10 to 100 mg/mL), using at least six standard solutions (each solution was injected twice). The precision of the CZE method described was measured as repeatability and reproducibility. Precision is. one of the most important criteria for evaluating the analytical method performance, and its numerical value is the relative standard deviation (RSD). The repeatability in the migration time, peak area, and ratio between the peak area of the degradation product generated and the peak area of the TC derivative (value proportional to % degradation) was determined as the RSD obtained for six consecutive injections of the degraded TC derivatives. Table 2 shows that acceptable levels of precision were obtained for the developed method in terms of repeatability (RSDn = 6 from 0.2 to 2.6% for migration times, from 0.6 to 4.2% for peak area, and from 0.9 to 2.7% for the ratio between peak areas), since in all cases RSDs calculated were lower than 5%. The reproducibility of the method was measured as the RSD obtained for two consecutive injections with three different capillaries (n = 6). Acceptable RSD values were obtained for migration times (RSD < 2.5%), while only for DC a value of RSD 5 2.5%), while only for DC a value of RSD & 7% was obtained for the ratio between peak areas (Table 2). Finally, an evaluation of the sensitivity was made by determining the values of the LOD calculated from the peak height based on a signal-to-noise ratio of 3. The noise was estimated as the largest deviation of detector signal from baseline measured in a section of about 5 min in the absence of analyte (1610–4 AU). LODs for the five TC derivatives ranged from 2.3 to 3.6 mg/mL (Table 2)..
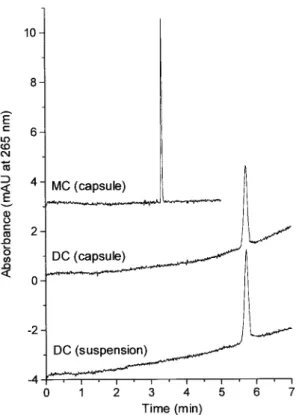
(6) 2780. C. García-Ruiz et al.. Electrophoresis 2001, 22, 2775–2781. 3.3 Application of the CZE method to study the stability of TCs and for the analysis of TC derivatives in pharmaceutical preparations First, a stability study was performed measuring the degradation of the TCs dissolved in DMSO as an illustration of the applicability of the optimized CZE method for the analysis of TCs. The percentage of degradation of each TC derivative was calculated from the ratio between the peak area of the degradation product generated and the total peak area (the addition of the areas of the peaks of the TC derivative undegraded and its degradation product). The percentages of degradation obtained for TC, DMCTC, and SC were 3.6, 3.9, and 3.4%, respectively, when the solution was freshly prepared whereas for MC and DC peaks due to degradation products were not observed in these conditions. However, the degradation of these products was relatively fast (from 6.2% for DC to 12.4% for MC in 26 h). Finally, the percentages of degradation after five days were: 29.2% for TC, 29.0% for DMCTC, 17.5% for MC, 9.4% for SC, and 6.1% for DC. From these results it can be observed that only DC was quite stable after five days. Second, the CZE method developed was applied to the analysis of MC and DC in three pharmaceutical preparations. Table 3 shows the content of these TC derivatives found by CZE in the three pharmaceutical preparations studied (two capsules and one suspension). The best results were obtained for the suspension of DC. The worst results were obtained for the capsules of DC and MC probably due to the difficulty in recovering the sample from the capsule. Good precision measured as RSD (%) was achieved for the measured concentrations (RSD values from 0.49% to 1.85%). Finally, Fig. 5 shows the electropherograms obtained for the three pharmaceutical preparations using the CZE method developed in this work. It can be emphasized that any interferent peak was observed.. Table 3. Content of two TC derivatives found by CZE in three pharmaceutical preparations Sample. Clabela). CCEb) (RSD, %). DC (suspension) DC (capsule) MC (capsule). 10 mg/mL 100 mg 100 mg. 9.74 (0.49) mg/mL 95.28 (1.85) mg 91.32 (0.89) mg. a) Clabel, concentration of the TC derivative specified on the label of the pharmaceutical preparation b) CCE, averaged concentration (n = 5) if the TC derivative content determined by the CZE method. Figure 5. Analysis of MC and DC in three pharmaceutical preparations by CZE. Experimental conditions as in Fig. 3.. 4 Concluding remarks An analytical method has been developed to separate by CZE five TC derivatives (TC, MC, DMCTC, DC, and SC). A study on the influence of the pH, concentration and nature of the BGE, and the use of additives enabled to select 25 mM phosphate buffer (pH 2.3) with 1 mM EDTA in order to achieve two objectives: (i) the separation of a mixture of the five TC derivatives, and (ii) the separation of each TC derivative from its main degradation product (epimere). In both cases, the separations were performed in less than 6 min. The CZE method was evaluated by means of its linearity, precision (repeatability and reproducibility), and LODs. Good linearity was obtained for all the derivatives studied (working range from 10 to 100 mg/mL, R2 4 0.99). The repeatability of migration times and peak areas measured as RSD was lower than 5%. The reproducibility of migration times and peak areas ratio between the epimere and the TC derivative using different capillaries was acceptable. LODs were about 3 mg/mL for the five TCs studied. Two applications of the CZE method were performed. A stability study of these compounds dissolved in DMSO was performed to check the reliability of the method employed. The results obtained enabled to conclude that when the solutions of these compounds are freshly pre-.
(7) Electrophoresis 2001, 22, 2775–2781 pared, the method can be employed due to the short analysis time required for the analysis. In addition, the developed method was applied to the analysis of two of the TC derivatives studied (DC and MC) in pharmaceutical preparations. The authors thank GlaxoWellcome Research and Development (Madrid, Spain) for the kind gift of sancycline employed in this work. The authors further thank Mrs. A. Álvarez from GlaxoWellcome for its colaboration in the process of epimerization. Received January 11, 2001. 5 References [1] Lambert, H. P., O’ Grady, F. W., Antibiotic and Chemotherapy, Churchill Livingstone, London 1992. [2] Mitscher, L. A., The Chemistry of the TC Antibiotics; Medicinal Research Series, Vol. 9, Marcel Dekker, New York 1978. [3] Mack, G. D., Ashworth, R. B., J. Chromatogr. Sci. 1978, 16, 93–101. [4] Hermansson, J., Andersson, M., J. Pharm. Sci. 1982, 79, 222–229. [5] Zhang, C. X., Sun, Z. P., Ling, D. K., Zhang, Y. J., J. Chromatogr. 1992, 627, 281–286. [6] Pesek, J. J., Matyska, M. T., J. Chromatogr. A 1996, 736, 313– 320.. CZE of tetracycline derivatives. 2781. [7] Tavares, M. F. M., McGuffin, V. L., J. Chromatogr. A 1994, 686, 129–142. [8] Van Schepdael, A., Saevels, J., Lepoundre, X., Kibaya, R., Gang, N. Z., Roets, E., Hoogmartens, J., J. High Resol. Chromatogr. 1995, 18, 695–698. [9] Van Schepdael, A., Kibaya, R., Roets, E., Hoogmartens, J., Chromatographia 1995, 41, 367–369. [10] Van Schepdael, A., Van den Bergh, I., Roets, E., Hoogmartens, J., J. Chromatogr. A 1996, 730, 305–311. [11] Li, Y. M., Van Schepdael, A., Roets, E., Hoogmartens, J., J. Liq. Chromatogr. Rel. Technol. 1997, 20, 273–282. [12] Li, Y. M., Van Schepdael, A., Roets, E., Hoogmartens, J., J. Pharm. Biomed. Anal. 1997, 15, 1063–1069. [13] Li, Y. M., Van Schepdael, A., Roets, E., Hoogmartens, J., J. Chromatogr. A 1996, 740, 119–123. [14] Li, Y. M., Van Schepdael, A., Roets, E., Hoogmartens, J., J. Pharm. Biomed. Anal. 1996, 14, 1095–1099. [15] Li, Y. M., Moons, H., Van Schepdael, A., Roets, E., Hoogmartens, J., Chromatographia 1998, 48, 576–580. [16] Croubels, S., Baeyens, W., Dewaele, C., Van Peteghem, C., J. Chromatogr. A 1994, 673, 267–274. [17] Chen, C. L., Gu, X., J. AOAC Int. 1995, 78, 1369–1377. [18] Tørnelund, J., Hansen, S. H., J. Chromatogr. A 1996, 737, 291– 300. [19] Bjørnsdottir, I., Tjørnelund, J., Hansen, S. H., J. Capil. Electrophor. 1996, 3, 83–87. [20] Tjørnelund, J., Hansen, S. H., J. Chromatogr. A 1997, 779, 235–243. [21] Tjørnelund, J., Hansen, S. H., J. Pharm. Biomed. Anal. 1997, 15, 1077–1082. [22] Pesek, J. J., Matyska, M. T., J. Capil. Electrophor. 1997, 4, 213–217..
(8)
Figure
+2
Documento similar