Nat. Hazards Earth Syst. Sci., 8, 1001–1007, 2008 www.nat-hazards-earth-syst-sci.net/8/1001/2008/ © Author(s) 2008. This work is distributed under the Creative Commons Attribution 3.0 License.
Natural Hazards
and Earth
System Sciences
Statistical features of seismoelectric signals prior to M7.4
Guerrero-Oaxaca earthquake (M´exico)
A. Ram´ırez-Rojas1, E. L. Flores-M´arquez2, L. Guzm´an-Vargas3, G. G´alvez-Coyt4, L. Telesca5, and F. Angulo-Brown6 1Area de F´ısica de Procesos Irreversibles, Universidad Aut´onoma Metropolitana Azcapotzalco, Avenida San Pablo 180´ Colonia Reynosa, Azcapotzalco, 02200, M´exico D. F., M´exico
2Inst. de Geof´ısica, UNAM, Circuito Exterior S/N, Cd. Universitaria, 04510 M´exico D. F., M´exico 3Unidad Profesional Interdisciplinaria en Ingenier´ıa y Tecnolog´ıas Avanzadas, Inst. Polit´ecnico Nacional, 07738, M´exico D. F., M´exico
4Dep. de Matem´aticas, Unidad Profesional Interdisciplinaria de Biotecnolog´ıa del Inst. Polit´ecnico Nacional, Av. Acueducto S/N, Col. Barrio La Laguna Ticom´an, C. P. 07340, M´exico D. F., M´exico
5Inst. di Metodologie per l’Analisi Ambientale, Consiglio Nazionale delle Ricerche, C. da S. Loja, 85050 Tito (PZ), Italy 6Dep. de F´ısica, Escuela Superior de F´ısica y Matem´aticas, Inst. Polit´ecnico Nacional, Edif. 9, U. P. Zacatenco,
07738, M´exico D. F., M´exico
Received: 9 July 2008 – Revised: 20 August 2008 – Accepted: 25 August 2008 – Published: 12 September 2008
Abstract. In this paper a statistical analysis of seismoelectric ULF signals prior to the M7.4 Guerrero-Oaxaca earthquake (EQ) occurred at the Mexican Pacific coast on 14 September 1995, has been performed. The signals were simultaneously recorded at three monitoring stations from the last months of 1994 until July of 1996. The nonlinear time series methods of Higuchi fractal dimension (HFD) and detrended fluctua-tion analysis (DFA) have been used. In the three data sets we found some complex dynamical behaviors that seemingly re-flect a relaxation-EQ preparation-main shock-relaxation pro-cess. In particular, clear spike-like anomalies in both DFA-and HFD-exponents some months before the main shock are revealed.
1 Introduction
The comprehensive study of the final rupture of a hetero-geneous material has shown that some physical phenomena as ULF electromagnetic and acoustic emissions take place along with this process (Hayakawa, 2001; Hayakawa et al., 2004). This is the case of the crust fracture mechanism accompanying earthquake (EQ) occurrences. Many studies have been focused on fractal and multifractal properties of geolectric signals in order to reveal possible electromagnetic precursors of EQ with significant magnitude (Varotsos et al.,
Correspondence to: A. Ram´ırez-Rojas
Fig. 1
Fig. 1. Location of the three monitoring stations and the epicenter
of the Ms=7.4 EQ (star).
spectrum showed a crossover behavior, with a low frequency range of the signals (0.002 Hz–0.01 Hz) characterized by a white noise behavior, while high frequencies (0.01 Hz– 0.25 Hz) exhibited a complex correlated behavior. Similar re-sults were observed for the correlation times (Ramirez-Rojas et al., 2004) of the same data. In the present paper, we ana-lyze the Acapulco, Coyuca and Omepetec geoelectrical data by using two different methods: the Detrended Fluctuation Analysis (DFA) and the Higuchi’s fractal dimension (HFD). Our results from the three stations reveal important changes in the fractal organization probably related to the aforemen-tioned EQ. The paper is organized as follows: in Sect. 2 a brief description of DFA and HFD is given; in Sect. 3 the data set is described. The results and their discussion are presented in Sect. 4; in Sect. 5 the concluding remarks are given.
2 Methods: Detrended Fluctuation Analysis and Higuchi’s fractal dimension.
The Detrended Fluctuation Analysis (DFA) method intro-duced by Peng et al. (1994, 1995) has been used to detect long-term correlations in nonstationary time series. The orig-inal time series is first integrated. Next, the integrated time series is divided into boxes of equal length,n. For each box, a linear regression fit (representing the trend in that box) is performed. Theycoordinate of the fitting line is denoted by yn(k).
Next, the integrated time series,y(k), is detrended by sub-tracting the local trend,yn(k). The root-mean-square
fluctua-tion of this integrated and detrended time series is calculated by
F (n)∼n (1)
Under such conditions, the fluctuations can be character-ized by the scaling exponent. The value of the scaling ex-ponent characterizes the correlation in the time series. For example, white noise is characterized by α=0.5. Another two special cases are:α=1 corresponding to long-term corre-lated noise (1/f noise) andα=1.5, a Brownian noise. When the scaling exponent is within the interval 0.5<α<1, indi-cates persistent long-range power-law correlations. In con-trast, 0<α<0.5 indicates a different type of power-law cor-relation such that large and small values of the time series are more likely to alternate. Our calculations were performed with windows of 3-h (2700 data points for Coyuca and Ome-tepec and 5400 data points for Acapulco).
The Higuchi’s method (1988) was proposed to estimate the fractal dimension of nonstationary time series. One of the advantages of the Higuchi’s fractal dimension (HFD) is that it gives stable indices even for a small number of data. Higuchi (1988, 1990) considers a finite set of time series of length N, taken at a regular interval: x(1), x(2), x(3), . . . ,
x(N). From the original time series, a new time series,xmk is obtained and defined as follows:
xmk :xm, x(m+k), x(m+2k), ..., x
m+
N−k
k
k
wherem=1, 2, ..., k, and [ ] denotes the Gauss’s notation. Heremandk are integers that indicate the initial time and the time interval respectively. For a time interval equal tok, one getsksets of new time series. Higuchi defines (1988) the length of the curve associated to each time seriesxkmas follows:
Lkm= [N−k
k ] X
i=1
[x(m+ik)−x(m+(i−1)k)] N−1 [N−k
k ]k !
1 k
where the term N−1 [N−k
k ]k
is a normalization factor. The length of the curve for the time intervalk is taken as the average value<L(k)> over k sets of Lm(k). If the average value
obeys the scaling law:
<L(k)>∼k−D (2)
A. Ram´ırez-Rojas: Statistical features prior to M7.4 Guerrero-Oaxaca EQ 1003
[image:3.595.131.467.62.202.2]Fig. 2
Fig. 2. Time evolution of DFA-exponents (α1 andα2) for NS and EW Acapulco data. The monitoring period is from June 1994 to July 1996. The EQ is marked with a vertical green line.
Fig. 3
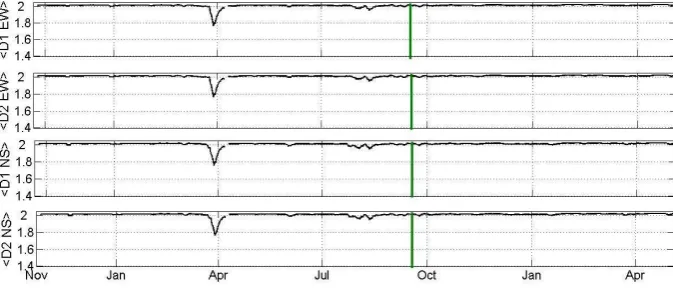
Fig. 3. Time evolution of Higuchi’s fractal dimension (D1 and D2) for NS and EW Acapulco data. In this case, the exponents are the result
of a moving average for windows of 25 points. The monitoring period is from June 1994 to July 1996. The EQ is marked with a vertical green line.
3 Data
The three monitoring electroseismic stations were located in Acapulco (16.85◦N, 99◦W), Coyuca (17.35◦N, 100.7◦W) and Ometepec (16.4◦N, 98.13◦W), all of them situated in the south of Mexican Pacific coast, which is one of the most important seismic regions in Mexico (Fig. 1). At each elec-troseismic station two self-potential time series were simulta-neously recorded, between two electrodes buried 2 m into the ground and separated by a distance of 50 m. A couple of elec-trodes was oriented in North-South direction (NS channel), and other one in East-West direction (EW channel). Two dif-ferent sampling rates were used:1t=4 s in Coyuca and Ome-tepec stations, and1t=2 s in Acapulco station (Yepez et al., 1995). The experimental equipment was based on the VAN methodology (Varotsos and Alexopoulos, 1984a, b). Almost all the time series monitored were continuous, nevertheless short lacks of data in Ometepec and Coyuca data sets were present. In Acapulco station the electric signal was recorded from June 1994 until July 1996 and, at Ometepec and Coyuca stations from November 1994 to July 1996.
4 Results and discussion
[image:3.595.132.468.251.395.2]Fig. 4
July 1996. The EQ is marked with a vertical green line.
[image:4.595.128.465.62.199.2]Fig. 5
Fig. 5. Time evolution of Higuchi’s fractal dimension (D1 and D2) for NS and EW Omepetec data. The monitoring period is from November
1994 to July 1996. The EQ is marked with a vertical green line.
HFD methods, is probably related to EQ preparation mecha-nism. Notice that Acapulco station is located 110 km from the main shock epicenter. This observation is within the empirical threshold 0.025 R≤M−4.5 given by Hayakawa et al. (2007) for ULF geomagnetic signals, here R is the dis-tance between the station and the epicenter and M is the EQ magnitude. We also remark that this kind of large anomalies has been reported for geoelectrical signal changes (during 56 days) for an M6.6 EQ in Japan (Uyeda et al., 2000).
Figures 4 and 5 show the DFA and HFD results for Omepetec (the nearest station to the EQ epicenter) data. Un-fortunately this station presents a lack of data (45 days be-fore the main shock). The analysis of the time variation of the two DFA-exponentsα1andα2reveals a white noise dy-namics (<α1>∼0.5) and a complex behavior (<α2>∼1) re-spectively. In particular,<α2>∼1 indicates the existence of 1/f-type long range correlations at large timescales, after the main shock,<α2>fluctuates around the average value 0.5. This value, which is typical of white noise dynamics, can suggest the onset of a relaxation process.
Figures 6 and 7 show the DFA and HFD results for the Coyuca ULF-geoelectrical data. Nevertheless, this station is the farthest one from the epicenter, it has been suggested that
under certain favorable conditions some geoelectric anoma-lies can be observed at such distances (Bernard, 1992). The time variation of<α1>indicates a white noise dynamics at low timescales, while the temporal evolution of<α2>shows an increment in April 1995 in both NS and EW channels. In particular, the increment observed inα2 – variation of the EW time series is the largest one. The time variation of the Higuchi’s fractal dimensions D1and D2shows a significant decrement in April 1995.
[image:4.595.126.467.247.390.2]A. Ram´ırez-Rojas: Statistical features prior to M7.4 Guerrero-Oaxaca EQ 1005
Fig. 6
Fig. 6. Time evolution of DFA-exponents (α1 andα2) for NS and EW Coyuca data. The monitoring period is from November 1994 to July 1996. The EQ is marked with a vertical green line.
[image:5.595.132.470.62.201.2]Fig. 7
Fig. 7. Time evolution of Higuchi’s fractal dimension (D1 and D2) for NS and EW Coyuca data. The monitoring period is from November
1994 to July 1996. The EQ is marked with a vertical green line. The crossover was less evident in Coyuca HFD-exponents.
(SES), monitored in Greece and Japan, by using the rescaled range analysis, finding that SES displays long-range corre-lations before the occurrence of large EQs. Ramirez-Rojas et al. (2004) showed the presence of a crossover frequency in Acapulco data,fc≈0.01 Hz, with different dynamical
behav-iors for small and large frequencies before the occurrence of the Guerrero-Oaxaca EQ.
We observe a possible mechanism of relaxation-preparation-main shock-relaxation process, which was also suggested by Varotsos (2005) for data collected in Greece. That is, before an earthquake the stress (pressure) gradually varies in the focal area affecting several physical properties, like the static dielectric constant (Varotsos, 1978; Varotsos, 1980), the conductivity (Kostopoulos et al., 1975; Varotsos and Alexopoulos, 1980) etc. Furthermore, this stress vari-ation may change the relaxvari-ation time for the orientvari-ation of the electric dipoles formed, due to lattice defects (Lazaridou et al., 1985). It may happen that, when the stress (pressure) reaches a critical value, these electric dipoles exhibit a co-operative orientation (collective orientation), thus leading to emission of transient electric signals termed Seismic Electric Signals, SES (Varotsos and Alexopoulos, 1984b). Hence,
since criticality is always associated with fractality, it is ex-pected that precursory electric signals should exhibit frac-tal properties (Varotsos, 2005), such as we observed for the Guerrero-Oaxaca EQ.
[image:5.595.129.466.250.394.2]variation of D1 and D2 especially for Coyuca data. Our conclusion is that these parameters, describing the dynam-ics of ULF geoelectrical data can be considered as good can-didates to precursors of the Guerrero-Oaxaca EQ occurred in September 1995. On the other hand, although the possible geoelectric precursors suggested by us seem to be significant, they lack of isotropy just, as it was reported by Yonaiguchi et al. (2007), for VHF electromagnetic emissions in Japan.
Acknowledgements. We thank C. G. Pavia-Miller for providing us some geoelectric data. FAB and LGV thanks partial support from EDI-COFAA-IPN and ARR thanks partial support from AFPI-CB-UAM.
Edited by: P. F. Biagi
Reviewed by: two anonymous referees
References
Bernard, P.: Plausibility of long distance electrotelluric precursors to earthquakes, J. Geophys. Res., 97, 17 531–17 596, 1992. Eftaxias, K., Kapiris, P., Polygiannakis, J., Kopanas, J.,
Peratza-kis, A., Skountzos, P., and Jaggard, D.: Review and a model of pre-peismic electromagnetic emissions in terms of fractal elec-trodynamics, Fractals, 12, 243–273, 2004.
Flores-M´arquez, E. L., M´arquez Cruz, J., Ram´ırez-Rojas, A., G´alvez-Coyt, G., and Angulo-Brown, F.: A statistical analysis of electric self-potential time series associated to two 1993 earth-quakes in M´exico, Nat. Hazard Earth Sys., 7, 549–556, 2007. Fraser-Smith, A. C., Bernardi, A., McGill, P. R., Ladd, M. E.,
Hel-liwell, R. A., and Villard Jr., O. G.: Low-frequency magnetic field measurements near the epicenter of the Ms 7.1 Loma Prieta earthquake, Geophys. Res. Lett., 17, 1465–1468, 1990. Gotoh, K., Hayakawa, M., Smirnova, N. A., and Hattori, K.: Fractal
analysis of seismogenic ULF emissions, Phys. Chem. Earth, 29, 419–424, 2004.
Hayakawa, M., Kawate, R., Molchanov, O. A., and Yumoto, K.: Re-sults of ultra-low-frequency magnetic field measurements during the Guam earthquake of 8 August 1993, Geophys. Res. Lett., 23, 241–244, 1996.
Hayakawa, M., Ito, T., and Smirnova, N.: Fractal analysis of ULF geomagnetic data associated with the Guam earthquake on 8 Au-gust 1993, Geophys Res. Lett., 26, 2797–2800, 1999.
Hayakawa, M., Hattori, K., and Ohta, K.: Monitoring of ULF (ultra-low-frequency) geomagnetic variations associated with earth-quakes, Sensors, 7, 1108–1122, 2007.
Higuchi, T.: Approach to an irregular time series on basis of the fractal theory, Physica D, 31, 277–283, 1988.
Higuchi, T.: Relationship between the fractal dimension and the power law index for a time series: A numerical investigation, Physica D, 46, 254–264, 1990.
Ida, Y., Hayakawa, M., Adalev, A., and Gotoh, K.: Multifractal analysis for the ULF geomagnetic data during the 1993 Guam earthquake, Nonlinear Proc. Geoph., 12, 157–162, 2005. Ida, Y., and Hayakawa, M.: Fractal analysis for the ULF data during
the 1993 Guam earthquake to study prefracture criticality, Non-linear Proc. Geoph., 13, 409–412, 2006.
Ida, Y., Hayakawa, M., and Timashev, S.: Application of differ-ent signal analysis methods to the ULF data for the 1993 Guam earthquake, Nat. Hazard Earth Sys., 7, 479–484, 2007.
Kopytenko, Y. A., Matishvili, T. G., Voronov, P. M., Kopytenko, E. A., and Molchanov, O. A.: Detection of ultra-low-frequency emissions connected with the Spitak earthquake and its after-shock activity, based on geomagnetic pulsations data at Dusheti and Vatdzia observations, Phys. Earth Planet. Inter., 77, 85–95, 1993.
Kostopoulos, D., Varotsos, P., and Mourikis, S.: The conductivity of crystalline NaI, Can. J. Phys. 53, 1318–1320, 1975.
Lazaridou, M., Varotsos, C., Alexopoulos, K., and Varotsos, P.: Point defect parameters of LiF, J. Phys. Chem., Solid State, 18, 3891–3895, 1985.
Molchanov, O. A., Kopytenko, Y. A., Voronov, P. M., Kopytenko, E. A., Matiashvill, T. G., Fraser-Smith, A. C., and Bernardi, A.: Results of ULF magnetic field measurements near the epicen-ters of the Spitak (Ms=6.9) and Loma Prieta (Ms=7.1) earth-quakes: Comparative analysis, Geophys. Res. Lett., 19, 1495– 1498, 1992.
Peng, C.-K., Buldyrev, S. V., Havlin, S., Simons, M., Stanley, H. E., and Goldberger, A. L.: Mosaic organization of DNA nucleotides, Phys. Rev. E 49, 1685, 1994.
A. Ram´ırez-Rojas: Statistical features prior to M7.4 Guerrero-Oaxaca EQ 1007
Ramirez-Rojas, A., Pavia-Miller, C. G., and Angulo-Brown, F.: Sta-tistical behavior of the spectral exponent and the correlation time of electric self-potential time series associated to the Ms=7.4 14 September 1995 eqrthquake in Mexico, Phys. Chem. Earth, 29, 305–312, 2004.
Smirnova, N., Hayakawa, M., Gotoh, K., and Volobuev, D., Scaling characteristics of ULF geomagnetic field at the Guam seismoac-tive area and their dymanics in relation to the earthquake, Nat. Hazard Earth Sys., 1, 119–126, 2001.
Smirnova, N., Hayakawa, M., and Gotoh, K.: Precursory behav-ior of fractal characteristics of the ULF electromagnetic fields in seismic active zones before strong earthquakes, Phys. Chem. Earth, 29, 445–451, 2004.
Telesca, L., Cuomo, V., Lapenna, V., and Macchiato, M.: A new approach to investigate the correlation between the geoelectrical time fluctuations and earthquakes in a seismic area of southern Italy, Geophys. Res. Lett., 28, 4375–4378, 2001.
Telesca L., Colangelo, G., Lapenna, V. and Macchiato M., Monofractal and multifractal characterization of geoelectrical signals measured in southerm Italy, Chaos Soliton. Frac., 18, 385–399, 2003.
Telesca L., Colangelo, G., Lapenna, V.: Multifractal variability in geoelectrical signals and correlation with seismicity: a study case in southerm Italy, Nat. Hazard Earth Sys., 5, 673–677, 2005a. Telesca L., Lapenna, V., and Macchiato, M.: Multifractal
fluctua-tion in earthquake related geoelectrical signals, New J. Phys., 7, 214, doi:10.1088/1367-2630/7/1/214, 2005b.
Telesca, L., Balasco, M., and Lapenna, V.: Investigating the time correlation properties in self-potential signals recorded in a seis-mic area of Irpinia, southern Italy, Chaos Soliton. Frac., 32, 199– 211, 2007.
Uyeda, S. T., Nagao, Y., Orihara, T., Yamaguchi, and Takahashi I.: Geoelectric potential changes: Possible precursors to earth-quakes in Japan, Proc. Nat. Ac. Sc. (PNAS) 97–9, 4561–4566, 2000.
Varotsos, P. A.: An estimate of the pressure dependence of the di-electric constant in alkali halides, Phys. Status Solidi B, 90, 339– 343, 1978.
Varotsos, P. A.: Determination of the dielectric constant of alkali halide mixed crystals, Phys. Status Solidi B, 100, K133–138, 1980.
Varotsos, P. and Alexopoulos, K.: Negative activation volumes of defects in solids, Phys. Rev. B, 21, 4898–4899, 1980.
Varotsos, P. and Alexopoulos, K.: Physical properties in the vari-ation of the electric field of the Earth preceding earthquakes, I. Tectonophysics, 110, 73–98, 1984a.
Varotsos, P. and Alexopoulos, K.: Physical properties in the varia-tion of the electric field of the Earth preceding earthquakes, II. Tectonophysics, 110, 99–125, 1984b.
Varotsos, P. A., Lazaridou, M., Eftaxias, K., Antonopoulos, G,, Makrris, J., and Kopanas, J.: Short term earthquake prediction in Greece by seismic electric signals, in: A critical Review of VAN, edited by: Sir James Lighthill, World Scientific, 29–76, 1996.
Varotsos, P. A., Sarlis, N. V., and Skordas, E. S.: Long-range corre-lations in the electric signals that precede rupture, Phys. Rev. E, 66, 011902, 2002.
Varotsos, P. A., Sarlis, N. V. and Skordas, E. S.: Attempt to distin-guish electric signals of a dichotomous nature, Phys. Rev. E, 68, 031106, 2003.
Varotsos, P. A.: The Physics of Seismic Electric Signals, TerraPub, Tokyo, 338 pp., 2005.
Y´epez, E., Angulo-Brown, F., Peralta, J. A., Pav´ıa-Miller, C. G. and Gonz´alez-Santos, G.: Electric fields patterns as seismic precur-sors, Geophys. Res. Lett., 22, 3087–3091, 1995.