arXiv:cs/0702140v1 [cs.DL] 23 Feb 2007
Assessing the value of cooperation in Wikipedia
Dennis M. Wilkinson and Bernardo A. Huberman
HP Labs, Palo Alto, CA 94304
February 1, 2008
Abstract
Since its inception six years ago, the online encyclopedia Wikipedia has
accumu-lated 6.40 million articles and 250 million edits, contributed in a predominantly
undirected and haphazard fashion by 5.77 million unvetted volunteers. Despite
the apparent lack of order, the 50 million edits by 4.8 million contributors to
the 1.5 million articles in the English-language Wikipedia follow strong certain
overall regularities. We show that the accretion of edits to an article is
de-scribed by a simple stochastic mechanism, resulting in a heavy tail of highly
visible articles with a large number of edits. We also demonstrate a crucial
cor-relation between article quality and number of edits, which validates Wikipedia
Introduction
The online encyclopedia Wikipedia1
is an impressive example of a global collective
intelligence at work. Since its inception in January 2001, Wikipedia has grown to
encompass 6.40 million articles in 250 languages generated from 236 million edits by
5.77 million contributors2
, as of this writing. Its growth has been exponential in key
metrics such as number of editors and number of articles [22]. That the content of
Wikipedia is deemed useful and relevant by the user community at large is confirmed
by its current position as 11th most visited site on the Internet3
, serving an average
of 16536 requests per second4
.
Since Wikipedia lets any user modify any article or create new articles, it
vir-tually eliminates the barrier to contribution. This scheme paves the way for rapid
expansion, but at uncertain cost to the article quality and value. It is of interest
to understand Wikipedia’s growth and to assess the quality and value of its
arti-cles, both to evaluate Wikipedia as a cooperative process and because of its great
popularity. A number of recent studies have focused on these goals.
Wikipedia has been studied in the context of network dynamics [23], with the
addition of new articles described by a time-dependent acceleration mechanism [18]
or a somewhat puzzling preferential attachment model [5]. Other work has examined
the evolution of editors’ roles and contributions in Wikipedia’s development [14]. A
power law relation for a fraction of the distribution of edits per article has been
observed [4, 22], but no mechanism was proposed. While all this work contributes
to the understanding of Wikipedia as a complex system, it does not provide insight
into its development at the level of individual articles.
1
http://wikipedia.org
2
http://meta.wikimedia.org/wiki/List of Wikipedias
3
http://www.alexa.com/
4
A number of methods for automatic assessment of the quality of Wikipedia’s
articles have also been proposed. In [15], the number of edits and unique editors to an
article were suggested as metrics for quality, but no justification was provided. Other
characteristics such as factual accuracy [12, 11, 9], credibility [6], revert times [21],
and formality of language [10] have been used to assess small samples of Wikipedia’s
articles and in some cases compare them to articles of traditional encyclopedias. It
is doubtful that encyclopedia quality can be assessed using a single metric (e.g. [8]),
but complex combinations of metrics [20] depend on rather arbitrary parameter
choices. A crucial element lacking from previous tests of metrics of article quality is
any consideration of article popularity or relevance, which can clearly be expected
to affect metrics such as number of edits, number of links, article length, number of
images, and many others.
In this paper we first show that Wikipedia articles accrete edits according to a
simple stochastic mechanism resulting in a population of disproportionally
highly-edited articles. We then demonstrate a strong correlation between number of edits
and article quality. Topics of particular interest or relevance are thus naturally
brought to the forefront of quality. This is significant because Wikipedia is frequently
used as a source of information, and because other large collaborative efforts such
as software development [3], industrial design [1] and cooperative problem solving
[7] are known to produce ambiguous results as the size of the project increases.
At the heart of the evolution of a Wikipedia articles is the simple rule edits
beget edits. That is, the number of new edits to a given article at a given time is
a randomly varying percentage of the total number of previous edits. This process
produces a lognormal distribution in the number of edits per article for articles
created during a particular time slice, where the distribution parameters µ and σ2
depend linearly on the age of the time slice. The lognormal distribution implies
population of articles with a disproportionally large number of edits. Additionally,
the increase inµwith article age implies that articles continue to accrete edits and
do not reach a steady state.
To examine the correlation between edit volume and article quality, we compared
the average number of edits and contributors on “featured” articles, selected by the
Wikipedia community as “the best articles in Wikipedia,” to the corresponding
averages for other articles. The results show a strong correlation between number of
edits, number of distinct editors, and article quality. In making this comparison, it
is crucially important to control for the article visibility or relevance, since featured
articles tend to deal eith more popular subjects. Article age must also be taken into
consideration, since on average older articles have more edits. Care was taken to
control for these variables.
Article growth
While individual users exhibit highly variable editing activities, the overall pattern
of how articles accrete edits is well-described by the simple stochastic mechanism
described as follows.
Consider the number of new edits ∆n(t) to an article made between timet and
timet+dt, an interval of perhaps several hours. Of course, complicated fluctuations
in human behavior and activity cause this number to vary in a random way, but we
claim that ∆n(t) is on average proportional to the total number of previous edits.
This is expressed mathematically as
∆n(t) = [a+ξ(t)]n(t),
where n(t) is the total number of edits to a given article up until time t, a is
a constant (average) rate of edit accretion, and ξ(t) is mean-zero random term
by
n(t+dt) =n(t) + ∆n(t) = [1 + (a+ξ(t))]n(t). (1)
Because of the random nature of human activity embodied by ξ(t), the number
of edits to a given article at a given time can be predicted only within a range of
values specified by a probability distribution. Previous work on similar processes,
such as World Wide Web traffic [13] and many others (e.g., [17]), has shown that
the distribution resulting from equation (1) is lognormal5
and given by
P[n(t)] = 1
n√2π√s2texp
−
(logn−at)2
2(s2t
)
, (2)
where s2
is the variance of the ξ(t). This equation shows that the distribution
parameters µ= at and σ2 = s2t are linearly related to the age t of the article. µ
andσ2
represent the mean and variance, respectively, of the log of the data, and are
thus related to but not equal to the distribution mean and variance. In practice,
we considered articles created during a time slice of average agetin order to obtain
enough data points to constitute a distribution. Provided the time slice is not too
long, editing within the slice does not corrupt the distribution much.
Equation (2) is verified by a study of the 50.0 million edits made by the 4.79
million non-robot contributors to the 1.48 million articles of the English-language
Wikipedia between its inception in January 2001 and November 2, 2006. A
statis-tical test of all time slices yields ap-value of greater than 0.5 for 50.9 % of the 3688
relevant time slices for the lognormal distribution (further details on the test and
the data are provided in the appendix). The shape of the distribution of edits for
5
In equation 1, the noise terms at differentt are assumed to be uncorrelated. In fact, as one might expect, the percentage increase in edits does demonstrate a small positive autocorrelation over periods of less than 20 to 30 days. Since the autocorrelation length is finite, however, the central limit theorem may still be applied to obtain a log-normal distribution; the difference is that the rate parameter a must be modified to account for the autocorrelation [2]. Because the
0 1 2 3 4 5 6 7 8 0 5 10 15 20 25 30 35 40 45 50
log (number of edits)
counts
articles 240 weeks old
0 1 2 3 4 5 6 7 8
0 20 40 60 80 100 120 140 160
log (number of edits)
counts
articles 180 weeks old
0 1 2 3 4 5 6 7 8
0 50 100 150 200 250
articles 120 weeks old
log (number of edits)
counts
Figure 1: Distributions of the logarithm of the number of edits per article for articles of
agest= 240, 180, and 120 weeks. Because the distribution of the counts is lognormal, the
logarithm of the counts should be normally distributed, and the best fit normal curve is included for comparison. Note how the distribution mean increases with age, as expected, while the number of counts per week increases (due to the overall growth of Wikipedia).
articles in various time slices is best displayed using a histogram of the logarithm
of the edit counts, which follows a normal distribution with mean µ(t) and variance
σ2(t), as shown in figure 1. The actual lognormal distribution for one time slice,
showing only a portion of the tail, is pictured in figure 2.
The variation of the distribution parametersµand σ2 with age is demonstrated
in figure 3. The linear dependence is highlighted by the fitted curve. Anomalous
time slices which do not fit the overall trend are noted in the figure as well. Because
of a single editor’s activity, these slices contain an unusually high number of articles
with low edit counts.
0 200 400 600 800 1000 0 10 20 30 40 50 60 70 80 90 100
number of edits
counts
Figure 2: Lognormal distribution for the number of edits per article for articles of age
t= 240 weeks. The plot was truncated at the high end of both axes for readability; in fact,
there are articles in this time slice with many thousands of edits. The best fit lognormal curve is included for comparison.
0 50 100 150 200 250 300 0 1 2 3 4 5 6 7
week since inception (Jan 2001)
log (number of edits)
mean µ linear fit to µ variance σ2 linear fit to σ2
high variance from small number of data points per week
Pages from glossary of telecommunication
terms US town pages
low edit counts for "stub" articles which have not yet been deleted or combined into regular articles
Figure 3: Evolution of the meanµand varianceσ2 of the lognormal distribution of edits
per article. Thex-axis represents the week in which articles were created, and the y-axis
the meanµor varianceσ2 of the log of the number of edits to articles created during that
week. The deviations from the pattern include two periods in which a large number of rather trivial articles with low edit counts were created at once, and the recent data containing a large number of short “stub” articles which have yet to be combined into regular articles or deleted.
small number of articles accrete a disproportionally large number of edits. As we
multiplicative mechanism of edit accretion thus creates a small body of high quality
articles. These high quality articles deal with topics of high visibility or relevance,
while the vast majority of Wikipedia articles are relatively infrequently edited and
have far lower visibility.
Since each time slice follows a lognormal distribution, the overall distribution of
edits per article is a mixture over time of lognormals with linearly varyingµandσ2
,
multiplied by a factor accounting for the overall growth of Wikipedia. This integral
is not analytic for the time frame of our data, but by numerical integration can be
shown to retain a lognormal character6
.
Edits and article quality
As discussed in the introduction, it is of considerable interest to determine whether
extensive editing by a large number of diverse contributors increases article quality.
To test for a correlation between editing and article quality, we compared the
num-ber of edits and contributors to the 1211 “featured” articles to the corresponding
numbers for other articles. As mentioned above, featured articles are those selected
by the Wikipedia community as “the best articles in Wikipedia” according to
cri-teria such as accuracy, neutrality, completeness, and style7
. Featured articles which
do not continue to uphold these high standards are demoted.
Care must be taken when comparing edit volumes on different populations of
articles. First of all, the relevance or visibility of an article’s topic must be taken
into account. Secondly, the age of the article also affects its number of edits, as
demonstrated by figure 3.
6
In the long-time limit, the integral tends towards a power law if overall growth is exponential [13]. However, the time frame of our data set is not the long time limit, in contrast to the findings of [4] who report a power law fit for the overall distribution of edits per article.
7
1 2 3 4 5 6 7 8 0 1 2 3 4 5 6 7 8 9 pagerank
log (number of edits)
featured articles other articles
1 2 3 4 5 6 7 8
0 1 2 3 4 5 6 7 8 9 pagerank
log (number of editors)
featured articles other articles
Figure 4: Average and standard deviation (error bars) for the log of the number of edits,
at left, and number of distinct editors, at right, per article. The articles are grouped by pagerank for reasons of relevance and visibility as discussed in the text.
To control for article visibility or relevance, we grouped articles by their Google
pagerank before comparing them. We also controlled for the added visibility some
featured articles obtain when they appear on the Wikipedia front page by
discount-ing the edits made durdiscount-ing this period. These results, which do not yet account for
article age, are shown in figure 4. For all pageranks except 7, a strong correlation
between edits or editors and quality is seen. The anomalous behavior at pagerank
7 disappears when age is accounted for, below8
.
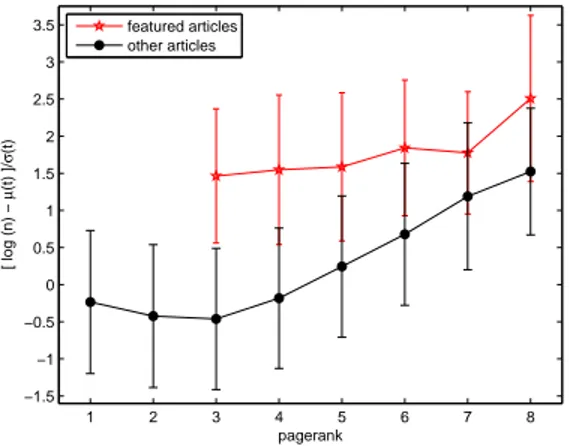
To control for article age, we normalized (the logarithm of) the number of edits
to an article of age t by the mean and variance for all articles of that age, as
previously computed (figure 3). For a given article A of age t having undergone
n(A) edits, we thus computed the difference between log[n(A)] and the average µ(t)
of the logarithm of the number of edits of aget, in units of σ(t):
x(A) = logn(A)−µ(t)
σ(t) . (3)
The featured and nonfeatured populations were then compared using this metric,
with the results shown in figure 5.
8
1 2 3 4 5 6 7 8 −1.5
−1 −0.5 0 0.5 1 1.5 2 2.5 3 3.5
pagerank
[ log (n) −
µ
(t) ]/
σ
(t)
featured articles other articles
Figure 5: Average and standard deviation (error bars) of the age-normalized measure of
edit volume (equation 3), grouped by pagerank.
The plots of figures 4 and 5 show a strong correlation between number of edits,
number of distinct editors, and article quality in Wikipedia. The heavy tail of
ar-ticles with disproportionally high edit counts discussed previously thus represents a
collection of predominantly high quality articles. It is also interesting that pagerank,
reportedly a logarithmic scale, is more or less linearly related to the number of edits
or editors of an article9
.
As to the question of causality between edits and quality, recall that articles
always continue to accrete edits and evolve instead of reaching a steady state, as we
showed. Resolving causality in an aggregate sense is thus most likely impossible.
Indeed, the development of an article is a highly complex process [19] and both
directions of causality between editing and quality are likely to play a role.
9
Conclusion
We have shown that although Wikipedia is a complex system in which of millions of
diverse editors collaborate in an unscheduled and virtually uncontrolled10
fashion,
editing follows a very simple overall pattern. This pattern implies that a small
number of articles, corresponding to topics of high relevance or visibility, accrete a
disproportionately large number of edits.
And, while large collaborations have been shown to fail in many contexts, Wikipedia
article quality continues to increase, on average, as the number of collaborators and
the number of edits increases. Thus, topics of high interest or relevance are naturally
brought to the forefront of visibility and quality.
Acknowledgments: We thank Travis Kriplean for his work in helping process the
data set and Yuri Karaban for his Perl module.
Appendix: Methods
The raw data for our study were all 55.3 million edits to the English-language
Wikipedia made between Wikipedia’s inception in January 2001 and November 2,
2006. This data included username or url, page title, and timestamp11
. From the
raw data, we eliminated redirect and disambiguation pages, which are articles with
no content that merely point to other articles, and edits made by robots. Redirects
and disambiguation pages were identified using simple text analysis. Robot edits
10
In fact, a group of dedicated “administrative users” have provided ideological guidance, super-vision in the worst cases or dispute or vandalism, and a relatively large number of contributions to Wikipedia. However, the process of editing remains almost completely unsupervised.
11
were identified using the list of registered Wikipedia robots12
, and by identifying
edits made by a single user in improbably quick succession. This process eliminated
5.23 million edits, or 9.5 % of the original 55.3 million.
A small percentage of articles were not used because of technical difficulties in the
title caused by rare foreign characters. Google pageranks were obtained by querying
Google13
. Some recent articles did not yet have a pagerank and so pagerank zero
articles were not included in the analysis.
To test the lognormal fit and obtain the quotedp-value, we applied a typical χ2
fitting procedure to each time slice using the likelihood ratio statistic [16]. In this
test, the time slice length was variable because of the overall growth of Wikipedia;
more recent articles were grouped into smaller slices because otherwise the
distri-bution was skewed by edits made within the slice. In practice, we chose time slices
long enough to contain 400 articles. The expected distribution for each slice was
cal-culated using the slice’s sample mean and variance, and the data was grouped into
bins whose width was the minimum required to make the expected count greater
than 8. Of course, slight variations in the quoted p-value, on the order of several
percent, were obtained by varying the time slice length and bin size.
12
http://en.wikipedia.org/wiki/Wikipedia:Registered bots
13
References
[1] T. J. Allen. Studies of the problem solving process in engineering. IEEE Trans. Engineering Management, EM-13(2):72–83, 1966.
[2] K. N. Berk. A central limit theorem for m-dependent random variables with unboundedm. Ann. Prob., 1(2):352–354, 1973.
[3] F. Brooks. The Mythical Man-month. Addison-Wesley, Reading, Mass., 1975.
[4] L. Buriol, C. Castillo, D. Donato, S. Leonardi, and S. Millozzi. Temporal evolution of the Wikigraph. InProc. of the Web Intelligence Conference, Hong Kong, 2006.
[5] A. Capocci, V. Servidio, F. Colaiori, L. Buriol, D. Donato, S. Leonardi, and G. Caldarelli. Preferential attachment in the growth of social networks: the case of Wikipedia. Phys. Rev. E, 74:036116, 2006.
[6] T. Chesney. An empirical examination of Wikipedias credibility. First Monday, 11(11), 2006. [7] Scott Clearwater, Bernardo Huberman, and Tad Hogg. Cooperative solution of constraint
satisfaction problems. Science, 254(5035):1181–1183, 1991.
[8] H. Crawford. Encyclopedias. In R. Bopp and L. C. Smith, editors,Reference and information services: and introduction, 3rd ed., pages 433–459, Englewood, CO, 2001. Libraries Unlimited. [9] Editorial. Britannica attacks... and we respond. Nature, 440, 2006.
[10] W. Emigh and S. Herring. Collaborative authoring on the Web. InProc. 39th Hawaii Inter-national Conference on System Sciences, 2005.
[11] Encyclopaedia Britannica. Fatally flawed: refuting the recent study on encyclopedic accuracy by the journal Nature, March 2006.
[12] Jim Giles. Internet encyclopaedias go head to head. Nature, 438:900–901, 2005.
[13] B. A. Huberman and L. Adamic. Growth dynamics of the World Wide Web.Nature, 401:131, 1999.
[14] A. Kittur, E. Chi, A. Pendleton, B. Suh, and T. Mytkowicz. Power of the few vs. wisdom of the crowd: Wikipedia and the rise of the bourgeoisie. submitted for publication.
[15] A. Lih. Wikipedia as participatory journalism. In Proc. 5th International Symposium on Online Journalism, austin, TX, 2004.
[17] S. M. Ross. Stochastic processes. John Wiley, New York, 1996.
[18] D. Smith, J. Onnela, and N. Johnson. Accelerating networks. preprint.
[19] B. Stvilia, M. B. Twidale, L. C. Smith, and L. Gasser. Information quality work organization in wikipedia. submitted for publication.
[20] B. Stvilia, M. B. Twidale, L. C. Smith, and L. Gasser. Assessing information quality of a community-based encyclopedia. InProc. ICIQ 2005, pages 442–454, Cambridge, MA, 2005. [21] F. Viegas, M. Wattenberg, and K. Dave. Studying cooperation and conflict between authors
with history flow visualizations. InProc. CHI 2004, pages 575–582, Vienna, Austria, 2004. [22] J. Voss. Measuring Wikipedia. InProc. ISSI 2005, Stockholm, 2005.